INTRODUCTION
Blood coagulation tests are used in a variety of ways in the medical field, from screening to confirmation and followup of bleeding and thrombotic disorders. Although previously these tests were performed manually, automat
ed machines are now commonly used. Recently, numer
ous systems have been developed that can simultaneously
perform various methods to obtain results, and different types of blood coagulation tests are conveniently carried out in real time. However, obtaining accurate coagulation test results has become increasingly important, and dif
ferent assay methods and reagents that can alter results can have a significant effect. In addition, with the increase in inspection requirements for laboratory tests, the evalu
ation of the correlation of existing devices and the perfor
Performance Evaluation and Local International Sensitivity Index Verification Using Automated Coagulation Analyzer Coapresta 2000
Ji Yeon Ham and Jang Soo Suh
Department of Clinical Pathology, School of Medicine, Kyungpook National University, Daegu, Korea
Background: The Coapresta 2000 (CP2000; Seikisui, Japan) system is a fully-automated random-access multiparameter coagulation analyzer equipped with a photo-optical clot detection unit. It can perform clotting time assays as well as colorimetric assays.
Methods: We evaluated the analytical performance of CP2000 for several coagulation test parameters and compared its performance with that of the CA-7000 (Sysmex, Japan) system.
Fresh and frozen plasma samples were used to evaluate the performance of CP2000 with respect to four routine coagulation test parameters: prothrombin time (PT), activated partial thromboplastin time, fibrinogen, and D-dimer. On-board stability of the liquid reagents was confirmed. Additionally, local international sensitivity index (ISI) verification was performed with four levels of calibrants and direct PT/international normalized ratio (INR) line.
Results: The intra- and inter-assay coefficients of variation were below 5% for every parameter in both normal and pathological ranges. Carryover was not detected. The results obtained using CP2000 showed good correlation (r
2over 0.95) with those obtained by the CA-7000 analyzer. On-board stability in open-vial state, which was expected to be much longer than that of other reagents, was confirmed. Local verification of ISI showed an acceptable bias range of INR, compared with the values using calibrants.
Conclusions: The high-throughput, CP2000 analyzer is a fast, user-friendly system with long on-board reagent stability. Its results were concordant with the CA-7000 analyzer, for analysis of the routine coagulation test parameters. Furthermore, this system would add greater confidence to the reporting of INR data.
(J Lab Med Qual Assur 2018;40:38-45)
Key Words: Coapresta 2000, Coagulation test, Local international sensitivity index veri- fication, Direct prothrombin time/international normalized ratio line
Corresponding author:
Jang Soo Suh
Department of Clinical Pathology, School of Medicine, Kyungpook National University, 680 Gukchaebosang-ro, Jung-gu, Daegu 41944, Korea
Tel: +82-53-200-5293 Fax: +82-53-200-3367 E-mail: [email protected]
pISSN: 2384-2458
eISSN: 2288-7261 Received October 12, 2017, Revision received January 15, 2018, Accepted January 18, 2018
mance of new equipment has become essential whenever a new blood coagulation device is introduced.
Coapresta 2000 (CP2000; Sekisui Medical Co., Tokyo, Japan), which has a fully automated and highthroughput system, is a randomaccess multiparameter coagulation analyzer that is equipped with a photooptical clot detec
tion unit. It can perform clotting time and colorimetric assays. Efficient space utilization is possible because of its small size, and a large number of specimens can be quick
ly and accurately processed because of its speed (clotting assay: 400 tests/hr and photometric assay: 200 tests/hr), thus making emergency inspection possible [1,2]. Herein, the performance of the CP2000 system was evaluated, and the results were compared with that of the CA7000 (Sysmex Co., Tokyo, Japan) system, which is now rou
tinely used in Kyungpook National University Hospital. In addition, for more accurate international normalized ratio (INR) data, the local international sensitivity index (ISI) value was verified using calibrated plasmas.
MATERIALS AND METHODS
1. Instruments and Reagents
Quality control materials in low and high concentrations (Coagpia control set; Sekisui Virotech, Tokyo, Japan) were used to evaluate prothrombin time (PT; includ
ing the results in seconds, %, and INR value), activated partial thromboplastin time (aPTT), fibrinogen, fibrin degradation product (FDP), and Ddimer tests using the CP2000 system. For PT analysis, Coagpia PTN (including thromboplastin of rabbit brain origin, Sekisui Virotech) material was used instead of ThromborelS (Siemens Healthcare Diagnostics, Marburg, Germany), which is currently used in the CA7000 system. All tests were per
formed according to the manufacturer’s instructions.
2. Sample and Storage
Every sample was added to a 3.2% sodium citrate tube (Becton Dickinson Ltd., Franklin Lakes, NJ, USA) at a precise sample:anticoagulant ratio of 9:1 and centrifuged at 1,500 g for 15 minutes to obtain plasma. A random se
lection of ordered coagulation test specimens, excluding in
adequate specimens (insufficient volume, hemolysis, clot), was used for the correlation evaluation, using CA7000 as the routine testing system. Moreover, random samples containing low or high levels of fibrinogen and Ddimer were used for the carryover evaluation. When the onboard stability of the reagents was examined, pooled plasma samples were frozen at -70°C as aliquots and then used for the evaluation of reagents until the expiry date as pro
posed by the manufacturer. After testing with CA7000, samples were immediately run in CP2000. If immediate examination after a routine analysis was not possible, remnant samples were refrigerated (2°C-4°C) and tested within 4 hours.
3. Evaluation 1) Precision
The results of PT (including the results in seconds, %, and INR value), aPTT, fibrinogen, and Ddimer were cali
brated using low and high concentrations of quality control materials for 10 repetitive sessions in one day to assess the intraassay (withinrun) precision. To estimate the interassay (betweenrun) precision for similar test items, two independent sessions were examined per day for 10 days. Every session was tested in duplicate according to appropriate Clinical and Laboratory Standards Institute (CLSI) guidelines [3]. The mean, standard deviation (SD), and coefficient of variation (CV) for each test item were calculated.
2) Correlation with CA-7000
PT, aPTT, fibrinogen, and Ddimer results obtained by CP2000 were compared with those of CA7000 using the proper number of normal and abnormal patient plasma cells. CA7000 results were treated as the standard, and the correlation coefficient ( r) was calculated. The correla
tion was evaluated based on the CLSI guidelines [3,4].
3) Carryover
High and low fibrinogen and Ddimer patient samples, which were obtained during routine analysis of fibrinogen and Ddimer test carryover rates, were calculated us
ing the following equation: {L1(L3L4)/2}/{(H2+H3)/2
(L3+L4)/2}×100. The acceptable range of the carryover rate was less than 1.0%.
4) On-board stability of reagents
As much longer sustained stability is claimed by the manufacturer for the reagents used in CP2000 than other coagulation analyzers, the confirmation process was per
formed during the proposed stable periods of each test.
Twolevel quality control materials and frozen (-70°C) pooled plasma were tested, and these results were used to evaluate the onboard stability of five reagents, including PT, aPTT, fibrinogen, FDP, and Ddimer, using CP2000.
Every sample was tested in duplicate, and the mean, SD, and CV for each test item were calculated.
5) Local international sensitivity index verification
The fourlevel (one normal level and three abnormal levels; with an INR range of 1.54.5) calibrated plasma samples (AKCalibrant; Technoclone, Vienna, Austria) were used for local ISI verification. The AKCalibrant is a lyophilized normal plasma pool, which is known to be produced from the selected citrated plasma of at least 100 blood samples of healthy donors. The assigned value of local ISI 1.04 was verified according to the suggested guidelines [5]. The INRs of the calibrated plasmas were calculated from local PTs and ISI (measured in triplicate) and compared with the calibrated values of the INR. It is considered appropriate if the difference between the two values is less than 15%. When the differences between the two values were over 15%, the local ISI was calibrated
to obtain an accurate INR. After the linear regression of log local PT results that correspond to log certified INR values, a valid calibration curve ( r
2) was required to be greater than 0.95. A simple and direct PT/INR line, which was recently discovered, does not require a local ISI, and mean normal prothrombin time (MNPT) was used to determine if the bias between the local INR and INR that was derived from the direct line is less than 10% [6].
6) Statistics
Statistical analysis was performed using the Analyse
it Software (Analyseit Software Ltd., Leeds, UK). The Pearson correlation coefficient ( r) of the two devices was calculated.
RESULTS
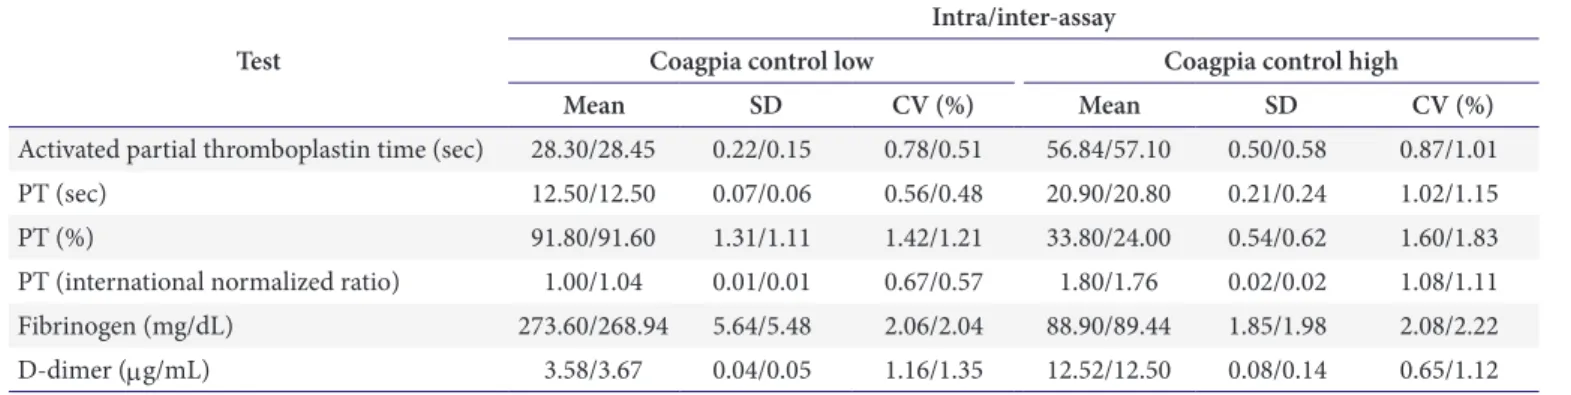
1. Precision
For every item that was tested, the precision results were significant and within 3% of the CV. The intraassay precision ranged from 0.56% to 2.08%, while the inter
assay precision ranged from 0.48% to 2.22% (Table 1).
2. Correlation with CA-7000
The results of PT (including the results in seconds, %, and INR value), aPTT, fibrinogen, and Ddimer using CP2000 showed a high and statistically significant correla
tion with those of CA7000. The correlation coefficient ( r) was higher than 0.95 for every item except aPTT (0.9445) (Table 2, Fig. 1).
Table 1. Intra-assay and inter-assay precisions of the CP2000 analyzer Test
Intra/inter-assay
Coagpia control low Coagpia control high
Mean SD CV (%) Mean SD CV (%)
Activated partial thromboplastin time (sec) 28.30/28.45 0.22/0.15 0.78/0.51 56.84/57.10 0.50/0.58 0.87/1.01
PT (sec) 12.50/12.50 0.07/0.06 0.56/0.48 20.90/20.80 0.21/0.24 1.02/1.15
PT (%) 91.80/91.60 1.31/1.11 1.42/1.21 33.80/24.00 0.54/0.62 1.60/1.83
PT (international normalized ratio) 1.00/1.04 0.01/0.01 0.67/0.57 1.80/1.76 0.02/0.02 1.08/1.11
Fibrinogen (mg/dL) 273.60/268.94 5.64/5.48 2.06/2.04 88.90/89.44 1.85/1.98 2.08/2.22
D-dimer (mg/mL) 3.58/3.67 0.04/0.05 1.16/1.35 12.52/12.50 0.08/0.14 0.65/1.12
Abbreviations: SD, standard deviation; CV, coefficient of variation; PT, prothrombin time.
3. Carryover
Carryover rates that were below 1% (fibrinogen, 0.2%;
Ddimer, 0.2%) between high and low concentration sam
ples were acceptable.
4. Onboard Stability of the Reagents
For every item that was tested during the manufactur
erproposed shelf life, the reagents’ onboard stability in the openvial state was sustained, with every test result
falling within 5% of the CV, ranging from 0.50% to 4.53%
(Table 3).
5. Local ISI Verification
The differences between routine INR and certified INR were 15% or less (Table 4). The linear regression of log local PT results that correspond to the log certified INR values revealed that r
2was greater than 0.95 (Fig. 2).
In addition, the difference of less than 10% between the
Table 2. Correlation between CA-7000 and CP2000Test Number CA-7000 CP2000 r*
Activated partial thromboplastin time (sec) 209 35.6 40.7 0.9445
PT (sec) 367 22.6 26.6 0.9740
PT (%) 367 49.4 46.0 0.9848
PT (international normalized ratio) 367 2.1 2.3 0.9730
Fibrinogen (mg/dL) 95 350.1 379.0 0.9890
D-dimer (mg/mL) 169 3.1 3.8 0.9953
Values are presented as mean.
Abbreviation: PT, prothrombin time.
*Correlation coefficient.
120.00
100.00
80.00
60.00
40.00
20.00
80.00
A
CP2000
CA-7000 0.00
0.00 10.00 20.00 30.00 40.00 50.00 60.00 70.00 y=1.3539x 3.9831
=0.9487 r2
160.00
100.00 80.00
60.00 40.00
20.00
140.00
B
CP2000
CA-7000 0.00
0.00 20.00 40.00 60.00 80.00 100.00 120.00 y=1.0937x 7.999
=0.9718 r2
12.00
10.00
8.00
6.00
4.00
2.00
7.00
C
CP2000
CA-7000 0.00
0.00 1.00 2.00 3.00 4.00 5.00 6.00 y=1.3342x 0.4493
=0.9468 r2 140.00
120.00
140.00
100.00
80.00
60.00
40.00
20.00
160.00
D
CP2000
CA-7000 0.00
0.00 20.00 40.00 60.00 80.00 100.00 120.00 140.00 y=0.8298x+11.09
=0.8921 r2
900.00 800.00 700.00 600.00 500.00 400.00 300.00 200.00 100.00
800.00
E
CP2000
CA-7000 0.00
0.00 100.00 200.00 300.00 400.00 500.00 600.00 700.00 y=1. x
=0.9718 1167 11.936 r2
45.00 40.00 35.00 30.00 25.00 20.00 15.00 10.00 5.00
20.00
F
CP2000(DDU)
CA-7000 (DDU)
"FEUx0.5=DDU"
0.00
0.00 5.00 10.00 15.00
y=2.2446x+0.3437
=0.9906 r2 120.00
Fig. 1. Correlation of the test results between CA-7000 (Sysmex Co., Tokyo, Japan) and CP2000 (Sekisui Medical Co., Tokyo,
Japan) for five coagulation test items. (A) Correlation PT (sec); (B) Correlation PT (%); (C) Correlation PT (international
normalized ratio); (D) Correlation activated partial thromboplastin time (sec); (E) Correlation fibrinogen; and (F) Correlation
D-dimer. Abbreviations: CP2000, Coapresta 2000; PT, prothrombin time; DDU, D-dimer units; FEU, fibrinogen-equivalent units.
calculated INR, which uses direct PT/INR line, and the routine INR, which utilizes ISI, was acceptable (data not shown).
DISCUSSION
Various devices and reagents for blood coagulation tests are used in laboratories. However, blood coagulation tests are highly influenced by analytical instruments and the reagents used. Therefore, when introducing a new blood coagulation system into a laboratory, an evaluation of not only the correlation with existing devices, but also of its function, effectiveness, simplicity, and speed should be conducted [7,8]. Since CP2000 has a fast and easytoop
erate coagulation test system, its use for routine analysis was evaluated.
The intra and interassay precisions of the four routine coagulation test items showed significantly low CV values (below 3%), whereas the proposed allowable CV value was <5% in the CLSI guideline [4]. A good correlation with the existing CA7000 system was observed, and this result is similar with those of other reports [1,2]. The precision of aPTT can be lower because of more complex testing procedures and different sensitivities to different reagents and testing methods, compared to PT results, as reported by the authors [9]. Thus, the lowest correlation coefficient ( r=0.9445) was obtained. However, the results using CP2000 showed a bias over those of CA7000 (PT, 14.716%; INR value, 7.605%; aPTT, 17.784%), and this result is similar to those of other reports [2]. The sus
tained onboard stability of the CP2000 reagents, even in the openvial state, could be an important advantage for practical procedures.
INR values are used to monitor patients who are on warfarin therapy. Thus, an accurate report of the INR value that minimizes the variation effect between different laboratories (by instruments and reagents) is necessary for the exact drug dosage arrangement. INR results are mathematically converted based on the instrumentspe
cific reagent combination, using proposed ISI values from the manufacturer. However, in spite of the fact that INR theoretically eliminates the bias of particular instrument/
Table 3. Onboard stability in open-vial state in CP2000 TestInsert period (day)
Coagpia control lowCoagpia control highPooled plasma lowPooled plasma high MeanSDCV (%)MeanSDCV (%)MeanSDCV (%)MeanSDCV (%) Activated partial thromboplastin time (sec)2828.800.230.8058.901.472.4930.300.391.2755.801.933.46 PT (sec)812.400.060.5220.700.100.5011.700.110.9729.300.471.61 PT (%)889.901.711.9031.200.210.66115.405.234.5320.300.391.93 PT (international normalized ratio)81.000.000.261.800.010.521.000.010.782.500.041.67 Fibrinogen (mg/dL)989.803.754.17269.304.911.82291.409.593.29507.6011.302.23 Fibrin degradation product (ug/mL)2811.200.171.5432.700.792.411.800.091.929.800.191.70 D-dimer (mg/mL)283.740.071.9812.700.221.720.550.012.403.730.133.39 Abbreviations: SD, standard deviation; CV, coefficient of variation; PT, prothrombin time.
reagent combinations, the values still vary [6]. Thus, INR should be verified using calibrated plasmas. Commercially available plasmas with a range of certified INR values can be used to verify local ISI, and if the difference is greater than 15%, ISI should be recalculated for more accurate INR data. Recently, a simple and direct PT/INR method was discovered that is different from the previously used local calibration method, which was more labor intensive and impractical in routine analysis. Moreover, it can be used by laboratory workers with ease and does not re
quire instrumentspecific ISI or MNPT [6,10,11]. The di
rect PT/INR line method acquired almost identical results to conventional calibration in a multicenter analysis [12].
Acceptable differences were all obtained through one nor
mal and three abnormal levels of certified INR values us
ing CP2000 and an instrumentspecific reagent. Although
further ISI calibration was not necessary, the results could also be verified with calibrated values using the direct PT/
INR line by linear regression. Locally calibrated INR val
ues can simply be obtained using the website spreadsheet of the direct PT/INR line [11].
In conclusion, the highthroughput CP 2000 analyzer is a userfriendly system with sustained onboard reagent stability. This analyzer correlated well with CA7000 for the analysis of routine coagulation test parameters. This instrument is expected to be used successfully in routine coagulation analysis.
ACKNOWLEDGEMENTS
The authors deeply thank Kyung Il Medical Inc. and Sekisui Medical Co., LTD. for the kind gift of KL6relat
ed materials, and also thank the anonymous reviewers whose comments enhanced this manuscript.
REFERENCES
1. Choi J, Song S, Park Y, Choi JR, Song J. Evaluation of an automated coagulation analyzer Coapresta 2000. Lab Med Online 2011;1:94-9.
2. Park YC, Lim J, Ko YH, Kim JM, Koo SH, Kwon KC. Per- formance evaluation of the automated coagulation ana- lyzer Coapresta 2000. J Lab Med Qual Assur 2013;35:8- 12.
3. Tholen DW, Kallner A, Kennedy JW, Krouwer JS, Meier K.
Evaluation of precision performance of quantitative mea- surement methods: approved guideline: EP5-A2. 2nd ed.
Wayne (PA): Clinical and Laboratory Standards Institute, 2004.
Table 4. Local verification of ISI using calibrated plasmas
Calibrant level Manufacture INR Evaluation INR (mean) Bias% Verification
Level 1 0.94 1.00, 0.99, 1.00 (1.00) 6 ±15% ≥ pass
Level 2 2.20 1.99, 1.99, 1.99 (1.99) –10 ±15% ≥ pass
Level 3 3.14 3.03, 3.06, 3.03 (3.04) –3 ±15% ≥ pass
Level 4 3.78 4.39, 4.35, 4.27 (4.34) 15 ±15% ≥ pass
Assigned value of local ISI, 1.04; mean normal prothrombin time, 12.2 seconds. Every triplicate and mean value of evaluated INR are expressed.
Abbreviations: ISI, international sensitivity index; INR, international normalized ratio.
0.00 0.50 1.00
4.10
3.10
1.50
LnPT
Ln INR 2.10
Direct PT/INR line
y=0.9674x+2.5108
=0.9723 r2
Calibrated ISI: 1.03 MNPT: 12.30 sec
3.57 3.91
3.16 3.16
Fig. 2. Direct PT/INR line derived from local PT results and certified INR values using linear regression. Abbreviations:
PT, prothrombin time; INR, international normalized ratio;
ISI, international sensitivity index; MNPT, mean normal
prothrombin time.
4. Marlar RA, Cook J, Johnston M, Kitchen S, Machin SJ, Shafer D, et al. One-stage prothrombin time (PT) test and activated partial thromboplastin time (aPTT) test: ap- proved guideline: H47-A2. 2nd ed. Wayne (PA): Clinical and Laboratory Standards Institute, 2008.
5. Van den Besselaar AM, Barrowcliffe TW, Houbouyan- Reveillard LL, Jespersen J, Johnston M, Poller L, et al.
Guidelines on preparation, certification, and use of certi- fied plasmas for ISI calibration and INR determination. J Thromb Haemost 2004;2:1946-53.
6. Poller L, Ibrahim S, Keown M, Pattison A, Jespersen J.
Simplified method for international normalized ratio (INR) derivation based on the prothrombin time/INR line: an international study. Clin Chem 2010;56:1608-17.
7. Appert-Flory A, Fischer F, Jambou D, Toulon P. Evalua- tion and performance characteristics of the automated co- agulation analyzer ACL TOP. Thromb Res 2007;120:733- 43.
8. Lee YW, Chang CW, Lim MS, Lim BJ, Lee YK. Laborato-
ry evaluation of automated coagulation analyzers Sysmex CA-1500 (TM) and CA-7000 (TM). J Clin Pathol Qual Control 2001;23:253-8.
9. Ross JW, Fraser MD, Moore TD. Analytic clinical labora- tory precision: state of the art for thirty-one analysis. Am J Clin Pathol 1980;74(4 Suppl):521-30.
10. Marlar RA, Gausman JN. Do you report an accurate in- ternational normalized ratio?: find out using local verifi- cation and calibration. Lab Med 2011;42:176-81.
11. Poller L, Ibrahim S, Pattison A, Jespersen J; European Ac- tion on Anticoagulation. INR derivation with the PT/INR Line simplified using a spreadsheet from the world wide web. J Clin Pathol 2011;64:930-2.
12. Poller L, Ibrahim S, Jespersen J, Pattison A. Coagulom-
eter international sensitivity index (ISI) derivation, a
rapid method using the prothrombin time/international
normalized ratio (PT/INR) line: a multicenter study. J
Thromb Haemost 2012;10:1379-84.
Coapresta 2000을 이용한 성능 평가 및 자체 International Sensitivity Index 검증
함지연 • 서장수
경북대학교 의과대학 임상병리학교실
배경: 높은 검체 처리량의 Coapresta 2000 (CP 2000; Seikisui, Japan) 시스템은 광-광학 응고 탐 지장치가 장착된 완전 자동 랜덤액세스 다중응고분석기이다. 이 시스템은 비색 분석 및 응고시간 분석을 수행할 수 있다. 본 연구에서 저자들은 몇 가지 응고검사결과에 대한 CP 2000의 분석성능 을 평가하고 현재 병원의 일상적인 응고검사에 사용되고 있는 CA-7000 (Sysmex, Japan) 시스템 의 성능과 비교하였다. 또한 보다 정확한 international normalized ratio (INR) 결과보고를 위해 인증 된 혈장을 사용하여 local international sensitivity index (ISI) 검증을 수행하였다.
방법: Prothrombin time (PT), activated partial thromboplastin time, fibrinogen과 D-dimer 4가지 일상 적인 응고검사와 관련하여 신선하거나 동결된 환자 혈장 검체로 CA-7000와 성능을 비교 평가하 였다. 다른 시약에 비해 안정성이 길다고 알려진 액체 시약의 검사장비 내 안정성도 확인하였다. 로 컬 ISI 검증은 4단계의 AK-Calibrant (Technoclone, Austria)로 수행하였으며, 기존 ISI를 사용한 계산 INR 값과 직접 PT/INR 직선을 이용한 값과 비교하였다.
결과: 분석범위 내 및 분석 간 변동계수는 정상 및 병적 범위 모두에서 모든 검사에 대해 5% 미만 의 좋은 정밀도를 보였다. CP 2000을 사용하여 얻은 결과는 CA-7000에서 얻은 결과와 좋은 상관 관계(0.95를 초과하는 r
2)를 보였다. 장비 내 개봉된 상태에서의 평가된 시약 안정성도 제조사에서 제공한 긴 기간 동안 잘 유지되는 것으로 확인되었다. ISI의 local 검증에서의 인증 혈장과 차이는 허 용 가능한 바이어스 범위(15 % 미만)로 나타났다.
결론: CP 2000 자동응고분석기는 좋은 시약 안정성과 용이성을 갖춘 시스템으로, 평가된 응고검 사결과는 기존 사용하고 있는 CA-7000와 높은 상관관계를 보여 통상적인 응고검사에 충분히 유 용하게 사용될 것으로 생각된다.
(J Lab Med Qual Assur 2018;40:38-45)
교신저자: 서장수
우)41944 대구시 중구 국채보상로 680, 경북대학교 의과대학 임상병리학교실 Tel: 053)200-5293, Fax: 053)200-3367, E-mail: [email protected]