- 116 -
KISEP Original Articles J Rhinol 4((((2)))), 1997
Acoustic Rhinometry in Nasal Provocation Test*
Tae-Young Jang, M.D., Yeong-Seok Yun, M.D., Dong-Hak Jung, M.D., Byung-Hun Kim, M.D., Young-Jin Kim, M.D. and Weon-Suk Choi, M.D.
ABSTRACT
A nasal provocation test is the most reliable diagnostic test to confirm allergen in allergic rhinitis. However, there are neither specific objective methods nor a standardized method and interpretation. In 20 normal subjects and 86 allergic rhinitis patients, we applied acoustic rhinometry as a new objective method to assess changes in nasal patency induced by nasal allergen chal- lenge, a procedure which is used for confirming allergic rhinitis. The result shows that a minimal cross-sectional area (MCA) and volume from the nose tip on back to 7 cm (nasal cavity volume) after allergen challenge were significantly decreased in allergic rhinitis patients in comparison with the control subjects. We conclude that acoustic rhinometry can provide a sensitive index for evaluating the results of a nasal provocation test.
KEY WORDS:Acoustic rhinometry·Allergen·Nasal provocation.
INTRODUCTION
While a nasal provocation test is a very important method in confirming allergen in allergic rhinitis, neither the method itself nor the interpretation has been standardized yet, and it is very difficult to make an objective judgment especially when relying only on symptoms. Until now, rhinomanometry1)2)3) has mainly been being used as an objective method to assess nasal resistance after a nasal provocation test, but application of acoustic rhinometry (AR) in the assessment of nasal pro- vocation tests has never been reported in Korea, although we can find a number of foreign reports documenting it.3-6) The authors have done an allergen challenge test using the antigen of Dermatophagoides pteronyssinus, and assessed the minimal cross-sectional area (MCA) in the nasal cavity and the change in volume, and compared results with those of a normal cont- rol group, applying AR to examine if this could be used as an objective method in assessment of the outcome of allergen provocation tests.
MATERIALS AND METHODS
For the control group we used 20 normal people (9 males, 11 females, age range:18-37 years) who had neither a past history of nasal disease nor abnormal nasal symptoms and tu- rned out to be normal in physical examinations including ant- erior rhinoscopy.
We first conducted a nasal provocation test on 115 patients with allergic rhinitis who were admitted to our hospital bet- ween August 1996 and February 1997 and who marked over grade 3 by star score, showing symptoms of more than two major symptoms of allergic rhinitis. Star score was calculated by grade of skin test scored between 0-4 and that of RAST between 0-6. According to this score we classified all the allergic rhinitis patients into two groups, weakly positive group from 3 to 6 and strong positive group from 7 to 10 excluding those whose sums were less than 2 from the study as we judged them of little significance.
We excluded the 29 patients, who showed nonspecific na- sal hyperreactivity by noticing macrographical change greater than one third of the baseline value on the AR graph after no- rmal saline spray. Those 86 patients (50 males, 36 females, age range:17-49 years), who didn’t show any above mentioned nonspecific hyperreactivity were used in this study.
From the two groups, those who had severe nasal septal de- viation;past history of surgery in the nasal cavity;chronic sinusitis or nasal polyp;systemic disease such as hypertension, diabetes mellitus and others;any nasal diseases other than allergic rhinitis;and those who had medications history within 1 month before the test were all excluded from the study.4)
*This study was conducted with Inha University’s internal res- earch support program.Department of Otorhinolaryngology- Head and Neck Surgery, Inha University College of Medicine, Inchon, Korea
Address correspondence and reprint requests to Tae-Young Jang, M.D., Department of Otorhinolaryngology-Head and Neck Su- rgery, Inha University College of Medicine, 72 Shinheung-dong, Jung-Gu, Inchon 400-103, Korea
Tel:82-32-890-2420, 2433, Fax:82-32-890-2430 Accepted for publication on November 20, 1997
Jang et al:Acoustic Rhinometry in Nasal Provocation Test / 117
We used E. Benson Hood Laboratories’ ECCOVISION Ac- oustic rhinometer as measuring equipment. This equipment co- nsists of an IBM-486 personal computer, a wave tube (interior diameter:1.5 cm, length:30 cm), a calibration tube, nose tips, and a HP 550C color printer.
The room temperature was set at 22℃ (±2℃) and the relative humidity at 50% (±5%). We inserted a nose tip-with a size identical to that of the anterior nares-being careful that the shape of nostril should not be changed as the patient was encouraged to relax and breath gently after being seated on a chair for 15 minutes. Using acoustic rhinometry, normal value was checked for baseline data. Then the value after normal saline spray was checked again. After the antigen spray, the changes were recorded at 5 and 15 minutes respectively (Fig.
1);from the data acquired, we gathered statistics on MCA and the nasal volume up to 7 cm using a t-test. We also questioned the patients about the change in symptoms they felt in each examination and recorded it based on a visual analogue scale (VAS). The allergen used was Allergopharma’s Dermatoph- agoides pteronyssinus (DP) antigen, contained in a 5 ml‘pu- mp dosaging sprayer’where antigen and normal saline were diluted at 1:10;the amount to be sprayed at one time was 40-50 μl. Before spraying both the normal saline and alle- rgen, we brought them to normal body temperature to mini- mize deflection by temperature each time we sprayed twice into the right nasal cavity. The symptoms were divided into 4 categories, nasal obstruction, rhinorrhea, sneezing and itching, and regarded cases without any symptoms as 0 and the ones with the most serious symptoms as 10. In this study, the auth- ors designated the symptom change as positive when the pat- ient sneezed at least more than twice within 15 minutes after the antigen was sprayed in; or when at least more than two symptoms besides sneezing changed on the VAS;or either nasal obstruction, rhinorrhea or itching changed more than 2 on the VAS.
In AR we compared the value of the MCA and the nasal cavity volume up to 7 cm level after allergen provocation with those of baseline. We also studied the relationship between changes in AR and other factors such as symptomatic changes and star score.
MCA and the changes in nasal cavity volume in the control group and allergic rhinitis group were verified by a paired t-test.
The relationship between symptom changes and the star sc- ores was verified by Chi-square test.
RESULTS
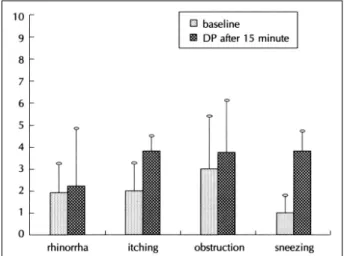
After the nasal provocation test on the 86 patients in the allergic rhinitis group, we had positive reactions from 35 pa- tients for rhinorrhea, 27 for itching, 21 for nasal obstruction and 20 for sneezing, with 54 of these cases satisfying the au- thors’ criteria for designating the symptom changes as positive.
The symptom changes appeared on VAS (baseline symptom/
symptom 15 minutes after spraying allergen) as follows:1.85
±1.12/2.5±2.29 for rhinorrhea;1.93±1.33/3.69±1.33 for itching;3.04±2.52/3.63±2.59 for nasal obstruction;and 0.97±0.13 / 3.69±1.38 for sneezing (Fig. 2).
Those cases that came out as weakly positive group on the star score totaled 37 out of 86 total cases (43%) and the str- ong positive group totaled 49 cases (57%). Out of these cases, the ones that showed symptom changes after nasal provocat- ion test were 12 cases (32%) in weakly positive group and 42 cases (85.7%) in strong positive group respectively, for a gr- and total of 62.8% of all 86 cases. Here the symptom changes after the provocation tests in the strong positive group turned out to display more statistically significant deviation than the ones in weakly positive group (Chi-square test, p<0.05)(Ta- ble 1).
Table 1. Symptom changes according to star score(N=86) Star score
Weak positive Strong positive Total Symptom change (+) 12 ( 32.0%) 42 ( 85.7%) 54 ( 62.8%) Symptom change (-) 25 ( 68.0%) 7 ( 14.3%) 32 ( 37.2%) Total 37 (100.0%) 49 (100.0%) 86 (100.0%) Chi-square test;p<0.05
Fig. 1. The protocol for the challenge.
AR;Acoustic rhinometry, DP;D. pteronyssinus
Fig. 2. Symptom change according to visual analogue scale.
DP;D. pteronyssinus
118 / J Rhinol 4(2), 1997
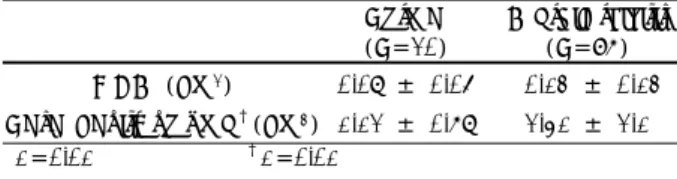
Before and after the antigen spray, there were no statistica- lly significant changes in control group (Table 2).
Allergic rhinitis group showed statistically significant cha- nges of the MCA and nasal cavity volume after antigen spray in 15 minutes (Table 3).
The changes of MCA and nasal cavity volume after antigen spray in the allergic rhinitis group were statistically different from those in the control group (Table 4).
In weakly positive group, nasal cavity volume changed si- gnificantly but MCA did not. In strong positive group, both MCA and nasal cavity volume were significantly decreased as compared with control group (Table 5).
In symptom change group, both MCA and nasal cavity vo- lume were significantly decreased. In no symptom change gr- oup, however, MCA and nasal cavity volume did not changed as compared with those of control group (Table 6).
DISCUSSION
A nasal provocation test is a method that assesses the hyp- ersensitivity of nasal mucosa and is being used in confirming allergic rhinitis and in judging the success of immunotherapy.
However, it can be problematic in that relatively, it takes much time;it involves risk of an anaphylactic reaction;it can re- sult in a false positive or false negative reaction;and there is not an objective method for judgment of it yet. With regard to nasal provocation tests, Kirkman first reported in 1835 that hay fever was expressed after applying grass pollen directly in the nasal cavity,8) and after this, various methods have been being tried by many physicians, i.e. spray of antigen in nasal cavity8)9);installation of antigen in nasal cavity10);inhalation of dry pollen11-13);inhalation of lyophilized powder14);ap- plication of cotton pledget coated by allergen11)12);placing a disk coated with allergen in nasal mucosa2);direct injection of allergen on nasal mucosa15) and so on. A method, however, has not been standardized. We chose the method of spraying antigen in the nasal cavity, which is also problematic in that the amount of allergen sprayed is irregular and that it carries a higher possibility of causing an anaphylaxis in the lower ai- rway than instillation in the nasal cavity;it does, however, have an advantage in that it can be used even without special technique.
Interpretation after a nasal provocation test is largely divi- ded into subjective method and an objective method. The su- bjective method assesses the symptoms the patient complains of (eg. rhinorrhea, postnasal drip, itching, sneezing, and nasal obstruction) using a visual analogue scale, and it is difficult to solely use this method in assessment of a nasal provocation test as it lacks objectivity. Of objective methods, rhinoman- ometry assesses the changes of nasal resistance before and after the test. However, it has defects such as low positive rate, poor representation, and requirement of special equipment and cooperation of the patient1)2) and the test is time-consuming.
Another is to observe edema on nasal mucosa and rhinorrhea using rhinoscopy.13)16) While this method has advantages in that it has a high positive rate, doesn’t require special equip- ment, the test takes short time, and it can be done without the patient’s cooperation, it has defects in that it requires an ex- perienced tester and it lacks objectivity. A third method is carbon powder elimination test which could compensate for the defects of rhinoscopy. It however has its own defect in that it may take more or less long in testing.2) In addition to these methods measuring nasal resistance using body plethysmogr- aphy.17) comparing nasal eosinophilia before and after the test,18)
Table 2. Minimal cross-sectional area (MCA) and volume in no- rmal control group (N=20)
() Baseline DP after Average of
15 minute change MCA (cm2) 0.71±0.16 0.64±0.16 0.07±0.05 Nasal cavity volume (cm3) 11.3 ±2.27 10.18±2.33 1.12±0.67 Volume;p>0.05 MCA;p>0.05
Table 3. Minimal cross-sectional area (MCA) and volume in allergic rhinitis patients (N=86)
Baseline DP after
15 minute
Average of change MCA (cm2) 0.57±0.23 0.44±0.21* 0.13±0.13 Nasal cavity volume (cm3) 9.73±3.39 7.32±3.08† 2.41±2.1
*p=0.0001 †p=0.0001
Table 4. Change of minimal cross-sectional area (MCA) and volume in normal control group and allergic rhinitis patients
Normal (N=20)
Allergic rhinitis (N=86) MCA* (cm2) 0.07 ± 0.05 0.13 ± 0.13 Nasal cavity volume†(cm3) 1.12 ± 0.67 2.41 ± 2.1
*p=0.01 †p=0.01
Table 5. Change of minimal cross-sectional area (MCA) and volume in relation to star score in allergic rhinitis patients
Control group (N=20)
Weakly positive (N=37)
Strong positive (N=49) MCA* (cm2) 0.07±0.05 0.13±0.08 0.18±0.13 Nasal cavity volume†(cm3) 1.12±0.67 2.02±1.99 2.71±2.14 As compared with normal control group
Weakly positive:* (p>0.05), †(p=0.0458) Strong positive:*, †(p=0.0001)
Table 6. Change of minimal cross-sectional area (MCA) and volume in relation to symptom change in allergic rhinitis
Control group (N=20)
No symptom change group
(N=32)
Symptom change group
(N=54) MCA* (cm2) 0.07±0.05 0.07±0.06 0.17±0.12 Nasal cavity volume†(cm3) 1.12±0.67 1.44±0.88 2.99±2.11 As compared with normal control group
Symptom change group:*, †(p=0.0001) No symptom change group:*, †(p>0.05)
Jang et al:Acoustic Rhinometry in Nasal Provocation Test / 119
and a few others have been introduced, but there is not yet a standardized method that is useful in assessment which is simple and accurate. Recently introduced evaluation by aco- ustic rhinometry has advantages in that it is simple to perform;
the assessment can be carried out with minimal equipment, even without special technique;it takes a short time and is noninvasive and accurate;the reproducibility is high;it re- quires less cooperation from the patient;it can assess nasal obstruction objectively and quantitatively;it can be applied even when the nasal cavity is completely obstructed and has no air flow;it can be used for the assessment of both the mu- cosal factor that causes nasal obstruction and nasal septal de- viation, as well as the assessment of structural factors such as stenosis in nasal cavity, nasal polyp or intranasal tumor, and so on.7)9)20) Accordingly, many attempts to apply this method to assess results of nasal provocation tests are being reported in a number of documents.3-6)
Analysis of the results produced by the authors showed that the changes of both MCA and nasal cavity volume in the allergic rhinitis group showed statistically significant decrea- ses after nasal provocation tests and from this, we suppose that evaluation by acoustic rhinometry can be used in interpreting the results objectively. Particularly, considering that statisti- cally significant changes were found innasal cavity volume but not in MCA in the weakly positive group by star score compared to that in the control group, we conjecture that nasal cavity volume is more significant than MCA is in its interp- retation. In addition, the fact that, as compared with no sym- ptom change group, the results of symptom change group had more relationship with those of AR can be an evidence that AR along with symptom changes can be an objective method.
But this study is problematic in that nasal cycle was not co- nsidered, it could not assess how much change of MCA and nasal cavity volume should be regarded as positive and finally, it didn’t take delayed responses into regard;further study on this is still needed.
CONCLUSION
We conclude that acoustic rhinometry could be used as an objective method in interpretation of nasal provocation tests, and that it should be of more significance when interpreted along with symptom changes after nasal provocation tests.
REFERENCES
1) Fernandes FR, Sole D, Naspitz C, Mu&oz-Lopez F. Diagnostic va-
lue of nasal provocation testing and rhinometry in allergic rhinitis.
J Investig Allergol Clin Immunol 1996;6:184-8.
2) Okuda M. Basic study of nasal provocative test. First report: Side, site of the nose, size of site and alleren amount. Arch Otorhinolar- yngol 1977;214:241-6.
3) Scadding GK, Darby YC, Austin CE. Acoustic rhinometry comp- ared with anterior rhinom-anometry in the assessment of the resp- onse to nasal allergen challenge. Clin Otolaryngol 1994;19:451-4.
4) Hilberg O, Grymer LF, Pederson OF. Nasal histamine challenge in nonallergic and allergic subjects evaluated by acoustic rhinom- etry. Allergy 1995;50:166-73.
5) Nielsen LP, Bjerke T, Christensen MB, Pederson B, Rasmussen R, Dahl R. Assessment of the allergic reaction in seasonal rhinitis:
acoustic rhinometry is a sensitive and objective method. Clin Exp Allergy 1996;26:1268-75.
6) Tsai JJ, Ho CY, Wang SR. Relationship between nasal resistance and airway hyperreactivity following nasal provocation with Der- matophagoides pteronyssinus in allergic rhinitis. Int Arch Allergy Immunol 1995;106:286-90.
7) Min YG, Lee CH, Lee JW, Jang YJ, Choi YS, Jeong PS. Acoustic rhinometry in normal Korean adults. Korean J Otolaryngol 1994;
37:51-7.
8) Halpern SR, Holman J, Whittaker C. The correlation between skin and respiratory mucous membrane tests with molds in allergic rh- initis. Ann Allergy 1961;19:1407-14.
9) Feinberg SM, Stier RM, Grater WC. A suggested quantitave eval- uation of the degree of sensitivity of patients with ragweed pollin- osis. J Allergy 1952;23:387-94.
10) Nauman HH, Nauman WH, Schubert B. Zur Methodik des Schle- imhauttestes bei Nasenal-lergie. Z Laryng 1969;48:198-203.
11) Ashan G, Drettne B. Nasal obstruction at provocation experiment in patients with hay-fever. Acta Otolaryngol Supple 1958;140:91-100.
12) Grobler NJ, Orie NG, Devries K. Measurement of the reaction of the nasal mucosa in provocation tests. Allergie Asthma 1966;12:
24-31.
13) Harris LH. Experimental reproduction of respiratory mold allergy.
J Allergy 1940;12:279-89.
14) Hosen H. Provocative nasal tests for diagnosis of inhalant allergens.
Correlation with skin tests and clinical symptoms. Ann Allergy 1965;23:497-505.
15) Dean LW, Linton LD, Linton SS. Intramucosal test for hyperse- nsitivity in allergic rhinitis. Ann Otol Rhinol Laryngol 1935;44:
317-26.
16) Popa V, Al-George S. Nasal provocative test in allergic perennial rhinitis. A preliminary study. Ann Allergy 1969;27:45-53.
17) Haight JSJ, Cole P. The site and function of the nasal valve. Lar- yngoscope 1983;93:49-55.
18) Aas K . Nasal eosinophilia in so-called bacterial hypersensitivity in asthmatic children. Act a Pediatr Scand 1961;50:1-6.
19) Hilberg O, Jackson AC, Swift DL, Pederson OF. Acoustic rhino- metry: evaluation of nasal geometry by acoustic reflection. J Appl Physiol 1989;66:295-303.
20) Lenderers H, Pirsig W. Diagnostic value of acoustic rhinometry:
patients with allergic and vasomotor rhinitis compared with nor- mal controls. Rhinology 1990;28:5-16.