Introduction
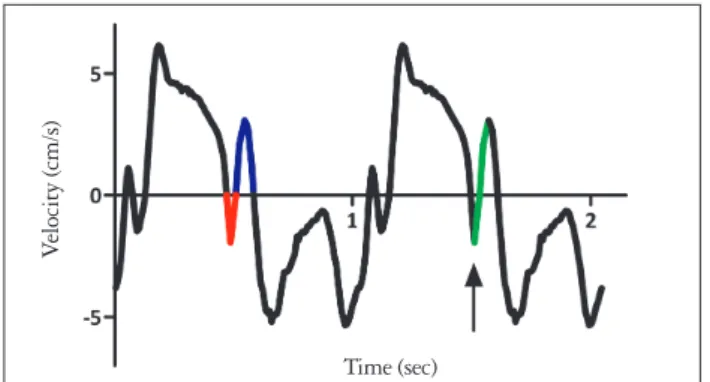
The tissue Doppler imaging (TDI) derived pattern of the left ventricular (LV) longitudinal motion is characterized by a distinct velocity pattern during the time interval between the end of the systolic velocity wave and the onset of the early dia- stolic velocity wave. Negative and positive velocity waves are commonly distinguished.1-3) The origin of these longitudinal myocardial velocities has not been fully resolved. We suggest considering the nadir of the negative velocity wave as being the onset of a notch leading to an interruption of the ongoing basally directed velocity of the myocardium. We have labeled this phenomenon as the post-systolic velocity notch (PSN) (Fig. 1). Remme et al.4) demonstrated that the presence of the aortic valve is necessary for a PSN to occur. Stenting of the
ORIGINAL ARTICLE J Cardiovasc Ultrasound 2014;22(1):23-27
The Tissue Doppler Imaging Derived Post- Systolic Velocity Notch Originates
at the Aortic Annulus
Alexandre J. Ouss, MD and Robert K. Riezebos, MD, PhD
Department of Cardiology, Onze Lieve Vrouwe Gasthuis Hospital, Amsterdam, the Netherlands
Background: A distinct velocity pattern represented by a “notch” is observed during the time interval between the end of the systolic and the onset of the early diastolic velocity wave on longitudinal myocardial velocity curve. The origin of the post-systolic velocity notch (PSN) has not been resolved.
Methods: The high frame rate color tissue Doppler imaging of the apical longitudinal axis was performed in 32 healthy subjects.
Results: The time delays of the PSN onset at the posterior aortic wall (AW), the mid anteroseptal wall (MAS) and the posterior mitral annulus (MA) relatively to the anterior aortic annulus (AA) were found to be significantly longer than zero (5.1 ± 2.2, 6.0 ± 2.3, 6.8 ± 2.8 ms; p < 0.001). The amplitude was the highest at the AA when compared to the AW, the MAS and the MA (4.77 ± 1.28 vs. 2.88 ± 1.11, 2.15 ± 0.73, 2.44 ± 1.17 cm/s; p < 0.001). A second PSN spike was identifiable in 10/32 (31%) of the studied subjects at the AA. Of these, 9 (28%) exhibited a second PSN spike at the AW, 3 (9%) at the MAS and no one at the MA.
Conclusion: The AA represents the site of the earliest onset and maximal amplitude of the PSN on the longitudinal velocity curve suggesting its mechanism to be that of an energy release at the instant of the aortic valve closure causing an apically directed acceleration of the myocardium. A substantial number of healthy subjects exhibit a second PSN spike predominantly at the level of the AA. Its mechanism remains to be elucidated.
KEY WORDS: Tissue Doppler echocardiography · Myocardial velocity · Aortic valve.
• Received: November 4, 2013 • Revised: February 5, 2014 • Accepted: February 18, 2014
• Address for Correspondence: Alexandre J. Ouss, Department of Cardiology, Onze Lieve Vrouwe Gasthuis Hospital, PO Box 95500, 1090 HM Amsterdam, the Netherlands Tel: +31-20-599-9111, Fax: +31-20-599-2367, E-mail: [email protected]
• This is an Open Access article distributed under the terms of the Creative Commons Attribution Non-Commercial License (http://creativecommons.org/licenses/by-nc/3.0) which permits unrestricted non-commercial use, distribution, and reproduction in any medium, provided the original work is properly cited.
Fig. 1. Schematic presentation of the post-systolic velocity notch (PSN). On the left the current designation of the post-systolic negative (red) and positive (blue) velocity waves. On the right the proposed view of the PSN (green). The arrow indicates the onset of the PSN.
Time (sec)
Velocity (cm/s)
aortic valve led to the disappearance of the PSN in an animal model. The downstroke of the velocity curve between the end of the systolic wave and the onset of the PSN represented the protodiastolic myocardial lengthening. However, the exact or- igin of the upstroke of the PSN, which frequently reaches pos- itive values, was not clarified.
For the current study, it was hypothesized that the energy released at the instant of the sudden cessation of the closing motion of the aortic valve is responsible for the upstroke of the PSN. In order to evaluate this assumption the timing of the onset, the amplitude and the duration of the PSN were mea- sured at different cardiac segments along the longitudinal axis in healthy subjects.
Methods Study subjects
Patients referred for a standard transthoracic echocardio- gram were included in the study if they met the following in- clusion criteria: no history of known cardiovascular disease, no
abnormalities on physical examination, electrocardiogram and echocardiogram.
Ultrasound acquisition
For the purpose of the study, color TDI images of the apical longitudinal axis of the left ventricle were obtained. The width of the echocardiographic window was adjusted to achieve a frame rate of at least 165 frames per second. Three consecutive cardiac cycles at the end of expiration were acquired. The echocardiographic equipment used was the VIVID 7 and S6 (GE Vingmed Ultrasound AS, Horten, Norway).
Off-line analysis
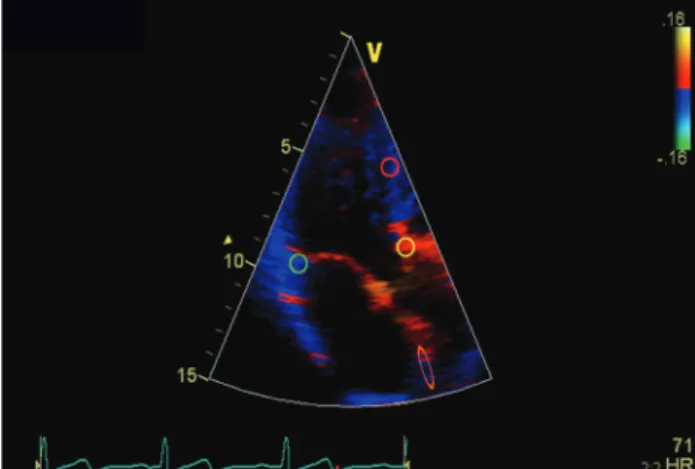
The off-line reconstructions of the TDI velocity curves us- ing the recorded raw data was performed with commercially available software (EchoPac, version 110.0.2, GE Vingmed Ultrasound AS, Horten, Norway). The standardized measure- ments were performed at the following levels: the anterior aor- tic annulus (AA), the posterior aortic wall (AW) below the si- no-tubular junction, the mid anteroseptal wall (MAS) and the posterior mitral annulus (MA) (Fig. 2). Temporal averaging (curve smoothing) of the measurement results was not applied.
The time delay of the PSN onset (Fig. 3) was assessed between the AA and the AW, the AA and the MAS, the AA and the MA. In addition, the following values were determined at each measurement level: the velocity at the onset of the PSN, the velocity at the peak of the PSN and the duration of the PSN (onset to peak). The amplitude of the PSN was calculat- ed (peak velocity minus onset velocity).
Statistics
Timing, velocity and duration data are presented as mean ± standard deviation. The one-sample t-test was used to test the hypothesis of the later onset of the PSN at the AW, the MAS, and the MA relatively to the AA. The onset timing, the veloc- ity and the duration were compared using the paired t-test. p
< 0.05 was considered statistically significant.
Results
Thirty two persons were included in the study. The mean age was 35 ± 10 years and 16 were male. The basic demographic and echocardiographic parameters are shown in Table 1. The mean frame rate of the color TDI acquisition was 170 ± 6 frames per second.
The PSN was present at the AA, the AW, the MAS, and the MA of all studied subjects (Fig. 4).
Timing of the onset
Compared to the AA, the time delays of the PSN onset at the AW, the MAS, and the MA were found to be significantly longer than zero (5.1 ± 2.2 ms, 6.0 ± 2.3 ms, 6.8 ± 2.8 ms; p <
0.001). This implies that the PSN onset occurs at the level of the AA before the PSN onset at any other measurement level.
Fig. 2. The measurement levels. yellow: anterior aortic annulus, orange:
posterior aortic wall, red: mid anteroseptal wall, green: posterior mitral annulus.
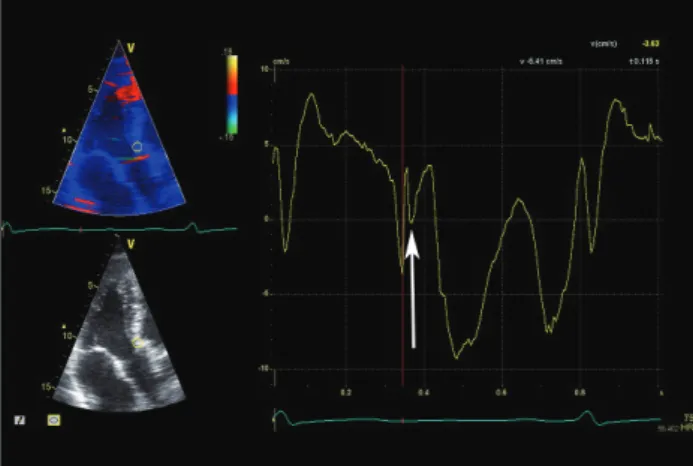
Fig. 3. The time delay of the post-systolic velocity notch (PSN) onset between the anterior aortic annulus (AA) and the posterior mitral annulus (MA). Vertical yellow dotted line represents the PSN onset at the AA, vertical blue dotted line represents the PSN onset at the MA.
The onset of the PSN at the level of the MA occurred signifi- cantly later than at the level of the AW (p < 0.005).
Amplitude and duration
The amplitude of the PSN was the highest at the level of the AA compared with the AW, the MAS, and the MA. There was no significant difference in the duration of the PSN be- tween the measurement levels (Table 2).
The onset and the peak velocities
The onset velocities of the PSN were significantly more nega- tive (p < 0.001) and the peak velocities significantly higher (p <
0.001) at the AA than at all other measurement levels (Table 2).
The onset of the PSN had a negative velocity in all the sub- jects at all measurement levels. The peak of the PSN showed a positive value in 90.6% of the subjects at the level of the AA.
At the other studied levels it reached the positive values less frequently (AW 68.8%, MAS 56.3%, MA 59.4%).
Additional findings
In 10 of 32 (31%) studied subjects, the second PSN spike was identifiable at the AA level (Fig. 5). Of these, 9 (28%) ex- hibited a second PSN spike at the AW, 3 (9%) at the MAS and no one at the MA.
Discussion
A distinct PSN pattern could be distinguished in the TDI derived curves of all studied subjects. It was demonstrated that the PSN is the earliest and the largest at the level of the AA when compared to other sites along the apical longitudi- nal axis. We suggest that the sudden cessation of the closing motion of the aortic valve at the onset of the PSN is associated with release of kinetic energy responsible for the abrupt change of direction of the myocardial acceleration, leading to an up- stroke of the velocity curve. Our findings form a circumstantial though significant plea to allocate the moment of the aortic valve closure to the PSN onset at the level of the AA. According to our hypothesis the resulting PSN wave propagates as well in proximal (compression wave) as in distal (rarefaction wave) direction. The decrease of the amplitude of the PSN at the re- mote segments relative to the AA fits this hypothesis. The significantly longer delay of the PSN onset at the MA as com-
pared with the AW is, probably, explained by the longer dis- tance for the PSN wave to travel from its origin and different velocities of the PSN wave while travelling through myocar- dium versus AW. Our findings seem to further develop the hypothesis of Remme et al.4) strongly suggesting that the im- pact of the closing aortic valve and not merely the interrup- tion of the protodiastolic myocardial lengthening at the in- stant of the cessation of its closing motion accounts for the upstroke of the PSN. The existence of the pulsatile wave prop-
Table 1. Demographic and echocardiographic characteristics of the studied population
Characteristics Value (n = 32)
Male (%) 16 (50)
Age (yr) 35 ± 10
IVSd (mm) 7.9 ± 1.4
LVDd (mm) 47.7 ± 4.9
PWd (mm) 8.0 ± 1.0
LVEF (%) 59 ± 6
LAVI (mL/m2) 29.0 ± 3.7
E/E’ 5.4 ± 1.2
All values expressed as mean ± standard deviation. IVSd: end-diastolic interventricular septum thickness, LVDd: left ventricular end-diastolic diameter, PWd: end-diastolic posterior wall thickness, LVEF: left ventricular ejection fraction, LAVI: left atrium volume index, E/E’: ratio of early transmitral flow velocity to early myocardial diastolic velocity at the level of the lateral wall
Fig. 4. The post-systolic velocity notch at the level of the anterior aortic annulus.
Table 2. The velocity and duration characteristics of the PSN
Measurement level
AA AW MAS MA
Amplitude (cm/s) 4.77 ± 1.28* 2.88 ± 1.11† 2.15 ± 0.73 2.44 ± 1.17
Duration (ms) 11.1 ± 2.5 10.3 ± 2.6 11.1 ± 1.9 11.4 ± 2.7
Onset velocity (cm/s) -3.25 ± 1.09* -2.45 ± 0.77† -1.99 ± 0.91 -2.13 ± 0.87
Peak velocity (cm/s) 1.52 ± 1.25* 0.43 ± 0.87 0.16 ± 0.80 0.31 ± 1.2
*p < 0.001 vs. AW, MAS, MA, †p < 0.01 vs. MAS. PSN: post-systolic velocity notch, AA: anterior aortic annulus, AW: posterior aortic wall, MAS: mid anteroseptal wall, MA: posterior mitral annulus
agating from the base of interventricular septum to the apex was previously shown by a phased tracking method.5) The wave starts with a steep pulse near the base of interventricular septum just at the instant of the closure of the aortic valve and propagates with a speed about 5–6 m/s. The rough approxi- mation of the propagation velocity in our study yields the comparable value (3 cm in 6 ms = 5 m/s).
In the case of a sufficiently strong impact, the upstroke of the PSN can reach positive values, called a post-systolic mo- tion.6-12) We propose this simple mechanism to explain the bi- phasic configuration of the post-ejection velocity spike. Previ- ous research had suggested it to be a resultant of different phenomena such as: asynchronous contraction and ventricular interdependence,13) asynchronous deformation of subendocar- dial and subepicardial LV wall layers14) and tug-of-war be- tween weak and strong segments during the isovolumic relax- ation phase.15) The prevalence of the positive PSN velocities found in the current study is somewhat higher than previous- ly reported,3) probable because no temporal averaging of the
measurement results was applied. The centrifugal propagation of the positive PSN velocity front is illustrated by a frame-by- frame analysis of a color TDI sample (Fig. 6).
To the best of our knowledge the present study describes for the first time the existence of two PSN spikes with apically directed acceleration. This was possible due to use of the high frame rate and non-smoothed measurement results. While the origin of the first PSN spike is as discussed above, probably, the closure of the aortic valve, the genesis of the second PSN spike is less clear. We hypothesize that the sudden cessation of the aortic backflow at the instant of the aortic valve closure16) is a potential mechanism behind the second PSN spike. The transmission of the kinetic energy could be sufficient to cause an acceleration of adjacent structures in the direction of the left ventricle.17) The magnitude of the retrograde flow in the ascending aorta is known to vary significantly between the healthy subjects and constitutes 4–29% of the antegrade aor- tic flow. At an average of 600–700 mL/min retrograde flow the coronary circulation takes 200–300 mL/min, the remain- der turns around in the sinuses of Valsalva.18) The maximal ve- locity of the retrograde flow in the ascending aorta is in the range of 8–40 cm/s in healthy subjects.19) These differences in velocity and volume of the retrograde aortic flow are likely to cause a wide spectrum of velocity and duration of the second PSN spike. Further studies are needed to elucidate its nature and clinical significance.
Limitations
The apical longitudinal axis view is hampered by subopti- mal alignment of the Doppler interrogation with longitudinal motion of the ascending aorta which varies with the magni- tude of the aorto-septal angle. However, it is unlikely that possible malalignment influenced the timing intervals mea- sured in this study.
Potential study implications
The issue of the timing of the aortic valve closure relatively to the LV longitudinal velocity tracing seems not definitely to be resolved due the limitations of the reference methods used for the timing of the aortic valve closure.20) Different points on the velocity curve have been suggested to coincide with the instant of the aortic valve closure: the time point of zero velocity at the end of the systolic wave,21)22) the time point of peak positive acceleration during isovolumic relaxation peri- od,4)23) the time point of zero velocity at the end of the nega- tive spike after the systolic wave.20)24) Based on our results the PSN onset at the level of the AA can be used as a marker of end-systole on the TDI tracings when using the apical longi- tudinal axis view. The PSN onset at the level of any segment in the standard four- and two-chamber view is expected to be delayed relatively to the instant of the aortic valve closure and represent the arrival of the PSN velocity front to the studying segment.
Fig. 5. The second post-systolic velocity notch (PSN) spike at the level of the anterior aortic annulus. The arrow indicates the onset of the second PSN spike.
Fig. 6. The typical sequence of the centrifugal distribution of the apically directed velocity of the myocardium (red-colored area) following the aortic valve closure. Four consecutive images are shown. Panel A corresponds to the post-systolic velocity notch onset at the anterior aortic annulus. Color tissue Doppler frame rate is 166/sec.
A
C
B
D
Conclusion
The concept of the PSN was presented. This distinct velocity pattern interrupts the longitudinal basally directed LV motion during the ongoing protodiastolic relaxation. The relative tim- ing and amplitude reveal its origin to be at the level of the AA.
A second PSN spike is present in a substantial amount of healthy subjects predominantly at the AA level. We suggest the first and the second PSN spike to be caused, respectively, by the myocardial propagation of kinetic energy of the closing aortic valve and retrograde aortic flow which is interrupted at the instant of the aortic valve closure.
• Acknowledgements
We thank Lea Dijksman for her statistical support.
References
1. Isaaz K, Munoz del Romeral L, Lee E, Schiller NB. Quantitation of the motion of the cardiac base in normal subjects by Doppler echocardiogra- phy. J Am Soc Echocardiogr 1993;6:166-76.
2. Pai RG, Gill KS. Amplitudes, durations, and timings of apically directed left ventricular myocardial velocities: I. Their normal pattern and coupling to ventricular filling and ejection. J Am Soc Echocardiogr 1998;11:105-11.
3. Lind B, Nowak J, Cain P, Quintana M, Brodin LA. Left ventricular isovolumic velocity and duration variables calculated from colour-coded myo- cardial velocity images in normal individuals. Eur J Echocardiogr 2004;
5:284-93.
4. Remme EW, Lyseggen E, Helle-Valle T, Opdahl A, Pettersen E, Vartdal T, Ragnarsson A, Ljosland M, Ihlen H, Edvardsen T, Smis- eth OA. Mechanisms of preejection and postejection velocity spikes in left ventricular myocardium: interaction between wall deformation and valve events. Circulation 2008;118:373-80.
5. Kanai H, Koiwa Y. Myocardial rapid velocity distribution. Ultrasound Med Biol 2001;27:481-98.
6. Terkelsen CJ, Poulsen SH, Nørgaard BL, Lassen JF, Gerdes JC, Sloth E, Nielsen TT, Andersen HR, Egeblad H. Does postsystolic mo- tion or shortening predict recovery of myocardial function after primary per- cutanous coronary intervention? J Am Soc Echocardiogr 2007;20:505-11.
7. Citro R, Galderisi M. Myocardial postsystolic motion in ischemic and not ischemic myocardium: the clinical value of tissue Doppler. Echocardiography 2005;22:525-32.
8. Galderisi M, Cicala S, Sangiorgi G, Caso P, de Divitiis O. Tissue Dop- pler-derived postsystolic motion in a patient with left bundle branch block: a sign of myocardial wall asynchrony. Echocardiography 2002;19:79-81.
9. Fraser AG, Payne N, Mädler CF, Janerot-Sjøberg B, Lind B, Gro- cott-Mason RM, Ionescu AA, Florescu N, Wilkenshoff U, Lancel- lotti P, Wütte M, Brodin LA; MYDISE Investigators. Feasibility and reproducibility of off-line tissue Doppler measurement of regional myocardial function during dobutamine stress echocardiography. Eur J Echocardiogr 2003;4:43-53.
10. Ring M, Persson H, Mejhert M, Edner M. Post-systolic motion in pa-
tients with heart failure--a marker of left ventricular dyssynchrony? Eur J Echocardiogr 2007;8:352-9.
11. Badran HM, Elnoamany MF, Seteha M. Tissue velocity imaging with dobutamine stress echocardiography--a quantitative technique for identifica- tion of coronary artery disease in patients with left bundle branch block. J Am Soc Echocardiogr 2007;20:820-31.
12. Celutkiene J, Sutherland GR, Laucevicius A, Zakarkaite D, Rudys A, Grabauskiene V. Is post-systolic motion the optimal ultrasound param- eter to detect induced ischaemia during dobutamine stress echocardiography?
Eur Heart J 2004;25:932-42.
13. Garcia MJ, Rodriguez L, Ares M, Griffin BP, Klein AL, Stewart WJ, Thomas JD. Myocardial wall velocity assessment by pulsed Doppler tissue imaging: characteristic findings in normal subjects. Am Heart J 1996;132:648-56.
14. Sengupta PP, Khandheria BK, Korinek J, Wang J, Belohlavek M.
Biphasic tissue Doppler waveforms during isovolumic phases are associated with asynchronous deformation of subendocardial and subepicardial layers.
J Appl Physiol (1985) 2005;99:1104-11.
15. Remme EW, Lyseggen E, Helle-Valle T, Pettersen E, Ragnarsson A, Ihlen H, Edvardsen T, Smiseth OA, Opdahl A, Vartdal T, Ljosland M. Response to letter regarding article, “Mechanisms of preejection and poste- jection velocity spikes in left ventricular myocardium: interaction between wall deformation and valve events”. Circulation 2009;119:e205.
16. Van Steenhoven AA, Verlaan CW, Veenstra PC, Reneman RS. In vivo cinematographic analysis of behavior of the aortic valve. Am J Physiol 1981;240:H286-92.
17. Smith D, Craige E. Influence of the aortic component of the second heart sound on left ventricular maximal negative dP/dt in the dog. Am J Cardiol 1985;55:205-9.
18. Bogren HG, Buonocore MH. Blood flow measurements in the aorta and major arteries with MR velocity mapping. J Magn Reson Imaging 1994;4:
119-30.
19. Bogren HG, Buonocore MH. 4D magnetic resonance velocity mapping of blood flow patterns in the aorta in young vs. elderly normal subjects. J Magn Reson Imaging 1999;10:861-9.
20. Aase SA, Torp H, Støylen A. Aortic valve closure: relation to tissue veloc- ities by Doppler and speckle tracking in normal subjects. Eur J Echocardiogr 2008;9:555-9.
21. Oh JK, Tajik J. The return of cardiac time intervals: the phoenix is rising.
J Am Coll Cardiol 2003;42:1471-4.
22. Weidemann F, Kowalski M, D’hooge J, Bijnens B, Sutherland GR.
Doppler myocardial imaging. A new tool to assess regional inhomogeneity in cardiac function. Basic Res Cardiol 2001;96:595-605.
23. Aase SA, Stoylen A, Ingul CB, Frigstad S, Torp H. Automatic timing of aortic valve closure in apical tissue Doppler images. Ultrasound Med Biol 2006;32:19-27.
24. Aase SA, Björk-Ingul C, Thorstensen A, Torp H, Støylen A. Aortic valve closure: relation to tissue velocities by Doppler and speckle tracking in patients with infarction and at high heart rates. Echocardiography 2010;
27:363-9.