ABSTRACT
Background: Osteocalcin is known to regulate energy metabolism. Recently, metabolic syndrome (MetS) has been found to be associated with reduced levels of osteocalcin in men, as well as in postmenopausal women. The aim of this study was to investigate the association between serum osteocalcin and MetS in premenopausal women, compared with that in postmenopausal women.
Methods: This cross-sectional study was based on 5,896 participants who completed a health screening examination. They were classified according to their menopausal status. Each group was subdivided into non-MetS and MetS groups according to the modified National Cholesterol Education Program-Adult Treatment Panel III criteria. Serum osteocalcin levels were measured using the electrochemiluminescence immunoassay.
Results: Serum osteocalcin level was significantly lower in women with MetS than in those without MetS, after adjusting for confounders (14.12 ± 0.04 vs. 13.17 ± 0.13 [P = 0.004] in premenopausal women, and 20.34 ± 0.09 vs. 19.62 ± 0.21 [P < 0.001] in postmenopausal women), regardless of their menopausal status. Serum osteocalcin levels decreased
correspondingly with an increasing number of MetS elements (P for trend < 0.001). Multiple regression analysis demonstrated that waist circumference (β = −0.085 [P < 0.001] and β = −0.137 [P < 0.001]) and hemoglobin A1c (β = −0.09 [P < 0.001] and β = −0.145 [P <
0.001]) were independent predictors of osteocalcin in premenopausal and postmenopausal women. Triglyceride levels were also independently associated with osteocalcin levels in premenopausal women (β = −0.004 [P < 0.013]). The odds ratio (OR) for MetS was significantly higher in the lowest quartile than in the highest quartile of serum osteocalcin levels after adjusting for age, alkaline phosphatase, uric acid, high sensitivity C-reactive protein, and body mass index in all women (OR, 2.00; 95% confidence interval [CI], 1.49–2.68) as well as in premenopausal (OR, 2.23; 95% CI, 1.39–3.58) and postmenopausal (OR, 2.01; 95% CI, 1.26–3.23) subgroups.
Conclusion: Lower serum osteocalcin concentrations were significantly associated with MetS in both premenopausal and postmenopausal women and were therefore independent of menopausal status.
Keywords: Osteocalcin; Metabolic Syndrome; Premenopause; Postmenopause
Original Article
Received: Jun 24, 2020 Accepted: Dec 16, 2020 Address for Correspondence:
Hyun-Min Koh, MD
Department of Family Medicine, Samsung Changwon Hospital, School of Medicine, Sungkyunkwan University, 158 Paryong-ro, Masanhoewon-gu, Changwon 51353, Republic of Korea.
E-mail: [email protected]
© 2021 The Korean Academy of Medical Sciences.
This is an Open Access article distributed under the terms of the Creative Commons Attribution Non-Commercial License (https://
creativecommons.org/licenses/by-nc/4.0/) which permits unrestricted non-commercial use, distribution, and reproduction in any medium, provided the original work is properly cited.
ORCID iDs Jin-Sook Moon
https://orcid.org/0000-0002-7231-328X Mi Hyeon Jin
https://orcid.org/0000-0002-6436-2196 Hyun-Min Koh
https://orcid.org/0000-0002-3499-6198 Disclosure
The authors have no potential conflicts of interest to disclose.
Author Contributions
Conceptualization: Moon JS, Koh HM. Data curation: Moon JS, Jin MH. Formal analysis:
Moon JS, Jin MH. Methodology: Moon JS, Jin MH. Software: Jin MH. Writing - original draft:
Moon JS. Writing - review & editing: Moon JS, Koh HM.
Jin-Sook Moon ,1,2 Mi Hyeon Jin ,3 and Hyun-Min Koh 1
1 Department of Family Medicine, Samsung Changwon Hospital, School of Medicine, Sungkyunkwan University, Changwon, Korea
2 Department of Family Medicine, Pusan National University Graduate School of Medicine, Busan, Korea
3 Department of Research Support, Samsung Changwon Hospital, School of Medicine, Sungkyunkwan University, Changwon, Korea
Association between Serum
Osteocalcin Levels and Metabolic Syndrome according to the
Menopausal Status of Korean Women
Endocrinology, Nutrition &
Metabolism
INTRODUCTION
Osteocalcin is a non-collagenous protein synthesized and secreted into the blood by osteoblasts and has been routinely used as a serum marker of osteoblastic bone formation.1,2 Osteocalcin undergoes post-translational carboxylation of its glutamic acid residues to form γ-carboxyl glutamic acid, via a vitamin K-dependent reaction.2,3 Therefore, the circulating osteocalcin protein level consists of both carboxylated and undercarboxylated osteocalcin. Functionally, osteocalcin is a bone-derived hormone that critically regulates energy metabolism. Indeed, knockout mice lacking osteocalcin exhibited hyperglycemia, reduced serum insulin, increased fat mass and decreased energy expenditure, compared with wild type controls.3 Additionally, administration of recombinant osteocalcin protein to mice significantly reduced the fat mass, decreased the fasting glucose levels, and elevated insulin concentration compared with mice injected with vehicle alone.4 These functions of osteocalcin are fulfilled by undercarboxylated osteocalcin that promotes the proliferation of pancreatic β-cells via G protein-coupled receptor C6A (GPRC6A) and increases insulin secretion in mice.5,6
Based on these observations, osteocalcin may play a similar role in humans and depending on its levels, contribute to adverse metabolic outcomes including metabolic syndrome (MetS). Although the undercarboxylated form of osteocalcin enhanced pancreatic β-cell proliferation and insulin secretion in human pancreatic islets in vitro,7 the significance of these effects on glucose metabolism in vivo in humans remains unknown.8-13 On the other hand, in several clinical studies, serum osteocalcin was correlated with insulin resistance and appeared to be involved in the development of obesity and diabetes mellitus.10,13,14 Accumulating evidence points to an association between serum osteocalcin levels and development of MetS in men as well as in postmenopausal women.15-23 However, although serum osteocalcin levels are influenced by menopausal status as well as ethnicity, gender, and age,24,25 few studies have been conducted to specifically compare premenopausal and postmenopausal women in terms of the association between osteocalcin and MetS.
Because the menopausal transition alters bone and energy metabolism, it seems plausible that osteocalcin may exhibit a different relationship with metabolic dysregulation in premenopausal women compared with postmenopausal women. Therefore, we specifically investigated this association in premenopausal and postmenopausal Korean women.
METHODS
Study participants
A total of 68,128 women over 18 years of age were enrolled for this study at the Health Promotion Center in Changwon, Korea, from July 2011 to December 2016. All women visited our center for general health screening and were interviewed and examined by clinicians.
Exclusion criteria were: a history of malignancy; coronary artery disease; stroke; treatment for osteoporosis with any medication; use of medications known to influence bone density, such as vitamin D, estrogen, corticosteroids, thyroid hormone; use of anti-hyperlipidemic agents; history of bilateral oophorectomy; renal failure; liver disease, or thyroid
dysfunction; abnormal liver, thyroid, or kidney function; and treatment with anticoagulants, anticonvulsants, or multivitamins including vitamin K. Additionally, we excluded persons with incomplete data or missing information regarding menopausal history. If a woman visited more than once, only the last visit was included in the analysis. After the application
of the exclusion criteria, a total of 5,896 women aged 19 to 85, comprising a premenopausal group (n = 3,951) and a postmenopausal group (n = 1,945), were selected. Menopause was defined as the absence of natural menstruation for at least 12 months without any other medical cause for amenorrhea, or a serum follicle stimulating hormone (FSH) concentration > 40 mIU/mL.17,26 For subgroup analysis considering menopausal transition, participants whose FSH values were measured were divided into three group based on FSH levels: premenopausal (FSH ≤ 10 mIU/mL), perimenpausal (10 < FSH < 40 mIU/mL), and postmenopausal (FSH ≥ 40 mIU/mL).26
Clinical and anthropometric evaluation
All enrolled subjects completed a standardized questionnaire that included questions pertaining to medical history including present and past illnesses as well as their menstruation history. Height and weight were measured and body mass index (BMI) was calculated as weight (kg) divided by height squared (m2), using an automatic stadiometer (BSM 370; Biospace Co., Ltd., Seoul, Korea). Waist circumference (WC) was measured midway between the lowest rib and the iliac crest in the standing position. Systolic and diastolic blood pressures (SBP and DBP) were measured in the sitting position after
10-minute seated rest, using an automatic sphygmomanometer (EASY X 800; Jawon Medical Co., Ltd, Seoul, Korea).
Biochemical analyses
Biochemical analyses were performed on blood samples obtained after overnight fasting.
Fasting plasma glucose (FPG) level was measured via a glucose hexokinase in vitro diagnostic assay (Glucose HK gen.3; Roche Diagnostics, Mannheim, Germany) using the Roche- Hitachi Cobas 8000 c702 analyzer (Roche Diagnostics). Hemoglobin A1c (HbA1c) levels were analyzed via high-performance liquid chromatography (HPLC) using the Tosoh HLC- 723 G8 analyzer (Tosoh Co., Tokyo, Japan). Total cholesterol (TC), high-density lipoprotein cholesterol (HDL-C), low-density lipoprotein cholesterol (LDL-C), triglyceride (TG), serum high sensitivity-C-reactive protein (hs-CRP), and alkaline phosphatase (ALP) levels were measured using enzymatic procedures with Cobas reagents and were analyzed using the Cobas 8000 c702 analyzer (Roche Diagnostics). Serum concentrations of osteocalcin were determined using an electrochemiluminescence immunoassay (Roche Diagnostics). Insulin resistance was estimated via the homeostatic model assessment for insulin resistance (HOMA-IR) index27:
Insulin Resistance = Insulin (mU/L) × Fasting Plasma Glucose (mg/dL)/405 Definition of MetS
The diagnosis of MetS was based on the presence of three or more following criteria: 1) WC ≥ 80 cm (in accordance with the International Obesity Task Force criteria for the Asian-Pacific population); 2) SBP and/or DBP ≥ 130/85 mmHg or use of anti-hypertensive medications; 3) FPG ≥ 100 mg/dL or use of anti-diabetic medications; 4) Serum TG levels ≥ 150 mg/dL; and 5) HDL-C levels < 50 mg/dL, in agreement with the definition established by the modified National Cholesterol Education Program-Adult Treatment Panel III (NCEP-ATP III).28,29 Statistical analyses
All calculations were performed using Stata 14.0 (Stata Corporation, College Station, TX, USA). All P values were calculated using two-tailed tests, and statistical significance was considered established at values where P < 0.05. Continuous data were expressed as mean
± standard deviation (SD) and categorical variables were reported as number or percentage (%). Study population characteristics were stratified according to the presence or absence of MetS and were analyzed using independent t-tests for continuous variables and Pearson χ2 tests for categorical variables. Serum osteocalcin levels according to the number of MetS components were evaluated using multiple linear regression analysis and expressed as mean
± standard error (SE). The most important explanatory variables for serum osteocalcin were determined using multiple regression analyses. FPG and BMI were excluded from the analysis of independent variables to avoid multicollinearity (variance inflation factor [VIF] > 10).
Binary logistic regression analysis was performed to evaluate the odds ratios (ORs) for the presence of MetS according to serum osteocalcin concentration quartiles. Three adjusted models were used for the analyses. Model 1 was adjusted for age. Model 2 was further adjusted for factors significantly associated with osteocalcin in the multiple regression analyses and known as osteocalcin-associated factors except for MetS components: ALP, uric acid (UA), hs-CRP, and BMI. Model 3 was additionally adjusted for menopausal status. The three models were compared using their Akaike information criterion (AIC) and Bayesian information criterion (BIC) to assess whether the additional explanatory variables improved the model fit.
Ethics statement
This study was approved by the Institutional Review Board of Sungkyunkwan University Samsung Changwon Hospital (approval No. 2019-02-007-002). The requirement for informed consent from the participants was waived.
RESULTS
Characteristics of the subjects
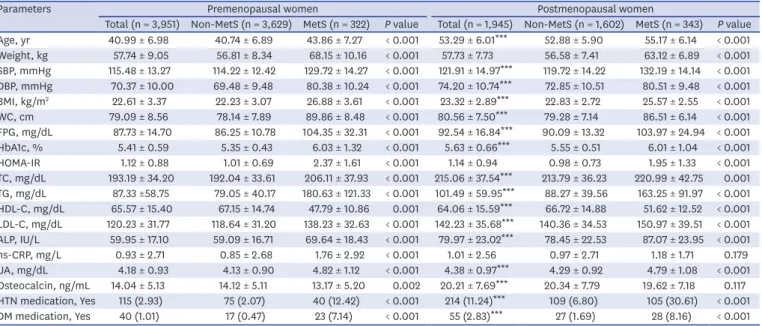
Baseline characteristics of study subjects are listed in Table 1. Overall prevalence of MetS was 11.3%, with 8.1% of premenopausal women and 17.6% of postmenopausal women meeting the definition.28,29 Postmenopausal women tended to be older with significantly higher values for SBP, DBP, BMI, WC, FPG, HbA1c, TC, TG, LDL-C, ALP, UA, and serum osteocalcin and significantly lower levels of HDL-C than premenopausal women. Serum osteocalcin levels were higher in postmenopausal women after adjustment for age, BMI, ALP, UA, and hs- CRP (Fig. 1A), which was consistent with previously reported data.16,24 All parameters, except hs-CRP and serum osteocalcin in postmenopausal women, differed significantly between participants with and without MetS in both the groups.
Association between serum osteocalcin and MetS
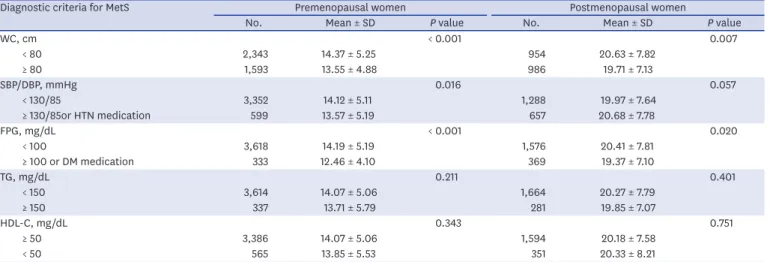
Serum osteocalcin levels of subjects with MetS were significantly lower than those without, in both premenopausal and postmenopausal women after adjustment for age, BMI, ALP, UA, and hs-CRP (Fig. 1B and C). Table 2 shows serum osteocalcin levels according to individual diagnostic criteria for MetS. Mean serum osteocalcin was lower in subjects with elevated WC, higher BP (or anti-hypertension medication) and increased FPG levels (or anti-diabetic medication) in premenopausal women. In postmenopausal women, it was significantly lower in participants with WC ≥ 80 cm, and FPG ≥ 100 mg/dL (or anti-diabetic medication).
Osteocalcin levels according to the number of MetS criteria are shown in Fig. 2. A significant reduction in mean serum osteocalcin levels was observed with increasing MetS criteria in both the groups.
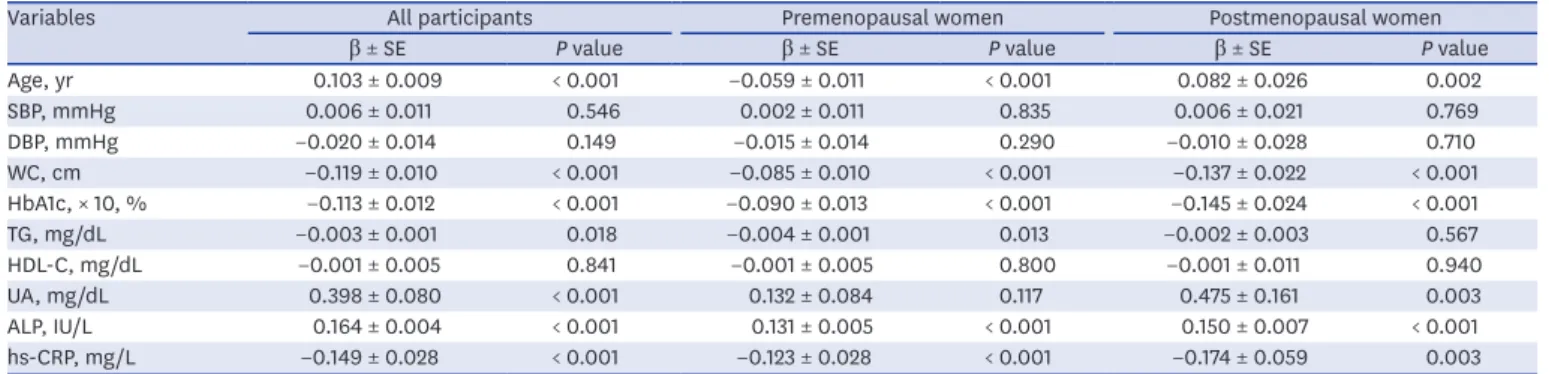
Association of serum osteocalcin with clinical and biochemical parameters Multiple regression analysis was performed to investigate the parameters independently associated with serum osteocalcin, by considering it as a dependent variable, and age, SBP, DBP, WC, HbA1c, TG, HDL-C, UA, ALP, and hs-CRP as independent variables in premenopausal and postmenopausal women (Table 3). Considering the possibility of multicollinearity (VIF > 10), HbA1c was adopted as a variable instead of FPG. HbA1c measurement had less biologic variability and HbA1c level has been significantly related to several metabolic risk factors, including FPG.30 Serum osteocalcin levels were independently and inversely associated with WC, HbA1c, and hs-CRP in both premenopausal and
postmenopausal women. Additionally, TG was also an independent predictor of osteocalcin Table 1. Baseline characteristics of the study population based on the presence or absence of MetS
Parameters Premenopausal women Postmenopausal women
Total (n = 3,951) Non-MetS (n = 3,629) MetS (n = 322) P value Total (n = 1,945) Non-MetS (n = 1,602) MetS (n = 343) P value Age, yr 40.99 ± 6.98 40.74 ± 6.89 43.86 ± 7.27 < 0.001 53.29 ± 6.01*** 52.88 ± 5.90 55.17 ± 6.14 < 0.001 Weight, kg 57.74 ± 9.05 56.81 ± 8.34 68.15 ± 10.16 < 0.001 57.73 ± 7.73 56.58 ± 7.41 63.12 ± 6.89 < 0.001 SBP, mmHg 115.48 ± 13.27 114.22 ± 12.42 129.72 ± 14.27 < 0.001 121.91 ± 14.97*** 119.72 ± 14.22 132.19 ± 14.14 < 0.001 DBP, mmHg 70.37 ± 10.00 69.48 ± 9.48 80.38 ± 10.24 < 0.001 74.20 ± 10.74*** 72.85 ± 10.51 80.51 ± 9.48 < 0.001 BMI, kg/m2 22.61 ± 3.37 22.23 ± 3.07 26.88 ± 3.61 < 0.001 23.32 ± 2.89*** 22.83 ± 2.72 25.57 ± 2.55 < 0.001 WC, cm 79.09 ± 8.56 78.14 ± 7.89 89.86 ± 8.48 < 0.001 80.56 ± 7.50*** 79.28 ± 7.14 86.51 ± 6.14 < 0.001 FPG, mg/dL 87.73 ± 14.70 86.25 ± 10.78 104.35 ± 32.31 < 0.001 92.54 ± 16.84*** 90.09 ± 13.32 103.97 ± 24.94 < 0.001 HbA1c, % 5.41 ± 0.59 5.35 ± 0.43 6.03 ± 1.32 < 0.001 5.63 ± 0.66*** 5.55 ± 0.51 6.01 ± 1.04 < 0.001 HOMA-IR 1.12 ± 0.88 1.01 ± 0.69 2.37 ± 1.61 < 0.001 1.14 ± 0.94 0.98 ± 0.73 1.95 ± 1.33 < 0.001 TC, mg/dL 193.19 ± 34.20 192.04 ± 33.61 206.11 ± 37.93 < 0.001 215.06 ± 37.54*** 213.79 ± 36.23 220.99 ± 42.75 0.001 TG, mg/dL 87.33 ±58.75 79.05 ± 40.17 180.63 ± 121.33 < 0.001 101.49 ± 59.95*** 88.27 ± 39.56 163.25 ± 91.97 < 0.001 HDL-C, mg/dL 65.57 ± 15.40 67.15 ± 14.74 47.79 ± 10.86 0.001 64.06 ± 15.59*** 66.72 ± 14.88 51.62 ± 12.52 < 0.001 LDL-C, mg/dL 120.23 ± 31.77 118.64 ± 31.20 138.23 ± 32.63 < 0.001 142.23 ± 35.68*** 140.36 ± 34.53 150.97 ± 39.51 < 0.001 ALP, IU/L 59.95 ± 17.10 59.09 ± 16.71 69.64 ± 18.43 < 0.001 79.97 ± 23.02*** 78.45 ± 22.53 87.07 ± 23.95 < 0.001 hs-CRP, mg/L 0.93 ± 2.71 0.85 ± 2.68 1.76 ± 2.92 < 0.001 1.01 ± 2.56 0.97 ± 2.71 1.18 ± 1.71 0.179 UA, mg/dL 4.18 ± 0.93 4.13 ± 0.90 4.82 ± 1.12 < 0.001 4.38 ± 0.97*** 4.29 ± 0.92 4.79 ± 1.08 < 0.001 Osteocalcin, ng/mL 14.04 ± 5.13 14.12 ± 5.11 13.17 ± 5.20 0.002 20.21 ± 7.69*** 20.34 ± 7.79 19.62 ± 7.18 0.117 HTN medication, Yes 115 (2.93) 75 (2.07) 40 (12.42) < 0.001 214 (11.24)*** 109 (6.80) 105 (30.61) < 0.001 DM medication, Yes 40 (1.01) 17 (0.47) 23 (7.14) < 0.001 55 (2.83)*** 27 (1.69) 28 (8.16) < 0.001 Data are presented as mean ± standard deviation or number (%).
MetS = metabolic syndrome, SBP = systolic blood pressure, DBP = diastolic blood pressure, BMI = body mass index, WC = waist circumference, FPG = fasting plasma glucose, HbA1c = hemoglobin A1c, HOMA-IR = homeostatic model assessment for insulin resistance, TC = total cholesterol, TG = triglyceride, HDL-C = high-density lipoprotein cholesterol, LDL-C = low-density lipoprotein cholesterol, ALP = alkaline phosphatase, hs-CRP = high sensitivity C-reactive protein, UA = uric acid, HTN = hypertension, DM = diabetes mellitus.
***P < 0.001 vs. premenopausal women: analyzed using independent t-tests for continuous variables and Pearson χ2 tests for categorical variables.
25 20 15
5 10
0
Osteocalcin, ng/mL
A
Premenopausal Postmenopausal
P < 0.001 15 P = 0.004 P < 0.001
14 13
11 12
0
Osteocalcin, ng/mL
B
Non-MetS
Premenopausal Postmenopausal
MetS
21 20 19
17 18
0
Osteocalcin, ng/mL
C
Non-MetS MetS
Fig. 1. Serum osteocalcin levels in relation to menopause and metabolic syndrome. (A) Mean serum osteocalcin levels in premenopausal and postmenopausal women. (B, C) Mean serum osteocalcin levels in MetS and non-MetS groups. Data were adjusted for age, BMI, ALP, UA, and hs-CRP, and are presented as mean ± standard error. Multiple linear regression analysis was performed to determine the level of significant difference.
MetS = metabolic syndrome, BMI = body mass index, ALP = alkaline phosphatase, UA = uric acid, hs-CRP = high sensitivity-C-reactive protein.
in premenopausal women. Similar to findings from an earlier study,24 serum osteocalcin levels and age were negatively correlated in premenopausal women, and positively correlated in postmenopausal women.
Another multiple regression analysis was performed using FPG and an added a parameter, HOMA-IR, instead of HbA1c with abovementioned the parameters (Supplementary Table 1).
As with HbA1c, serum osteocalcin levels were independently and inversely associated with WC, FPG, and hs-CRP in both premenopausal and postmenopausal women. However, serum osteocalcin levels and HOMA-IR were positively correlated in premenopausal women, and not associated in postmenopausal women (Supplementary Table 1).
Adjusted ORs for MetS based on osteocalcin levels
The results of the logistic regression analysis are shown in Table 4. When participants were divided into four groups based on serum osteocalcin levels, increased ORs of MetS were observed along with decreased serum osteocalcin levels after adjustment for age, ALP, UA, hs- Table 2. Comparison of osteocalcin according to each diagnostic criterion for MetS
Diagnostic criteria for MetS Premenopausal women Postmenopausal women
No. Mean ± SD P value No. Mean ± SD P value
WC, cm < 0.001 0.007
< 80 2,343 14.37 ± 5.25 954 20.63 ± 7.82
≥ 80 1,593 13.55 ± 4.88 986 19.71 ± 7.13
SBP/DBP, mmHg 0.016 0.057
< 130/85 3,352 14.12 ± 5.11 1,288 19.97 ± 7.64
≥ 130/85or HTN medication 599 13.57 ± 5.19 657 20.68 ± 7.78
FPG, mg/dL < 0.001 0.020
< 100 3,618 14.19 ± 5.19 1,576 20.41 ± 7.81
≥ 100 or DM medication 333 12.46 ± 4.10 369 19.37 ± 7.10
TG, mg/dL 0.211 0.401
< 150 3,614 14.07 ± 5.06 1,664 20.27 ± 7.79
≥ 150 337 13.71 ± 5.79 281 19.85 ± 7.07
HDL-C, mg/dL 0.343 0.751
≥ 50 3,386 14.07 ± 5.06 1,594 20.18 ± 7.58
< 50 565 13.85 ± 5.53 351 20.33 ± 8.21
MetS = metabolic syndrome, SD = standard deviation, WC = waist circumference, SBP = systolic blood pressure, DBP = diastolic blood pressure, HTN = hypertension, FPG = fasting plasma glucose, DM = diabetes mellitus, TG = triglyceride, HDL-C = high-density lipoprotein cholesterol.
15 14 13
11 12
0
Osteocalcin, ng/mL
≤ 1 2 3 ≥ 4
Metabolic syndrome components Premenopausal
P for trend < 0.001 21 20 19
17 18
0
Osteocalcin, ng/mL
≤ 1 2 3 ≥ 4
Metabolic syndrome components Postmenopausal
P for trend < 0.001
Fig. 2. Serum osteocalcin levels in relation to the number of MetS components. Data were adjusted for age, BMI, ALP, UA, and hs-CRP, and are expressed as mean ± standard error. Multiple linear regression analysis was performed to determine the level of significant difference.
MetS = metabolic syndrome, BMI = body mass index, ALP = alkaline phosphatase, UA = uric acid, hs-CRP = high sensitivity-C-reactive protein.
CRP, and BMI in both premenopausal and postmenopausal women (model 2). Furthermore, in all women, the ORs for MetS were significantly higher in the lower two quartiles (Q1 and Q2) of serum osteocalcin levels than in the highest quartile (Q4) after further adjustment for menopausal status (Model 3). The AIC values of models 2 and 3 for all women were very similar. The lowest value of BIC for all women was found in model 2 (Table 4).
Analysis of a subgroup excluding women previously diagnosed with hypertension or diabetes and on medication for that, yielded post-adjustment results (models 2 and 3) that were similar to those before exclusion (Supplementary Table 2 and Table 4). For another subgroup analysis regarding perimenopausal status, measured FSH values were divided by FSH concentrations (Supplementary Table 3). The results of models 2 and 3 in the table were similar to those of Table 4 in all women. In the perimenopausal and postmenopausal groups, the ORs for MetS were significantly higher in the lowest quartile (Q1) of serum osteocalcin levels than in the highest quartile (Q4) after further adjustment (model 2). In premenopausal women, the results showed similar trends, but were not statistically significant. The lowest values of AIC and BIC in all participants were found in model 2 (Supplementary Table 3).
DISCUSSION
The purpose of this study was to compare the relationship between osteocalcin and MetS according to menopausal status. To date, studies have yet to report the effect of menopausal Table 3. Multiple regression analysis with serum osteocalcin as a dependent variable
Variables All participants Premenopausal women Postmenopausal women
β ± SE P value β ± SE P value β ± SE P value
Age, yr 0.103 ± 0.009 < 0.001 −0.059 ± 0.011 < 0.001 0.082 ± 0.026 0.002
SBP, mmHg 0.006 ± 0.011 0.546 0.002 ± 0.011 0.835 0.006 ± 0.021 0.769
DBP, mmHg −0.020 ± 0.014 0.149 −0.015 ± 0.014 0.290 −0.010 ± 0.028 0.710
WC, cm −0.119 ± 0.010 < 0.001 −0.085 ± 0.010 < 0.001 −0.137 ± 0.022 < 0.001
HbA1c, × 10, % −0.113 ± 0.012 < 0.001 −0.090 ± 0.013 < 0.001 −0.145 ± 0.024 < 0.001
TG, mg/dL −0.003 ± 0.001 0.018 −0.004 ± 0.001 0.013 −0.002 ± 0.003 0.567
HDL-C, mg/dL −0.001 ± 0.005 0.841 −0.001 ± 0.005 0.800 −0.001 ± 0.011 0.940
UA, mg/dL 0.398 ± 0.080 < 0.001 0.132 ± 0.084 0.117 0.475 ± 0.161 0.003
ALP, IU/L 0.164 ± 0.004 < 0.001 0.131 ± 0.005 < 0.001 0.150 ± 0.007 < 0.001
hs-CRP, mg/L −0.149 ± 0.028 < 0.001 −0.123 ± 0.028 < 0.001 −0.174 ± 0.059 0.003
SE = standard error, SBP = systolic blood pressure, DBP = diastolic blood pressure, WC = waist circumference, HbA1c = hemoglobin A1c, TG = triglyceride; HDL-C
= high-density lipoprotein cholesterol, UA = uric acid, ALP = alkaline phosphatase, hs-CRP = high sensitivity C-reactive protein.
Table 4. Association between serum osteocalcin and MetS
Variables Quartile 1 (n = 1,475) Quartile 2 (n = 1,473) Quartile 3 (n = 1,478) Quartile 4 (n = 1,470) P for trend AIC BIC
Osteocalcin, ng/mL 9.38 ± 1.54 12.92 ± 0.90 16.71 ± 1.36 25.32 ± 6.06
All participants
Model 1 1.44 (1.13–1.84) 1.36 (1.07–1.73) 0.92 (0.72–1.17) 1 < 0.001 3,934.99 3,968.40
Model 2 2.00 (1.49–2.68) 1.62 (1.23–2.15) 1.05 (0.80–1.37) 1 < 0.001 3,166.64 3,226.77
Model 3 2.12 (1.57–2.86) 1.69 (1.27–2.25) 1.06 (0.81–1.39) 1 < 0.001 3,166.28 3,233.10
Premenopausal women
Model 1 1.56 (1.05–2.33) 1.42 (0.95–2.14) 0.74 (0.47–1.18) 1 < 0.001 2,158.10 2,189.51
Model 2 2.23 (1.39–3.58) 1.86 (1.16–3.00) 0.95 (0.57–1.59) 1 < 0.001 1,659.12 1,715.65
Postmenopausal women
Model 1 1.51 (1.01–2.27) 1.37 (0.97–1.94) 1.11 (0.84–1.49) 1 0.016 1,776.60 1,804.46
Model 2 2.01 (1.26–3.23) 1.45 (0.98–2.13) 1.12 (0.81–1.54) 1 0.002 1,513.62 1,563.78
Data are shown as mean ± standard deviation or odds ratio (95% confidence interval). Model 1 was adjusted for age. Model 2 was further adjusted for alkaline phosphatase, uric acid, high sensitivity C-reactive protein, and body mass index. Model 3 was further adjusted for menopausal status.
MetS = metabolic syndrome, AIC = Akaike information criterion, BIC = Bayesian information criterion.
status on the association between serum osteocalcin levels and MetS. This study directly compare these parameters. Menopause results in metabolic and endocrine changes as well as termination of fertility in women, leading to fat accumulation in the body, development of central obesity, and an increase in insulin resistance, which can result in MetS. Parameters such as blood pressure, total cholesterol, and LDL-C increase, and HDL-C decreases after menopause. This study confirms that menopause is accompanied by a general change in the metabolic characteristics studied. Since low serum osteocalcin level is associated with MetS in men and total serum osteocalcin levels rise with age after menopause,16,24 the relationship between premenopausal serum osteocalcin and MetS may differ from that observed in postmenopausal levels. However, we found that lower serum osteocalcin levels were
significantly associated with MetS in both groups, with or without menopause. In the logistic regression analysis (Table 4 and Supplementary Table 3), model 2 (all women with the lowest value of BIC) was considered more likely to adequately explain the association between serum osteocalcin and MetS, suggesting that menopausal status was not an appropriate determinant.
Previous studies reported that serum osteocalcin concentration was affected by age, gender, ethnicity,24,31 and menopausal status.32,33 In women, the level of serum osteocalcin showed a J-shaped relationship with age, with 40s being the vertex and the level of osteocalcin rising between 40s and 50s.24,31 This relationship was also observed in our study (Supplementary Fig. 1) and its results stating that serum osteocalcin levels and age were negatively correlated in premenopausal women and positively correlated in postmenopausal women were consistent with the abovementioned study (Table 3). Osteocalcin is a bone turnover marker and high bone turnover occurs in women during menopausal transition. The perimenopause, which literally means “about or around the menopause,” begins at the same time as the menopausal transition and ends 1 year after the final menstrual period.34 In Koreans, the most recently reported mean age at natural menopause was 49.3 years.35 To account for changes during perimenopause, FSH values of participants were measured and divided by FSH concentrations. The menopausal staging definition was formulated at the Stages of Reproductive Aging Workshop (STRAW)34 and states that perimenopause encompassed both early transition (a gap in normal menstrual period of longer than 7 days) and late transition (≥ 2 skipped menstrual cycles or no menses for ≥ 60 days). However, using our questionnaire, we could not obtain detailed information about the pattern of menstrual changes outlined by STRAW, and because the definition of perimenopause is ambiguous, we defined perimenopausal women using FSH levels with reference to a previous study.26
Several studies have demonstrated the association between serum osteocalcin and metabolic abnormalities. Consistent with the results presented here, previous studies demonstrated that serum osteocalcin was negatively correlated with hyperglycemia in premenopausal and postmenopausal women.16,17,19 Choudhury et al.20 reported a significant inverse association between osteocalcin level and type 2 diabetes with an effect size stronger in premenopausal women than in postmenopausal women. On the other hand, Kim et al.21 demonstrated that serum osteocalcin was associated with insulin resistance only in postmenopausal women in Korea. We observed that serum osteocalcin was positively correlated with HOMA-IR in premenopausal women, but no significant correlations were found in postmenopausal women, although osteocalcin was negatively correlated with FPG and HbA1c in both the groups (Table 3 and Supplementary Table 1). Some of these discrepancies may be explained by differences in study populations, inclusion and exclusion criteria, and adjustment strategies for potential confounders. We defined menopause as the absence of natural menstruation for at least 12 months without other medical causes for amenorrhea, or an FSH
concentration > 40 mIU/mL,17,26 whereas Kim et al.21 defined it as cessation of menstruation for at least 1year, with an FSH level ≥ 30 mIU/mL. Their premenopausal population tended to be older and postmenopausal population tended to be younger because a balanced study population (61 pairs) was selected among all participants. Considering that the average menopausal age of Korean women is approximately 50 years,35 they may not represent the general premenopausal and postmenopausal populations.21 Meanwhile, insulin regulates osteocalcin through insulin receptor signaling in osteoblasts.36 There is a feedback loop between osteocalcin and insulin, wherein each promotes the expression of the other.37 However, undercarboxylated osteocalcin did not correlate with insulin resistance measured via the hyperinsulinemic-euglycemic clamp technique in participants with type 2 diabetes.38 D'Amelio et al.39 reported that intermittent treatment with parathyroid hormone decreased glucose level consistent with increased osteocalcin level without influencing insulin secretion and resistance, pancreatic β-cell function, and fat mass in non-diabetic persons. These observations demonstrated that serum osteocalcin may affect glucose homeostasis in an insulin-independent manner. Furthermore, GPRC6A was found to be the only potential receptor for osteocalcin, but neither the structure of GPRC6A nor the molecular mechanism for osteocalcin binding has yet been reported.40 In a recent study, full locus GPRC6A knock out (KO) mice presented with normal serum insulin and glucose levels, and unchanged insulin sensitivity compared with wild type controls, although the KO mice exhibited significantly reduced serum osteocalcin protein and mRNA levels.41 These results revealed that GPRC6A may be not the actual receptor for osteocalcin or that ostecalcin may have another unknown mechanism for glucose regulation.
Dyslipidemia in MetS is characterized by elevated TG and reduced HDL-C levles.28 However, the relationship between osteocalcin and lipid metabolism is disputed.16,17 Although our multiple regression analyses showed that serum osteocalcin correlated negatively with TG only in premenopausal women (Table 3), the current study failed to correlate osteocalcin level and other elements of the lipid profile (data not shown). The relationship between serum osteocalcin levels and blood pressure also appears unclear.22,23,42,43 We found that serum osteocalcin level was not related to blood pressure in multiple regression analyses (Table 3), which is consistent with a few studies23,43 but not others.22,42 The majority of the published studies report that osteocalcin level is inversely correlated with central obesity.18,22,23 Chen et al.44 demonstrated a negative correlation between serum osteocalcin and waist-hip ratio (WHR) in men, but not in postmenopausal women. Our study shows that serum osteocalcin was negatively correlated with WC in both premenopausal and postmenopausal women.
Our findings are consistent with recent studies that have explored the relationship between osteocalcin and MetS.15 Yang et al.18 investigated postmenopausal women in China and found an inverse association of serum osteocalcin with MetS. Other prior studies have demonstrated an inverse correlation between serum osteocalcin levels and MetS in Chinese men22 and in older individuals from the Netherlands.45 MetS has become a major worldwide public health epidemic, with particular manifestations such as type 2 diabetes mellitus (T2DM) and cardiovascular disease (CVD).46,47 The finding that osteocalcin is a regulator of energy metabolism has led to several studies investigating its relationship with CVD. A systematic review and meta-analysis demonstrated no obvious association between osteocalcin and atherosclerosis.48 However, a few investigators found that osteocalcin expression was associated with vascular calcification in in vivo and in vitro animal experiments.49-51 Akiyoshi and colleagues52 observed that higher osteocalcin levels in C57BL/6 mice were positively correlated with an increase in thoracic aorta calcification.
Further studies based on study populations and characteristics, inclusion and exclusion criteria, and osteocalcin assay methods, as well as measures of vessel calcification or atherosclerosis are required to resolve the discrepancies seen in these results.
Ferron et al.4 showed that daily injections of recombinant osteocalcin in mice fed with a high-fat diet improved glucose intolerance and insulin sensitivity, increased overall energy expenditure and prevented obesity. They concluded that treatment with osteocalcin alleviated glucose intolerance and prevented the onset of T2DM. Furthermore, several clinical studies have suggested that serum osteocalcin may be a potential therapeutic target in future prevention and treatment efforts against adverse metabolic outcomes such as MetS.15 Our results provide indirect evidence supporting this potential approach targeting women, irrespective of menopausal status.
In our study, the participants were restricted to a single institution, which was a limitation.
A possible selection bias and the retrospective cross-sectional design were the other study limitations. Furthermore, dietary and smoking habits, alcohol consumption and physical activity were not considered. Vitamin K levels affect the post-translational modification of osteocalcin protein; however, no assays of vitamin K were conducted. Nevertheless, to minimize the possibility of this effect, the study was performed on subjects who were not treated with vitamin K antagonists or multi-vitamin supplements. We measured only total osteocalcin and did not measure the undercarboxylated form. Epidemiological studies have shown the association of lower levels of undercarboxylated osteocalcin with insulin resistance and risk of type 2 diabetes, although the method for assaying circulating undercarboxylated osteocalcin needs to be optimized.11,53,54 However, it is still unclear whether undercarboxylated osteocalcin is the metabolically active form in humans.8-13 We defined perimenopausal women by FSH levels while studying subgroup analysis considering menopausal transition.26 Application of other criteria for perimenopause may yield different results.
Despite these limitations, this study is one of a few studies showing an association between serum osteocalcin levels and MetS in premenopausal women. Although serum osteocalcin level in postmenopausal women was higher than that in the premenopausal women, a lower serum osteocalcin level was significantly associated with MetS in both the groups. No significant differences of association existed between osteocalcin and MetS with respect to menopausal status. Thus, serum osteocalcin may act as a menopause-independent metabolic regulator. Further studies are needed to shed light on the mechanisms underlying the role of osteocalcin in MetS and CVD.
ACKNOWLEDGMENTS
We would like to thank Editage (www.editage.co.kr) for English language editing.
SUPPLEMENTARY MATERIALS
Supplementary Table 1
Multiple regression analysis for determinants of osteocalcin Click here to view
Supplementary Table 2
Association between serum osteocalcin and MetS in the subgroup without previously diagnosed diabetes or hypertension and on medication for the same
Click here to view
Supplementary Table 3
Association between serum osteocalcin and MetS in the subgroup with measured FSH levels Click here to view
Supplementary Fig. 1
Serum osteocalcin levels by age in premenopausal and postmenopausal women.
Click here to view
REFERENCES
1. Wei J, Karsenty G. An overview of the metabolic functions of osteocalcin. Rev Endocr Metab Disord 2015;16(2):93-8.
PUBMED | CROSSREF
2. Hauschka PV, Lian JB, Cole DE, Gundberg CM. Osteocalcin and matrix Gla protein: vitamin K-dependent proteins in bone. Physiol Rev 1989;69(3):990-1047.
PUBMED | CROSSREF
3. Lee NK, Sowa H, Hinoi E, Ferron M, Ahn JD, Confavreux C, et al. Endocrine regulation of energy metabolism by the skeleton. Cell 2007;130(3):456-69.
PUBMED | CROSSREF
4. Ferron M, McKee MD, Levine RL, Ducy P, Karsenty G. Intermittent injections of osteocalcin improve glucose metabolism and prevent type 2 diabetes in mice. Bone 2012;50(2):568-75.
PUBMED | CROSSREF
5. Liu JM, Rosen CJ, Ducy P, Kousteni S, Karsenty G. Regulation of glucose handling by the skeleton:
insights from mouse and human studies. Diabetes 2016;65(11):3225-32.
PUBMED | CROSSREF
6. Wei J, Hanna T, Suda N, Karsenty G, Ducy P. Osteocalcin promotes β-cell proliferation during development and adulthood through Gprc6a. Diabetes 2014;63(3):1021-31.
PUBMED | CROSSREF
7. Sabek OM, Nishimoto SK, Fraga D, Tejpal N, Ricordi C, Gaber AO. Osteocalcin effect on human β-cells mass and function. Endocrinology 2015;156(9):3137-46.
PUBMED | CROSSREF
8. Funakoshi S, Yoshimura K, Hirano S, Ohmi S, Amano E, Fukuda Y, et al. Undercarboxylated osteocalcin correlates with insulin secretion in Japanese individuals with diabetes. Diabetol Metab Syndr 2020;12(1):72.
PUBMED | CROSSREF
9. Díaz-López A, Bulló M, Juanola-Falgarona M, Martínez-González MA, Estruch R, Covas MI, et al.
Reduced serum concentrations of carboxylated and undercarboxylated osteocalcin are associated with risk of developing type 2 diabetes mellitus in a high cardiovascular risk population: a nested case-control study. J Clin Endocrinol Metab 2013;98(11):4524-31.
PUBMED | CROSSREF
10. Ngarmukos C, Chailurkit LO, Chanprasertyothin S, Hengprasith B, Sritara P, Ongphiphadhanakul B.
A reduced serum level of total osteocalcin in men predicts the development of diabetes in a long-term follow-up cohort. Clin Endocrinol (Oxf ) 2012;77(1):42-6.
PUBMED | CROSSREF
11. Liu DM, Guo XZ, Tong HJ, Tao B, Sun LH, Zhao HY, et al. Association between osteocalcin and glucose metabolism: a meta-analysis. Osteoporos Int 2015;26(12):2823-33.
PUBMED | CROSSREF
12. Riquelme-Gallego B, García-Molina L, Cano-Ibáñez N, Sánchez-Delgado G, Andújar-Vera F, García- Fontana C, et al. Circulating undercarboxylated osteocalcin as estimator of cardiovascular and type 2 diabetes risk in metabolic syndrome patients. Sci Rep 2020;10(1):1840.
PUBMED | CROSSREF
13. Shu H, Pei Y, Chen K, Lu J. Significant inverse association between serum osteocalcin and incident type 2 diabetes in a middle-aged cohort. Diabetes Metab Res Rev 2016;32(8):867-74.
PUBMED | CROSSREF
14. Urano T, Shiraki M, Kuroda T, Tanaka S, Urano F, Uenishi K, et al. Low serum osteocalcin concentration is associated with incident type 2 diabetes mellitus in Japanese women. J Bone Miner Metab 2018;36(4):470-7.
PUBMED | CROSSREF
15. Kunutsor SK, Apekey TA, Laukkanen JA. Association of serum total osteocalcin with type 2 diabetes and intermediate metabolic phenotypes: systematic review and meta-analysis of observational evidence. Eur J Epidemiol 2015;30(8):599-614.
PUBMED | CROSSREF
16. Zhou M, Ma X, Li H, Pan X, Tang J, Gao Y, et al. Serum osteocalcin concentrations in relation to glucose and lipid metabolism in Chinese individuals. Eur J Endocrinol 2009;161(5):723-9.
PUBMED | CROSSREF
17. Bae SJ, Choe JW, Chung YE, Kim BJ, Lee SH, Kim HY, et al. The association between serum osteocalcin levels and metabolic syndrome in Koreans. Osteoporos Int 2011;22(11):2837-46.
PUBMED | CROSSREF
18. Yang R, Ma X, Pan X, Wang F, Luo Y, Gu C, et al. Serum osteocalcin levels in relation to metabolic syndrome in Chinese postmenopausal women. Menopause 2013;20(5):548-53.
PUBMED | CROSSREF
19. Im JA, Yu BP, Jeon JY, Kim SH. Relationship between osteocalcin and glucose metabolism in postmenopausal women. Clin Chim Acta 2008;396(1-2):66-9.
PUBMED | CROSSREF
20. Choudhury AB, Sarkar PD, Sakalley DK, Petkar SB. Role of adiponectin in mediating the association of osteocalcin with insulin resistance and type 2 diabetes: a cross sectional study in pre- and post- menopausal women. Arch Physiol Biochem 2014;120(2):73-9.
PUBMED | CROSSREF
21. Kim S, Lee JY, Im JA, Kim DW, Lee HS, Kim SH, et al. Association between serum osteocalcin and insulin resistance in postmenopausal, but not premenopausal, women in Korea. Menopause 2013;20(10):1061-6.
PUBMED | CROSSREF
22. Tan A, Gao Y, Yang X, Zhang H, Qin X, Mo L, et al. Low serum osteocalcin level is a potential marker for metabolic syndrome: results from a Chinese male population survey. Metabolism 2011;60(8):1186-92.
PUBMED | CROSSREF
23. Lee SW, Jo HH, Kim MR, Kim JH, You YO. Association between osteocalcin and metabolic syndrome in postmenopausal women. Arch Gynecol Obstet 2015;292(3):673-81.
PUBMED | CROSSREF
24. Gundberg CM, Looker AC, Nieman SD, Calvo MS. Patterns of osteocalcin and bone specific alkaline phosphatase by age, gender, and race or ethnicity. Bone 2002;31(6):703-8.
PUBMED | CROSSREF
25. Yasui T, Uemura H, Tomita J, Miyatani Y, Yamada M, Miura M, et al. Association of serum
undercarboxylated osteocalcin with serum estradiol in pre-, peri- and early post-menopausal women. J Endocrinol Invest 2006;29(10):913-8.
PUBMED | CROSSREF
26. Kim CJ, Kim TH, Ryu WS, Ryoo UH. Influence of menopause on high density lipoprotein-cholesterol and lipids. J Korean Med Sci 2000;15(4):380-6.
PUBMED | CROSSREF
27. Matthews DR, Hosker JP, Rudenski AS, Naylor BA, Treacher DF, Turner RC. Homeostasis model assessment: insulin resistance and β-cell function from fasting plasma glucose and insulin concentrations in man. Diabetologia 1985;28(7):412-9.
PUBMED | CROSSREF
28. Alberti KG, Zimmet P, Shaw J. Metabolic syndrome--a new world-wide definition. A Consensus Statement from the International Diabetes Federation. Diabet Med 2006;23(5):469-80.
PUBMED | CROSSREF
29. Hong AR, Lim S. Clinical characteristics of metabolic syndrome in Korea, and its comparison with other Asian countries. J Diabetes Investig 2015;6(5):508-15.
PUBMED | CROSSREF
30. Park SH, Yoon JS, Won KC, Lee HW. Usefulness of glycated hemoglobin as diagnostic criteria for metabolic syndrome. J Korean Med Sci 2012;27(9):1057-61.
PUBMED | CROSSREF
31. Vanderschueren D, Gevers G, Raymaekers G, Devos P, Dequeker J. Sex- and age-related changes in bone and serum osteocalcin. Calcif Tissue Int 1990;46(3):179-82.
PUBMED | CROSSREF
32. Atalay S, Elci A, Kayadibi H, Onder CB, Aka N. Diagnostic utility of osteocalcin, undercarboxylated osteocalcin, and alkaline phosphatase for osteoporosis in premenopausal and postmenopausal women.
Ann Lab Med 2012;32(1):23-30.
PUBMED | CROSSREF
33. Park SG, Jeong SU, Lee JH, Ryu SH, Jeong HJ, Sim YJ, et al. The changes of CTX, DPD, osteocalcin, and bone mineral density during the postmenopausal period. Ann Rehabil Med 2018;42(3):441-8.
PUBMED | CROSSREF
34. Soules MR, Sherman S, Parrott E, Rebar R, Santoro N, Utian W, et al. Executive summary: Stages of Reproductive Aging Workshop (STRAW). Climacteric 2001;4(4):267-72.
PUBMED | CROSSREF
35. Park CY, Lim JY, Park HY. Age at natural menopause in Koreans: secular trends and influences thereon.
Menopause 2018;25(4):423-9.
PUBMED | CROSSREF
36. Fulzele K, Riddle RC, DiGirolamo DJ, Cao X, Wan C, Chen D, et al. Insulin receptor signaling in osteoblasts regulates postnatal bone acquisition and body composition. Cell 2010;142(2):309-19.
PUBMED | CROSSREF
37. Desentis-Desentis MF, Rivas-Carrillo JD, Sánchez-Enríquez S. Protective role of osteocalcin in diabetes pathogenesis. J Bone Miner Metab 2020;38(6):765-71.
PUBMED | CROSSREF
38. Mori K, Emoto M, Motoyama K, Lee E, Yamada S, Morioka T, et al. Undercarboxylated osteocalcin does not correlate with insulin resistance as assessed by euglycemic hyperinsulinemic clamp technique in patients with type 2 diabetes mellitus. Diabetol Metab Syndr 2012;4(1):53.
PUBMED | CROSSREF
39. D'Amelio P, Sassi F, Buondonno I, Spertino E, Tamone C, Piano S, et al. Effect of intermittent PTH treatment on plasma glucose in osteoporosis: a randomized trial. Bone 2015;76:177-84.
PUBMED | CROSSREF
40. Li J, Zhang H, Yang C, Li Y, Dai Z. An overview of osteocalcin progress. J Bone Miner Metab 2016;34(4):367-79.
PUBMED | CROSSREF
41. Jørgensen CV, Gasparini SJ, Tu J, Zhou H, Seibel MJ, Bräuner-Osborne H. Metabolic and skeletal homeostasis are maintained in full locus GPRC6A knockout mice. Sci Rep 2019;9(1):5995.
PUBMED | CROSSREF
42. Sanchez-Enriquez S, Ballesteros-Gonzalez IT, Villafán-Bernal JR, Pascoe-Gonzalez S, Rivera-Leon EA, Bastidas-Ramirez BE, et al. Serum levels of undercarboxylated osteocalcin are related to cardiovascular risk factors in patients with type 2 diabetes mellitus and healthy subjects. World J Diabetes 2017;8(1):11-7.
PUBMED | CROSSREF
43. Xu Y, Ma X, Xiong Q, Hu X, Zhang X, Yuan Y, et al. Association between serum osteocalcin level and blood pressure in a Chinese population. Blood Press 2018;27(2):106-11.
PUBMED | CROSSREF
44. Chen L, Li Q, Yang Z, Ye Z, Huang Y, He M, et al. Osteocalcin, glucose metabolism, lipid profile and chronic low-grade inflammation in middle-aged and elderly Chinese. Diabet Med 2013;30(3):309-17.
PUBMED | CROSSREF
45. Oosterwerff MM, van Schoor NM, Lips P, Eekhoff EM. Osteocalcin as a predictor of the metabolic syndrome in older persons: a population-based study. Clin Endocrinol (Oxf ) 2013;78(2):242-7.
PUBMED | CROSSREF
46. Hanson RL, Imperatore G, Bennett PH, Knowler WC. Components of the “metabolic syndrome” and incidence of type 2 diabetes. Diabetes 2002;51(10):3120-7.
PUBMED | CROSSREF
47. Lakka HM, Laaksonen DE, Lakka TA, Niskanen LK, Kumpusalo E, Tuomilehto J, et al. The metabolic syndrome and total and cardiovascular disease mortality in middle-aged men. JAMA 2002;288(21):2709-16.
PUBMED | CROSSREF
48. Millar SA, Patel H, Anderson SI, England TJ, O'Sullivan SE. Osteocalcin, vascular calcification, and atherosclerosis: a systematic review and meta-analysis. Front Endocrinol (Lausanne) 2017;8:183.
PUBMED | CROSSREF
49. Zhou S, Fang X, Xin H, Li W, Qiu H, Guan S. Osteoprotegerin inhibits calcification of vascular smooth muscle cell via down regulation of the Notch1-RBP-Jκ/Msx2 signaling pathway. PLoS One 2013;8(7):e68987.
PUBMED | CROSSREF
50. Idelevich A, Rais Y, Monsonego-Ornan E. Bone Gla protein increases HIF-1alpha-dependent glucose metabolism and induces cartilage and vascular calcification. Arterioscler Thromb Vasc Biol 2011;31(9):e55-71.
PUBMED | CROSSREF
51. Pal SN, Rush C, Parr A, Van Campenhout A, Golledge J. Osteocalcin positive mononuclear cells are associated with the severity of aortic calcification. Atherosclerosis 2010;210(1):88-93.
PUBMED | CROSSREF
52. Akiyoshi T, Ota H, Iijima K, Son BK, Kahyo T, Setou M, et al. A novel organ culture model of aorta for vascular calcification. Atherosclerosis 2016;244:51-8.
PUBMED | CROSSREF
53. Lin X, Brennan-Speranza TC, Levinger I, Yeap BB. Undercarboxylated osteocalcin: experimental and human evidence for a role in glucose homeostasis and muscle regulation of insulin sensitivity. Nutrients 2018;10(7):847.
PUBMED | CROSSREF
54. Ferron M, Wei J, Yoshizawa T, Ducy P, Karsenty G. An ELISA-based method to quantify osteocalcin carboxylation in mice. Biochem Biophys Res Commun 2010;397(4):691-6.
PUBMED | CROSSREF