Use of Medical Resources by Preterm Infants Born at Less than 33 Weeks’ Gestation Following Discharge from the Neonatal
Intensive Care Unit in Korea
This study was aimed to provide data on the use of medical resources by preterm infants following discharge from the neonatal intensive care unit (NICU). The cohort included preterm infants (n = 2,351) born at 22-32 weeks’ gestation who were discharged from the NICUs of 44 Korean hospitals between April 2009 to March 2010. Mean duration of post- discharge follow-up was 425 ± 237 days. After discharge from the NICU, 94.5% of total infants visited a pediatric outpatient clinic (11.5 ± 9.8 mean visits), 42.9% visited a pediatric clinic for respiratory problems irregularly (4.9 ± 6.6 mean visits), and 31.1%
utilized emergency center at least once. Among all visits to the emergency center, 24.7%
resulted in readmission and 50.8% of those visits were due to respiratory problems. At least one episode of readmission was required by 33.6% (788/2,346) of total infants, and 18.4% (431/2,346) of total infants were readmitted with respiratory problems at least once. Among all infants readmitted for respiratory problems, 16.2% (70/341) were diagnosed with respiratory syncytial virus infection which accounted for 30.3% of viral etiologies confirmed by laboratory testing. Infants born at < 30 weeks’ gestation had more frequent total readmission and respiratory readmission than those ≥ 30 weeks’
gestation (2 ± 1.7 vs. 1.7 ± 1.2, P = 0.009, 1.8 ± 1.2 vs. 1.5 ± 1.1, 0.027, respectively).
Overall, use of medical resources is common, and respiratory problems are the leading cause of use of medical resources. Total readmissions and respiratory readmissions are more frequent in more immature infants.
Keywords: Infant, Premature; Patient Readmission; Outpatient Clinics; Hospital;
Emergency Service, Respiratory Problems Jang Hoon Lee1 and Yun Sil Chang,2
for the Committee on Data Collection and Statistical Analysis, the Korean Society of Neonatology
1Department of Pediatrics, Ajou University School of Medicine, Suwon; 2Department of Pediatrics, Samsung Medical Center, Sungkyunkwan University School of Medicine, Seoul, Korea
Received: 22 April 2015 Accepted: 24 July 2015 Address for Correspondence:
Yun Sil Chang, MD
Department of Pediatrics, Samsung Medical Center, Sungkyunkwan University School of Medicine, 81 Irwon-ro, Gangnam-gu, Seoul 06351, Korea
Tel: +82.2-3410-3528, Fax: +82.2-3410-0043 E-mail: [email protected]
Funding: This study was supported by a grant (PHO1115545) from the Committee on Data Collection and Statistical Analysis of the Korean Society of Neonatology.
http://dx.doi.org/10.3346/jkms.2015.30.S1.S95 • J Korean Med Sci 2015; 30: S95-103
INTRODUCTION
As perinatal and neonatal care are continuously advancing, more preterm infants are surviving and being discharged from the neonatal intensive care unit (NICU) (1). However, many preterm infants who are discharged from the NICU have neo- natal morbidities such as bronchopulmonary dysplasia (BPD), necrotizing enterocolitis (NEC), and hydrocephalus, which re- sult in the use of medical resources and become risk factors for readmission (2-4).
A better understanding regarding the use of medical resourc- es among preterm infants after discharge from the NICU, and identification of associated risk factors during their stay in the NICU, could facilitate discharge planning of preterm infants and education for their parents. Previous studies have reported that 40.1% of preterm infants born at < 32 weeks’ gestation (4) and 15% of preterm infants < 36 weeks’ gestation (3) were re- admitted, and 22.2% of infants (5) who were born at < 32 weeks’
gestation visited an emergency center during the first year of
life. However, those studies were focused mainly on healthcare costs and perinatal factors associated with readmission (3,6,7).
To date, no nation-wide study has looked at the use of medical resources among preterm infants after discharge from the NICU in Korea.
The aim of this study was to evaluate the incidence of read- mission and visits to emergency centers as well as regular or ir- regular visits to outpatient clinics following discharge from the NICU in preterm infants of < 33 weeks’ gestational age in Korea.
MATERIALS AND METHODS
This study was performed as a project entitled “Retrospective Study to Evaluate Rehospitalization & Health Care Utilization after NICU Discharge in Preterm Infant of < 33 weeks’ gestation (RHANPI)”
Patient population
The cohort included all preterm infants born between 22 and
32 weeks’ gestation who were discharged from the NICUs of 44 Korean hospitals between April 2009 and March 2010, regard- less of survival or death (n = 2,698). The total number of infants encompassed about two-third of annual births at < 33 weeks’
gestation in Korea (8). Among those infants, 2,373 (88.0%) had survived and were discharged from the NICU. After excluding 21 infants who had incomplete data collection, 2,35l infants were
enrolled in this study (Fig. 1). Mean ± standard deviation (SD) of gestational age (GA) of total infants was 29+4± 2+1 weeks and Mean ± SD of birth weight was 1,403 ± 413 g. Perinatal and neo- natal characteristics of the total infants, infants born at ≥ 30 weeks’
gestation (infants ≥ 30 weeks) and infants born at < 30 weeks’
gestation (infants < 30 weeks) are shown in Table 1.
Data collection
The Committee on Data Collection and Statistical Analysis of the Korean Society of Neonatology chose 44 NICUs in Korea.
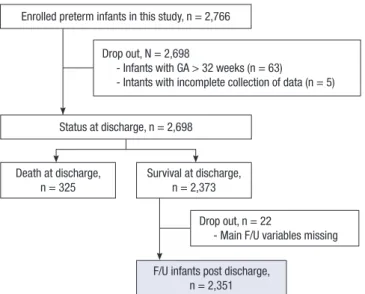
Data collection was performed by the neonatologists of the 44 NICUs retrospectively, with chart review, on the basis of stan- dard study formats and a manual defining the variables. All data were entered electronically into a central database during the study period between August and December 2011. Collected data were checked repeatedly for quality and completeness. In- formation with suspected errors or missing data was fed back to the neonatologists for verification. The mean value and SD of the follow-up duration of total infants after discharge from the NICU was 425 ± 237 days. Cumulative percent of total infants according to follow-up duration after discharge from NICU is shown in Fig. 2. The database was created in collaboration with the Clinical Research Center of Samsung Medical Center on the basis of the electronic case reporting system of Oracle Korea (Oracle Corporation, Seoul, Korea). Data variables were com- posed of baseline characteristics; perinatal and neonatal char- acteristics such as major morbidities in NICU; visits to outpa- Fig. 1. Study population. Among 2,698 infants born at 22-32 weeks’ gestation dis-
charged from the neonatal intensive care unit of 44 Korean hospitals between April 2009 to March 2010, 2,373 infants survived. Excluding 21 infants with incomplete data, 2,35l infants were enrolled.
Enrolled preterm infants in this study, n = 2,766
Status at discharge, n = 2,698 Drop out, N = 2,698
- Infants with GA > 32 weeks (n = 63)
- Intants with incomplete collection of data (n = 5)
Death at discharge,
n = 325 Survival at discharge, n = 2,373
F/U infants post discharge, n = 2,351 Drop out, n = 22
- Main F/U variables missing
Table 1. Perinatal and neonatal characteristics of preterm infants
Characteristics Total infants
n = 2,351
Infants < 30 weeks of GA n = 973
Infants ≥ 30 weeks of GA
n = 1,378 P value*
Gestational age (week) 29+4±2+1 27+2±1+3 31+1±0+5 < 0.001
Birth weight (g) 1,403 ± 413 1,083 ± 275 1,629 ± 338 < 0.001
Male 1,277 (54.3) 508 (52.2) 769 (55.8) 0.085
Inborn 2,182 (92.8) 879 (90.3) 1,303 (94.6) 0.001
Multiple pregnancy 678 (28.8) 265 (27.2) 413 (30.0) 0.152
Antenatal corticosteroid (n = 2,178) 1,578 (72.5) 663 (74.9) 915 (70.8) 0.036
SGA (n = 2,320) 196 (8.4) 74 (7.8) 122 (8.9) 0.363
C/S delivery (n = 2,339) 1,633 (69.8) 693 (72) 940 (68.3) 0.055
Maternal age, yr (n = 2,293) 31.8 ± 4.4 32.0 ± 4.2 31.7 ± 4.5 0.155
Elder siblings (n = 2,269) 1,297 (57.2) 553 (59.5) 744 (55.5) 0.064
Use of surfactant (n = 2,324) 1,299 (55.9) 721 (75.4) 578 (42.3) < 0.001
PDA (n = 2,315) 957 (41.3) 609 (64.0) 348 (25.5) < 0.001
NEC ( ≥ stage 2) (n = 2,314) 104 (4.5) 69 (7.3) 35 (2.6) < 0.001
IVH ( ≥ grade 3) (n = 2,326) 118 (5.1) 89 (9.3) 29 (2.1) < 0.001
Cystic PVL (n = 2,326) 146 (6.3) 98 (10.3) 48 (3.6) < 0.001
ROP ( ≥ stage 2) 373 (16.3) 283 (30.0) 90 (6.7) < 0.001
BPD (n = 2,311) Mild Moderate Severe
681 (29.5) 362 (57.5) 175 (27.8) 93 (14.8)
557 (58.8) 288 (56.0) 142 (27.6) 84 (16.3)
124 (9.1) 74 (63.8) 33 (28.5) 9 (7.8)
< 0.001
Sepsis (n = 2,102) 310 (14.7) 207 (24.2) 103 (8.3) < 0.001
Values are the numbers (%) or mean ± standard deviation. *Fisher’s exact test for categorical variables and independent t-test for continuous variables; 2-sided P values. GA, gestational age; PDA, patent ductus arteriosus; NEC, necrotizing enterocolitis; IVH, intraventricular hemorrhage; PVL, periventricular leukomalacia, ROP, retinopathy of prematu- rity; BPD, bronchopulmonary dysplasia.
Fig. 2. Cumulative percent of follow-up duration of preterm infants after discharge from the neonatal intensive care unit (NICU). Mean value and standard deviation of the duration was 425 ± 237 days.
Cumulative percent (%)
Follow-up duration of preterm infants after discharge from NICU (day)
~90 ~180 ~270 ~360 ~450 ~540 ~630 ~720 ~810 ~900 ~990 ~1,080~1,170 100
80 60 40 20 0
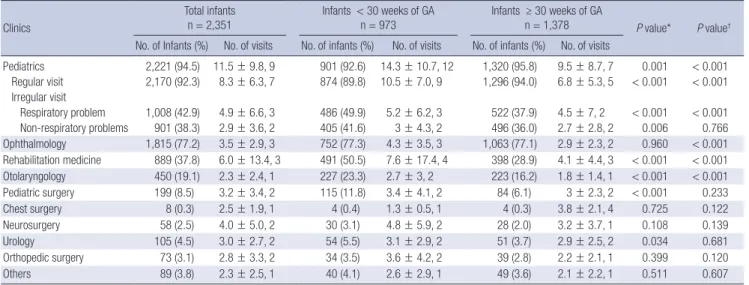
Table 2. Summary of visits to outpatient clinics in preterm infants after discharge from the neonatal intensive care unit (n = 2,351)
Clinics
Total infants n = 2,351
Infants < 30 weeks of GA n = 973
Infants ≥ 30 weeks of GA
n = 1,378 P value* P value†
No. of Infants (%) No. of visits No. of infants (%) No. of visits No. of infants (%) No. of visits
Pediatrics 2,221 (94.5) 11.5 ± 9.8, 9 901 (92.6) 14.3 ± 10.7, 12 1,320 (95.8) 9.5 ± 8.7, 7 0.001 < 0.001 Regular visit 2,170 (92.3) 8.3 ± 6.3, 7 874 (89.8) 10.5 ± 7.0, 9 1,296 (94.0) 6.8 ± 5.3, 5 < 0.001 < 0.001 Irregular visit
Respiratory problem 1,008 (42.9) 4.9 ± 6.6, 3 486 (49.9) 5.2 ± 6.2, 3 522 (37.9) 4.5 ± 7, 2 < 0.001 < 0.001 Non-respiratory problems 901 (38.3) 2.9 ± 3.6, 2 405 (41.6) 3 ± 4.3, 2 496 (36.0) 2.7 ± 2.8, 2 0.006 0.766 Ophthalmology 1,815 (77.2) 3.5 ± 2.9, 3 752 (77.3) 4.3 ± 3.5, 3 1,063 (77.1) 2.9 ± 2.3, 2 0.960 < 0.001 Rehabilitation medicine 889 (37.8) 6.0 ± 13.4, 3 491 (50.5) 7.6 ± 17.4, 4 398 (28.9) 4.1 ± 4.4, 3 < 0.001 < 0.001 Otolaryngology 450 (19.1) 2.3 ± 2.4, 1 227 (23.3) 2.7 ± 3, 2 223 (16.2) 1.8 ± 1.4, 1 < 0.001 < 0.001
Pediatric surgery 199 (8.5) 3.2 ± 3.4, 2 115 (11.8) 3.4 ± 4.1, 2 84 (6.1) 3 ± 2.3, 2 < 0.001 0.233
Chest surgery 8 (0.3) 2.5 ± 1.9, 1 4 (0.4) 1.3 ± 0.5, 1 4 (0.3) 3.8 ± 2.1, 4 0.725 0.122
Neurosurgery 58 (2.5) 4.0 ± 5.0, 2 30 (3.1) 4.8 ± 5.9, 2 28 (2.0) 3.2 ± 3.7, 1 0.108 0.139
Urology 105 (4.5) 3.0 ± 2.7, 2 54 (5.5) 3.1 ± 2.9, 2 51 (3.7) 2.9 ± 2.5, 2 0.034 0.681
Orthopedic surgery 73 (3.1) 2.8 ± 3.3, 2 34 (3.5) 3.6 ± 4.2, 2 39 (2.8) 2.2 ± 2.1, 1 0.399 0.120
Others 89 (3.8) 2.3 ± 2.5, 1 40 (4.1) 2.6 ± 2.9, 1 49 (3.6) 2.1 ± 2.2, 1 0.511 0.607
Values are the numbers (%) or mean ± standard deviation, median. The cases with unknown date were excluded. *Fisher’s exact test; 2-sided P values; †Wilcoxon rank sum test for visiting count difference; two-sided P values. GA, gestational age.
tient pediatric and other departmental clinics; visits to emer- gency centers; and readmission factors including cause of re- admission, need for oxygen and ventilator support. Regular vis- its were defined as pre-scheduled visits for monitoring growth and development or vaccinations, and irregular visits were de- fined as non-scheduled visits for solving various health prob- lems. Readmission was defined as readmission to any hospital when it was stated in the patient’s medical records. Visits to emer- gency centers and outpatient clinics were confined to events at the participating hospital.
Definitions of variables
BPD was defined as the need for supplemental oxygen for at least 28 days after birth and its severity is graded according to the respiratory support required at 36 postmenstrual weeks or discharge whichever comes first (9). NEC was defined as Bell’s stage II or greater (10). Stage III or IV intraventricular hemor- rhage (IVH) (11) and cystic periventricular leukomalacia (PVL)
on cranial ultrasonogram were based upon the Papile grading system. Sepsis was defined according to the Centers for Disease Control and Prevention/National Nosocomial Infection Surveil- lance definitions for infants ≤ 12 months (12).
Statistical analysis
Categorical data are presented as numbers (%), and continu- ous data are presented as the mean ± SD. Fisher’s exact test was used to compare categorical variables and Student t-test or the Wilcoxon rank sum test was used to compare continuous vari- ables according to normality of the data. The readmission rate was estimated by using the Kaplan-Meier product-limit meth- od. To compare the rate of readmission among categorized ges- tational age groups; 25 weeks’ gestation or less, 26-27 weeks’
gestation, 28-29 weeks’ gestation, 30-31 weeks’ gestation, and 32 weeks’ gestation, the log-rank test with Bonferroni’s correc- tion for post hoc testing of pair-wise comparisons was used. All statistical tests were 2-sided and P < 0.05 was considered statis- tically significant. Data were analyzed with SAS software version 9.3 (SAS Institute Inc., Cary, NC, USA).
Ethics statement
This study protocol was reviewed and approved by the institu- tional review board of Samsung Medical Center (IRB No. 2011- 06-032) and another 43 hospitals. Informed consent of their par- ents was waived by the board.
RESULTS
Frequency of visits to outpatient clinic
Of the total infants, 94.5% (2,221/2,351) visited pediatric outpa- tient clinics after discharge from the NICU. Mean value and SD of frequency of visits to the pediatric clinics was 11.5 ± 9.8. Spe-
Table 3. Summary of visits to emergency center in preterm infants after discharge from the neonatal intensive care unit (n = 2,332*) Hospital cares
Total infants n=2,351Infants <30 weeks of GA n=964Infants ≥30 weeks of GA n=1,368 P valuellP value¶ No. of infants (%)No. of visitsNo. of infants (%)No. of visitsNo. of infants (%)No. of visits Total visits to ER725 (31.1)2.1±1.8, 1 (1, 1, 3, 14)334 (34.3)2.3±2.1, 2 (1, 1, 3, 14)391 (28.4)1.9±1.5, 1 (1, 1, 2, 13) 0.0020.027 Need for oxygen†170/1,516 (11.2%)‡103 (13.5)67 (8.9)0.003 Admission†375/1,520 (24.7%)§206 (26.8)169 (22.5) 0.049 Non-respiratory problems288 (39.7)1.6±1.1, 1 (1, 1, 2, 9)121 (36.2)1.7±1.3, 1 (1, 1, 2, 9)167 (42.7)1.6±1, 1 (1, 1, 2, 6) 0.0800.363 Respiratory problems437 (60.3)1.8±1.4, 1 (1, 1, 2, 10)213 (63.8)1.9±1.6, 1 (1, 1, 2, 10)224 (57.3)1.7±1.1, 1 (1, 1, 2, 7) 0.148 RSV related43 (9.8)1.0±0.2, 1 (1, 1, 1, 2)23 (10.8)1±0.2, 1 (1, 1, 1, 2)20 (8.5)1±0, 1 (1, 1, 1, 1)0.4220.389 RSV not related394 (90.2)1.7±1.3, 1 (1, 1, 2, 10)190 (89.2)1.9±1.5, 1 (1, 1, 2, 10)204 (91.1)1.6±1.1, 1 (1, 1, 2, 7)0.225 Values are the mean±standard deviation, median (minimum, 1st quartile, 3rd quartile, maximum) or numbers (%). *The 19 cases with missing value were excluded; †Analysis with all events of visits to ER (n=1,544); ‡The 28 cases with unknown use of oxygen were excluded; §The 24 cases with unknown hospitalization were excluded; IIFisher’s exact test for association of infants frequency between <30 weeks’ gestation and ≥30 weeks’ gestation; ¶Wilcoxon rank sum test for visiting count difference, Fisher’s exact test for visiting event frequency; 2-sided P values. GA, gestational age; ER, emergency room; RSV, respiratory syncytial virus.
cifically, 92.3% of the total infants (2,170/2,351) visited pediatric clinics regularly for check-ups on growth and neurodevelopment or periodic vaccination, 42.9% (1,008/2,351) visited pediatric clinics irregularly for respiratory problems, and 38.3% (901/2,351) visited irregularly for non-respiratory problems (Table 2).
Among the total infants, 77.2% (1,815/2,351) visited ophthal- mology, 37.8% (889/2,351) visited rehabilitation medicine, 19.1%
(450/2,351) visited otolaryngology, and 8.5% (199/2,351) visited pediatric surgery clinics (Table 2).
Compared with infants ≥ 30 weeks’ gestation, infants < 30 weeks’ gestation had more regular visits to pediatric clinics (10.5
± 7.0 vs. 6.8 ± 5.3, P < 0.001) and irregular visits to pediatric clin- ics for respiratory problems (5.2 ± 6.2 vs. 4.5 ± 7.2, P < 0.001) (Table 2).
Visit to emergency center
Of the total infants, 31.1% (725/2,332) visited emergency cen- ters after discharge from the NICU. Mean value and SD of fre- quency of visits to emergency centers was 2.1 ± 1.8.
Specifically, 11.2% (170/1,516) of total visits to emergency centers resulted in the need for oxygen supplementation, and 24.7% (375/1,520) resulted in admission (Table 3); 50.8% (785/
1,544) of emergency visits were due to respiratory problems.
Among the total infants, 12.4% (288/2,332) visited emergency centers for non-respiratory problems and 18.7% (437/2,332) visited emergency centers for respiratory problems. Out of 437 infants who visited emergency centers for respiratory problems, 43 infants (9.8%) were diagnosed with respiratory syncytial vi- rus (RSV) infection (Table 3). RSV accounted for 32.4% of etio- logic viruses that were confirmed on laboratory tests at the time of emergency center visits.
Infants < 30 weeks’ gestation, compared with infants ≥ 30 weeks’ gestation, had more visits to the emergency centers (2.3
± 2.1 vs. 1.9 ± 1.5, P = 0.027), more frequent need for oxygen (103/763 [13.5%] vs. 67/753 [8.9%], P = 0.003), and a higher probability of admission (206/769 [26.8%] vs. 169/761 [22.5%], P = 0.049). However, the number of visits to emergency centers where RSV infection was diagnosed did not differ between the 2 groups (infants < 30 weeks’ gestation vs. infants ≥ 30 weeks’
gestation: 23/964 [2.4%] vs. 20/1,368 [1.5%], P = 0.422) (Table 3).
Readmission
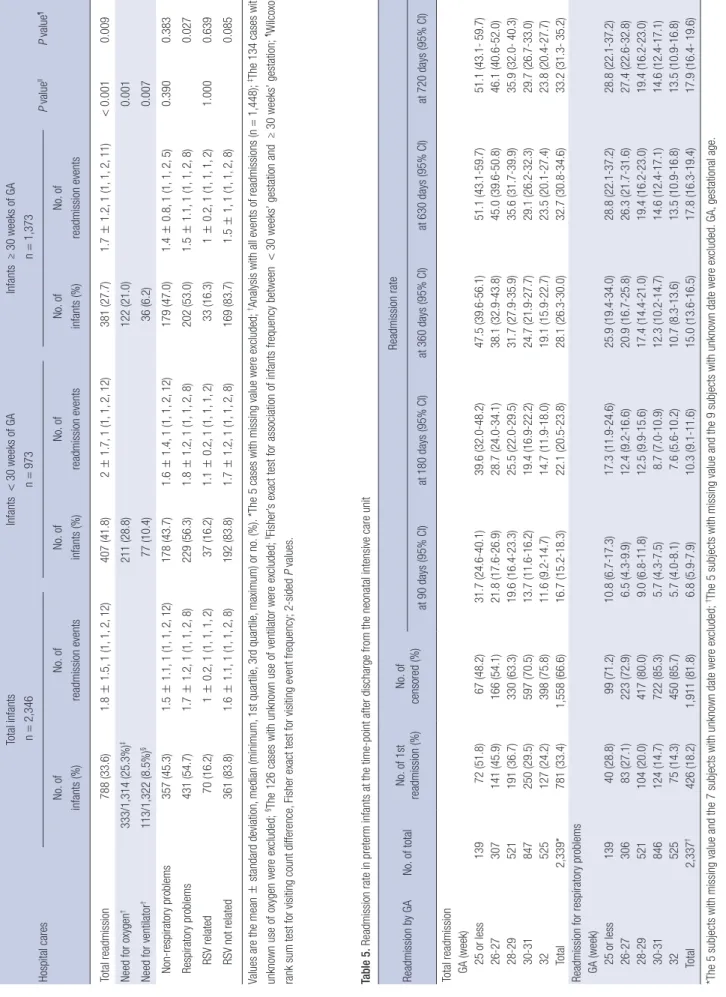
Of total infants, 33.6% (788/2,346) were readmitted at least once, and the mean and SD of frequency of readmissions was 1.8 ± 1.5.
Additionally, 25.3% (333/1,314) of total readmissions needed oxygen supplementation, and 8.5% (113/1,322) needed ventila- tor care (Table 4).
18.4% (431/2,346) of the total infants were readmitted with respiratory problems at least once, and the mean and SD of fre- quency of readmissions was 1.7 ± 1.2. Specifically, 3% (70/2,346) of total infants were diagnosed with RSV infection (Table 4). Out
Table 4. Summary of readmission in preterm infants after discharge from the neonatal intensive care unit (n = 2,346*) Hospital cares
Total infants n=2,346Infants <30 weeks of GA n=973Infants ≥30 weeks of GA n=1,373 P valuellP value¶ No. of infants (%)No. of readmission eventsNo. of infants (%)No. of readmission eventsNo. of infants (%)No. of readmission events Total readmission788 (33.6)1.8±1.5, 1 (1, 1, 2, 12)407 (41.8)2±1.7, 1 (1, 1, 2, 12)381 (27.7)1.7±1.2, 1 (1, 1, 2, 11)<0.0010.009 Need for oxygen†333/1,314 (25.3%)‡211 (28.8)122 (21.0)0.001 Need for ventilator†113/1,322 (8.5%)§77 (10.4)36 (6.2)0.007 Non-respiratory problems357 (45.3)1.5±1.1, 1 (1, 1, 2, 12)178 (43.7)1.6±1.4, 1 (1, 1, 2, 12)179 (47.0)1.4±0.8, 1 (1, 1, 2, 5)0.3900.383 Respiratory problems431 (54.7)1.7±1.2, 1 (1, 1, 2, 8)229 (56.3)1.8±1.2, 1 (1, 1, 2, 8)202 (53.0)1.5±1.1, 1 (1, 1, 2, 8)0.027 RSV related70 (16.2)1±0.2, 1 (1, 1, 1, 2)37 (16.2)1.1±0.2, 1 (1, 1, 1, 2)33 (16.3)1±0.2, 1 (1, 1, 1, 2)1.0000.639 RSV not related361 (83.8)1.6±1.1, 1 (1, 1, 2, 8)192 (83.8)1.7±1.2, 1 (1, 1, 2, 8)169 (83.7)1.5±1, 1 (1, 1, 2, 8)0.085 Values are the mean±standard deviation, median (minimum, 1st quartile, 3rd quartile, maximum) or no. (%). *The 5 cases with missing value were excluded; †Analysis with all events of readmissions (n=1,448); ‡The 134 cases with unknown use of oxygen were excluded; §The 126 cases with unknown use of ventilator were excluded; IIFisher’s exact test for association of infants frequency between <30 weeks’ gestation and ≥30 weeks’ gestation; ¶Wilcoxon rank sum test for visiting count difference, Fisher exact test for visiting event frequency; 2-sided P values. Table 5. Readmission rate in preterm infants at the time-point after discharge from the neonatal intensive care unit Readmission by GANo. of totalNo. of 1st readmission (%)No. of censored (%)
Readmission rate at 90 days (95% CI)at 180 days (95% CI)at 360 days (95% CI)at 630 days (95% CI)at 720 days (95% CI) Total readmission GA (week) 25 or less13972 (51.8)67 (48.2)31.7 (24.6-40.1)39.6 (32.0-48.2)47.5 (39.6-56.1)51.1 (43.1-59.7)51.1 (43.1- 59.7) 26-27307141 (45.9)166 (54.1)21.8 (17.6-26.9)28.7 (24.0-34.1)38.1 (32.9-43.8)45.0 (39.6-50.8)46.1 (40.6-52.0) 28-29521191 (36.7)330 (63.3)19.6 (16.4-23.3)25.5 (22.0-29.5)31.7 (27.9-35.9)35.6 (31.7-39.9)35.9 (32.0- 40.3) 30-31847250 (29.5)597 (70.5)13.7 (11.6-16.2)19.4 (16.9-22.2)24.7 (21.9-27.7)29.1 (26.2-32.3)29.7 (26.7-33.0) 32525127 (24.2)398 (75.8)11.6 (9.2-14.7)14.7 (11.9-18.0)19.1 (15.9-22.7)23.5 (20.1-27.4)23.8 (20.4-27.7) Total2,339*781 (33.4)1,558 (66.6)16.7 (15.2-18.3)22.1 (20.5-23.8)28.1 (26.3-30.0)32.7 (30.8-34.6)33.2 (31.3- 35.2) Readmission for respiratory problems GA (week) 25 or less13940 (28.8)99 (71.2)10.8 (6.7-17.3)17.3 (11.9-24.6)25.9 (19.4-34.0)28.8 (22.1-37.2)28.8 (22.1-37.2) 26-2730683 (27.1)223 (72.9)6.5 (4.3-9.9)12.4 (9.2-16.6)20.9 (16.7-25.8)26.3 (21.7-31.6)27.4 (22.6-32.8) 28-29521104 (20.0)417 (80.0)9.0 (6.8-11.8)12.5 (9.9-15.6)17.4 (14.4-21.0)19.4 (16.2-23.0)19.4 (16.2-23.0) 30-31846124 (14.7)722 (85.3)5.7 (4.3-7.5)8.7 (7.0-10.9)12.3 (10.2-14.7)14.6 (12.4-17.1)14.6 (12.4-17.1) 3252575 (14.3)450 (85.7)5.7 (4.0-8.1)7.6 (5.6-10.2)10.7 (8.3-13.6)13.5 (10.9-16.8)13.5 (10.9-16.8) Total2,337†426 (18.2)1,911 (81.8)6.8 (5.9-7.9)10.3 (9.1-11.6)15.0 (13.6-16.5)17.8 (16.3-19.4)17.9 (16.4- 19.6) *The 5 subjects with missing value and the 7 subjects with unknown date were excluded; †The 5 subjects with missing value and the 9 subjects with unknown date were excluded. GA, gestational age.
of the infants who were readmitted with respiratory problems, 83.9% (362/431) of them had laboratory tests done for confirm- ing RSV infection, and RSV accounted for 30.3% of etiologic vi- ruses that were confirmed with laboratory tests at the time of readmission.
Infants < 30 weeks’ gestation, compared with infants ≥ 30 weeks’ gestation, had a higher frequency of total readmissions (2 ± 1.7 vs. 1.7 ± 1.2, P = 0.009) and readmissions for respiratory problems (1.8 ± 1.2 vs. 1.5 ± 1.1, P = 0.027), need for oxygen supplementation (211/733 [28.8%] vs. 122/581 [21.0%], P = 0.001), and need for ventilator support (77/741 [10.4%] vs. 36/
581 [6.2%], P = 0.007). However, the number of readmitted in- fants diagnosed with RSV infection did not differ between the 2 groups (infants < 30 weeks’ gestation vs. infants ≥ 30 weeks’
gestation: 37/964 [3.8%] vs. 33/1,368 [2.4%], P = 1.000) (Table 4).
In the first 360 days after discharge from the NICU, 28.1% of total infants were readmitted, and 15.0% of them were readmit- ted for respiratory problems. At 720 days, 33.2% of total infants had been readmitted and 17.9% of them were readmitted for respiratory problems (Table 5). The younger the gestational age at birth, the higher the probability of total readmissions and re- admissions for respiratory problems (log-rank test for trend P < 0.001; Fig. 3). Infants born at 25 or less, and 26-27 weeks’
gestation had a significantly higher probability of total readmis- sions and readmissions for respiratory problems following dis- charge from the NICU than infants 30-31, and 32 weeks’ gesta- tion (Fig. 3A and B). Infants born at 28-29 weeks’ gestation had a significantly higher probability of total readmissions following discharge from the NICU than infants 30-31, and 32 weeks’ ges- tation but did not have a higher probability of readmissions for respiratory problems than infants 30-31, and 32 weeks’ gesta- tion (Fig. 3A and B). Readmission rates at the time-point after discharge from the NICU and their 95% confidence intervals
Fig. 3. Days to first readmission following discharge from the neonatal intensive care unit (NICU). The younger the gestational age at birth, the higher the probability of total re- admissions and readmissions for respiratory problems (log-rank test for trend P < 0.001). Kaplan-Meier curves are shown for total readmission (A) and readmission for respira- tory problems (B). *Means a significantly higher probability of readmissions following discharge from the NICU, compared with infants 30-31, and 32 weeks’ gestation (Pair-wise comparison, P < 0.05).
A B
Gestational age (week) 25 or less
28-29 32
26-27 30-31
Gestational age (week) 25 or less
28-29 32
26-27 30-31
Cumulative probability of readmission
0 30 90 180 270 360 450 540 630 720 810 900 1.0
0.8
0.6
0.4
0.2
0
Log-rank test for trend, P value < 0.001
Cumulative probability of readmission due to respiratory causes Time to the 1st readmission after NICU
discharge (day)
Time to the 1st readmission due to respiratory causes after NICU discharge (day)
0 30 90 180 270 360 450 540 630 720 810 900 1.0
0.8
0.6
0.4
0.2
0
Log-rank test for trend, P value < 0.001
are shown in Table 5.
Of the total infants, 0.6% (14/2,351) was reported as mortality cases. Of the total mortalities, 78.6% (11/14) occurred within 12 months after discharge from the NICU.
DISCUSSION
Of the total infants in this study, 33.6% required at least 1 episo- de of readmission. Ralser et al. (4) reported that 40.1% and 24.7%
of preterm infants born at < 32 weeks’ gestation were readmit- ted in the first and second years of life, respectively. Underwood et al. (3) also reported that 15% of preterm infants < 36 weeks’
gestation were readmitted at least once in the first year of life.
Considering the differences in enrollment of criteria and fol- low-up duration with these studies, the rates of readmission in this study were similar to those in previous studies.
Of the total infants, 18.4% were readmitted with respiratory problems at least once, and respiratory problems were the most common cause for readmission. Resch et al. (13) reported that 14% of preterm infants born at 29-36 weeks’ gestation were re- admitted because of respiratory problems during the first 2 yr of life. Rasler et al. (4) reported that the leading cause of read- mission was respiratory infection, accounting for 42.1% and 47.4% of total readmissions in the first and second years of life, respectively. A similar trend was observed for respiratory read- missions in this study.
The readmission rate for RSV infection was 3% in this study.
The readmission rate for RSV in Korea has been reported to be approximately 3.1%-9.3% (14-17). The readmission rate for RSV in Korea for those studies as well as ours could be underestimat- ed because of limited indications for laboratory tests to prove viral etiologies taking into consideration health insurance cov- erage. Readmission rates for RSV in preterm infants following
*
* *
* *
discharge from the NICU have varied widely, from 2.7 to 37%
(18-22). This could be a result of differences in the study popu- lations and criteria in each study. Although younger gestational age is known to be a risk factor of readmission for RSV in pre- term infants (23-26), no difference in readmission rate for RSV between infants ≥ 30 weeks’ gestation and infants < 30 weeks’
gestation observed in this study. In previous studies, palivizum- ab prophylaxis reduced severe RSV infection and readmission for RSV in preterm infants with BPD (24,27-29). Therefore, vari- ations in readmission rates for RSV in preterm infants might have resulted from palivizumab prophylaxis during the study period as it was indicated for infants diagnosed with BPD with- in 6 months and less than 2 yr of life at the beginning of RSV sea- son in Korea. In this study, RSV was the most common confirm- ed virus at the time of readmission and other respiratory viruses including rhinovirus, parainfluenza, influenza, and adenovirus were also confirmed in some cases. Drysdale et al. (30) also re- ported that RSV related lower respiratory tract infection (LRTI) was associated with increased readmission and other viral eti- ologies of LRTI were enterovirus, parainfluenza, adenovirus, human metapneumovirus, parechovirus, human bocavirus, and influenza.
Among total infants in our study, 31.1% visited emergency centers at least once and 24.7% of all emergency visits resulted in readmission, with 50.8% of those visits being due to respira- tory problems. Rhein et al. (5) reported that 22.2% of infants born at < 32 weeks’ gestation visited the emergency centers during the first year of life. In contrast to our study, most of the visits were due to respiratory problems. This divergence might have resulted from differences in the study populations and criteria for follow-up at high-risk pulmonary or neurodevelop- mental clinics in that study.
In this study, many preterm infants visited various outpatient clinics, such as pediatrics, ophthalmology, rehabilitation medi- cine, otolaryngology, and pediatric surgery clinics. Among the total infants, 42.9% visited pediatric clinics irregularly for respi- ratory problems, and 38.3% visited irregularly for non-respira- tory problems. Infants < 30 weeks’ gestation had more regular visits to the pediatric clinic as well as more irregular visits for re- spiratory problems than infants ≥ 30 weeks’ gestation. Gray et al. (31) reported that very preterm infants < 32 weeks’ gestation and/or had birth weight < 1,500 g, had higher rate of visits to an outpatient clinic for special health care over the first 2 yr than full term infants. Korvenranta et al. (32) reported that the num- ber of visits to an outpatient clinic during the first 3 yr of life de- creased with increasing gestational age at birth in the very pre- term infants < 32 weeks’ gestation or in those who had a birth weight of < 1,501 g.
This study had some limitations, such as variable duration of post-discharge follow-up, absence of consideration of long-term complications, and retrospective design. Nevertheless, it has value
as the first nation-wide study on the use of medical resources by preterm infants after discharge from the NICU in Korea. There- fore, further prospective studies on this subject are indicated.
The use of medical resources, such as outpatient clinics, emer- gency centers, and readmission, was common in this study pop- ulation. Respiratory problems were the leading cause for the use of medical resources following discharge from the NICU.
Total readmissions and readmissions for respiratory problems were more frequent in infants < 30 weeks’ gestation, than in in- fants ≥ 30 weeks’ gestation. However, the frequency of readmis- sions for RSV infection was not different between the 2 groups.
Therefore, optimal strategies to manage the use of medical re- sources are necessary in preterm infants after discharge from NICU.
ACKNOWLEDGMENTS
We thank Hae Sook Bok, Sun Hee Kim for the development of case report form, and validation of data. We thank Hye Kyoung Yoon, Jung Eun Kim, Seon Woo Kim for statistical analysis and Ye Kyuong Kwon for the development of the electronic case re- porting system. We express our profound gratitude to the physi- cians of the institutions participated in this study. These institu- tions were as follows: Ajou University Hospital, Asan Medical Center, Boramae Medical Center, Bundang Cha Hospital, Busan National University Hospital, Busan National University Chil- dren’s Hospital, Gachon University Gil Medical Center, Cheil General Hospital & Women’s Healthcare Center, Chonbuk Na- tional University Hospital, Chonnam National University Hos- pital, Chungnam National University Hospital, Daegu Fatima Hospital, Eulji University Hospital, Dankook University Hospi- tal, Dong-A University Hospital, Dongguk University Ilsan Hos- pital, Ewha Woman’s University Mokdong Hospital, Gangneung Asan Hospital, Good Moonhwa Hospital, Gyeongsang National University Hospital, Hallym University Kangnam Sacred Heart Hospital, Hanyang University Guri Hospital, Inje University Bu- san-Paik Hospital, Inje University Ilsan-Paik Hospital, Inje Uni- versity Sanggye-Paik Hospital, Jeju National University Hospi- tal, Kangnam Cha Hospital, Kangwon National University Hos- pital, Keimyung University Dongsan Medical Center, Konkuk University Medical Center, Korea University Ansan Hospital, Kosin University Gospel Hospital, Kyunghee University Medi- cal Center at Gangdong, Kyungpook National University Hospi- tal, Samsung Changwon Hospital, Samsung Medical Center, Seoul National University Bundang Hospital, Seoul National University Children’s Hospital, Seoul St. Mary’s Hospital of the Catholic University, Soon Chun Hyang University Cheonan Hospital, St. Mary’s Hospital of the Catholic University, Yonsei University Gangnam Severance Hospital, Yonsei University Sev- erance Hospital and Yonsei University Wonju Christian Hospital.
DISCLOSURE
All of the authors have no conflicts of interest to disclose.
AUTHOR CONTRIBUTION
Conception and design of the study: Lee JH, Chang YS. Acquisi- tion of data: Lee JH. Statistical analysis: Lee JH, Chang YS. First Draft of the manuscript: Lee JH. Revision and critical review of the manuscript: Lee JH, Chang YS.
ORCID
Jang Hoon Lee http://orcid.org/0000-0003-4765-9948 Yun Sil Chang http://orcid.org/0000-0001-9201-2938 REFERENCES
1. Wilson-Costello D, Friedman H, Minich N, Fanaroff AA, Hack M. Im- proved survival rates with increased neurodevelopmental disability for extremely low birth weight infants in the 1990s. Pediatrics 2005; 115: 997- 1003.
2. Petrou S, Sach T, Davidson L. The long-term costs of preterm birth and low birth weight: results of a systematic review. Child Care Health Dev 2001; 27: 97-115.
3. Underwood MA, Danielsen B, Gilbert WM. Cost, causes and rates of re- hospitalization of preterm infants. J Perinatol 2007; 27: 614-9.
4. Ralser E, Mueller W, Haberland C, Fink FM, Gutenberger KH, Strobl R, Kiechl-Kohlendorfer U. Rehospitalization in the first 2 years of life in children born preterm. Acta Paediatr 2012; 101: e1-5.
5. Rhein LM, Konnikova L, McGeachey A, Pruchniewski M, Smith VC.
The role of pulmonary follow-up in reducing health care utilization in infants with bronchopulmonary dysplasia. Clin Pediatr (Phila) 2012;
51: 645-50.
6. Petrou S, Mehta Z, Hockley C, Cook-Mozaffari P, Henderson J, Golda- cre M. The impact of preterm birth on hospital inpatient admissions and costs during the first 5 years of life. Pediatrics 2003; 112: 1290-7.
7. Chien YH, Tsao PN, Chou HC, Tang JR, Tsou KI. Rehospitalization of extremely-low-birth-weight infants in first 2 years of life. Early Hum Dev 2002; 66: 33-40.
8. Heo YH, Lee YJ, Lee WS, Chung SH, Choi YS, Lee KS, Chang JY, Bae CW. Survival outcome of neonatal intensive care units in Korea by ges- tational age (2002-2009). J Korean Soc Neonatol 2012; 19: 134-9.
9. Jobe AH, Bancalari E. Bronchopulmonary dysplasia. Am J Respir Crit Care Med 2001; 163: 1723-9.
10. Walsh MC, Kliegman RM. Necrotizing enterocolitis: treatment based on staging criteria. Pediatr Clin North Am 1986; 33: 179-201.
11. Papile LA, Burstein J, Burstein R, Koffler H. Incidence and evolution of subependymal and intraventricular hemorrhage: a study of infants with birth weights less than 1,500 gm. J Pediatr 1978; 92: 529-34.
12. Garner JS, Jarvis WR, Emori TG, Horan TC, Hughes JM. CDC definitions for nosocomial infections, 1988. Am J Infect Control 1988; 16: 128-40.
13. Resch B, Pasnocht A, Gusenleitner W, Müller W. Rehospitalisations for
respiratory disease and respiratory syncytial virus infection in preterm infants of 29-36 weeks gestational age. J Infect 2005; 50: 397-403.
14. Park HW, Lee BS, Kim AR, Yoon HS, Kim BI, Song ES, Kim WT, Lim J, Kim S, Jin HS, et al. Epidemiology of respiratory syncytial virus infection in infants born at less than thirty-five weeks of gestational age. Pediatr Infect Dis J 2012; 31: e99-104.
15. Chang SG, Park MS, Yu JE. Outcomes of palivizumab prophylaxis for re- spiratory syncytial virus infection in preterm children with bronchopul- monary dysplasia at a single hospital in Korea from 2005 to 2009. J Ko- rean Med Sci 2010; 25: 251-6.
16. Park SK, Jung YJ, Yoo HS, Ahn SY, Seo HJ, Choi SH, Kim MJ, Jeon GW, Koo SH, Lee KH, et al. Effect of Synagis® (palivizumab) prophylaxis on readmission due to respiratory syncytial virus in very low birth weight infants. Korean J Pediatr 2010; 53: 358-63.
17. Kim SJ, Chae SH, Lee JH, Kim YJ, Koo SH, Jeon GW, Chang YS, Park WS.
Rehospitalization of very low birth weight infants in the first year after discharge from NICU and risk factor of rehospitalization caused by re- spiratory illness. J Korean Soc Neonatol 2006; 13: 17-23.
18. Groothuis JR, Gutierrez KM, Lauer BA. Respiratory syncytial virus infec- tion in children with bronchopulmonary dysplasia. Pediatrics 1988; 82:
199-203.
19. Groothuis JR, Simoes EA, Hemming VG. Respiratory syncytial virus (RSV) infection in preterm infants and the protective effects of RSV im- mune globulin (RSVIG). Respiratory Syncytial Virus Immune Globulin Study Group. Pediatrics 1995; 95: 463-7.
20. The PREVENT Study Group. Reduction of respiratory syncytial virus hospitalization among premature infants and infants with bronchopul- monary dysplasia using respiratory syncytial virus immune globulin prophylaxis. Pediatrics 1997;99:93-9.
21. Wang EE, Law BJ, Robinson JL, Dobson S, al Jumaah S, Stephens D, Bou- cher FD, McDonald J, Mitchell I, MacDonald NE. PICNIC (Pediatric In- vestigators Collaborative Network on Infections in Canada) study of the role of age and respiratory syncytial virus neutralizing antibody on re- spiratory syncytial virus illness in patients with underlying heart or lung disease. Pediatrics 1997; 99: E9.
22. Nachman SA, Navaie-Waliser M, Qureshi MZ. Rehospitalization with respiratory syncytial virus after neonatal intensive care unit discharge: A 3-year follow-up. Pediatrics 1997; 100: E8.
23. Carbonell-Estrany X, Quero J, Bustos G, Cotero A, Doménech E, Figuer- as-Aloy J, Fraga JM, García LG, García-Alix A, Del Río MG, et al. Rehos- pitalization because of respiratory syncytial virus infection in premature infants younger than 33 weeks of gestation: a prospective study. IRIS Study Group. Pediatr Infect Dis J 2000; 19: 592-7.
24. Carbonell-Estrany X, Quero J; IRIS Study Group. Hospitalization rates for respiratory syncytial virus infection in premature infants born during two consecutive seasons. Pediatr Infect Dis J 2001; 20: 874-9.
25. Pedraz C, Carbonell-Estrany X, Figueras-Aloy J, Quero J, IRIS Study Group.
Effect of palivizumab prophylaxis in decreasing respiratory syncytial vi- rus hospitalizations in premature infants. Pediatr Infect Dis J 2003; 22:
823-7.
26. Joffe S, Escobar GJ, Black SB, Armstrong MA, Lieu TA. Rehospitaliza- tion for respiratory syncytial virus among premature infants. Pediatrics 1999; 104: 894-9.
27. Palivizumab, a humanized respiratory syncytial virus monoclonal anti- body, reduces hospitalization from respiratory syncytial virus infection
in high-risk infants. Pediatrics 1998; 102: 531-7.
28. Parnes C, Guillermin J, Habersang R, Nicholes P, Chawla V, Kelly T, Fish- bein J, McRae P, Goessler M, Gatti A, et al. Palivizumab prophylaxis of respiratory syncytial virus disease in 2000-2001: results from The Palivi- zumab Outcomes Registry. Pediatr Pulmonol 2003; 35: 484-9.
29. Oh PI, Lanctôt KL, Yoon A, Lee DS, Paes BA, Simmons BS, Parison D, Manzi P; Composs Investigators. Palivizumab prophylaxis for respira- tory syncytial virus in Canada: utilization and outcomes. Pediatr Infect Dis J 2002; 21: 512-8.
30. Drysdale SB, Alcazar-Paris M, Wilson T, Smith M, Zuckerman M, Pea-
cock JL, Johnston SL, Greenough A. Viral lower respiratory tract infec- tions and preterm infants’ healthcare utilisation. Eur J Pediatr 2015; 174:
209-15.
31. Gray D, Woodward LJ, Spencer C, Inder TE, Austin NC. Health service utilisation of a regional cohort of very preterm infants over the first 2 years of life. J Paediatr Child Health 2006; 42: 377-83.
32. Korvenranta E, Lehtonen L, Peltola M, Häkkinen U, Andersson S, Gissler M, Hallman M, Leipälä J, Rautava L, Tammela O, et al. Morbidities and hospital resource use during the first 3 years of life among very preterm infants. Pediatrics 2009; 124: 128-34.