Vol. 18, No. 2 pp. 549-558, 2017
Effects of Aerobic Exercise on Serum Blood Lipids, Leptin, Ghrelin, and HOMA-IR Factors in Postmenopausal Obese Women
Jeong-Ah Lee
1, Ji-Hyeon Kim
2, Jong-Won Kim
3, Do-Yoen Kim
2*1Physical Education, Kyungsung University
2Physical Education, Pusan National University
3Physical Education, Busan National University of Education
유산소 운동이 폐경 후 비만여성의 혈청지질, 렙틴, 그렐린 및 인슐린저항성지수에 미치는 영향
이정아1, 김지현2, 김종원3, 김도연2*
1경성대학교 체육학과, 2부산대학교 체육교육과, 3부산교육대학교 체육교육과
Abstract The aim of this study was to analyze the effects of aerobic exercise on the blood lipids, leptin, ghrelin, and HOMA-IR factors in obese postmenopausal Korean women. Thirty-six healthy postmenopausal women (mean age, 54.47 ± 2.50 years) with >32 % body fat were assigned randomly to an aerobic exercise group (n = 18) or to a "no exercise" control group (n = 18). The subjects' body composition, blood lipid, leptin, ghrelin levels, and HOMA-IR were measured before and after a 16-week line-dancing program. The exercise group showed a significant decrease in body weight, percent body fat, body mass index, visceral fat area, leptin, insulin, glucose, HOMA-IR, total cholesterol, triglycerides, apolipoprotein B, low-density lipoprotein cholesterol, and systolic and diastolic blood pressure. In addition, this group exhibited a significant increase in the apolipoprotein A-I, ghrelin, and high-density lipoprotein cholesterol levels. The energy metabolic factors that influenced the visceral fat included ghrelin, leptin, insulin, glucose, and HOMA-IR. The t-value, which determined the statistical significance of the independent variables, was significant for ghrelin, glucose, insulin, and HOMA-IR (p < 0.05). Regular and continuous aerobic exercise (e.g., line dancing) effectively improved the body composition, visceral fat, serum blood lipids, leptin, ghrelin, and HOMA-IR factors in obese postmenopausal Korean women.
요 약 본 연구는 체지방률이 32% 이상인 폐경 후 비만여성 36명을 대상으로 유산소운동이 혈청지질, 렙틴, 그렐린 및 인슐린저항성지수에 미치는 영향을 구명하기 위하여 운동집단(18명)과 통제집단(18명)으로 나누어 유산소운동인 라인댄스를 16주간 실시한 후 체조성, 혈청지질, 렙틴, 그렐린 및 인슐린저항성지수를 운동전과 후로 측정하여 비교분석하였다. 본 연구 의 결과 운동 후에 운동집단에서 체중, 체지방률(%BF), 체질량지수(BMI), 내장지방면적(VFA), 렙틴(Leptin), 인슐린(Insulin), 글루코스(Glucose), 인슐린저항성지수(HOMA-IR), 총콜레스테롤(TC), 중성지방(TG), 아포리포프로틴(Apolipoprotein) B, 저 밀도지단백 콜레스테롤(LDL-C) 및 수축기혈압(SBP)이 유의하게 감소하였다. 또한 아포리포프로틴(Apolipoprotein) A-1, 그렐 린(Ghrelin) 및 고밀도지단백 콜레스테롤(HDL-C)이 유의하게 증가하였다. 유산소운동집단의 내장지방면적에 영향을 미치는 에너지대사조절인자의 회귀분석결과에서 주요요인으로 그렐린, 인슐린, 글루코스 및 HOMA-IR 나타났다. 따라서 규칙적이 고 지속적인 유산소운동이 폐경 후 비만여성의 체조성, 내장지방, 혈청지질, 렙틴, 그렐린 및 HOMA-IR을 개선시키는 데 효 과가 있을 것으로 생각된다.
Keywords : line dance, ghrelin, leptin, HOMA-IR
“This work was supported by a 2-Year Research Grant of Pusan National University”
*Corresponding Author : Do-Yeon Kim(Pusan National University) Tel: +82-51-510-2718 email: [email protected]
Received November 15, 2016 Accepted February 3, 2017
Revised (1st December 26, 2016, 2nd January 16, 2017) Published February 28, 2017
1. Introduction
In Korea, recent economic growth, the acceleration of industrialization, and the information age have contributed to the westernization of the Korean lifestyle. As a result, the incidence of obesity and hypokinetic diseases has rapidly increased, due to factors such as excessive nutrient intake and a lack of physical activity. Therefore, the risk of obesity-related diseases, such as diabetes, heart disease, hyperlipidemia, hypertension, and atherosclerosis, has rapidly risen among all age groups. The increase in obesity among middle-aged women is likely to cause various chronic diseases, making obesity in this age group a serious social issue[1].
Various adipocytokines and fat hormones that are secreted from adipocytes are reportedly involved in metabolic diseases[2], such as metabolic syndrome and insulin resistance. In particular, ghrelin and leptin are known to be mutually antagonistic in energy homeostasis[3]. The weight control mechanisms of the human body are divided into the afferent signals (which are created in fatty tissues and send signals to the brain), the efferent signals (which allow the hypothalamus to respond to the afferent signals), intake behaviors and energy consumption (which respond to signals from the brain), and the fatty tissues (in which energy is absorbed and stored). As none of these components can act alone, given their interconnected nature, the body can regulate its energy intake and consumption, thereby maintaining homeostasis and a constant weight[4].
Ghrelin (the appetite-promoting hormone that is secreted by the stomach) and leptin (the appetite-suppressing hormone that is secreted by adipocytes) both play an important role in appetite control by acting antagonistically in the arcuate nucleus of the hypothalamus[5]. In cases of obesity or rapid weight gain, it has been reported that serum levels of ghrelin decrease with a concomitant increase in serum levels of leptin. In contrast, during long-term fasting or
weight loss, serum levels of ghrelin increase while serum levels of leptin decrease[6-8]. In addition, greater insulin resistance is associated with increased fasting insulin levels, and the association is stronger during normal glycometabolism, where the increased secretion of insulin serves to normalize the levels of glucose and free fatty acids (FFA) during fasting or glucose loading[9].
Line dancing is an activity in which many people form lines and proceed to dance. The popularity of this form of dancing has steadily increased, establishing it as a common healthy leisure activity among middle-aged women[10]. Unfortunately, the number of obese women increases with age, doubling the number of obese men among persons aged >55 years, although research regarding energy balance after menopause is relatively scarce[11]. Regular and continuous line dance exercise will be effective for preventing the lifestyle diseases with improvement of the energy metabolic factors and insulin resistance by decreasing the body fat. Moreover, little is known regarding the role of leptin and ghrelin in obese postmenopausal Korean women. Therefore, we designed this study to investigate the effects of aerobic exercise on leptin, ghrelin, blood lipids, and HOMA-IR factors in obese postmenopausal Korean women.
2. Methods
2.1 Participants
This study evaluated obese postmenopausal residents of metropolitan Busan, Korea, who had >32% body fat and volunteered to participate in the study. The 38 women were screened for no history of disease, no current special conditions, and no regular exercise.
Participants were grouped into 20 persons who would participate in exercise and 18 persons who chose not to participate in exercise. The data from 36 participants were analyzed (18 persons from each group), after excluding 2 subjects who did not participate in the
exercise consistently and whose test results were not reliable. All participants provided their written informed consent prior to participation, and ethical approval was granted by our Institutional Human Research Committee.
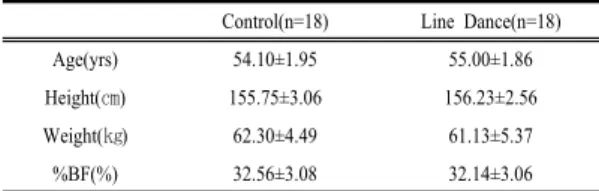
Table 1. Physical characteristics of subjects Control(n=18) Line Dance(n=18)
Age(yrs) 54.10±1.95 55.00±1.86
Height(㎝) 155.75±3.06 156.23±2.56
Weight(㎏) 62.30±4.49 61.13±5.37
%BF(%) 32.56±3.08 32.14±3.06
Values are means±SD
2.2 Study design
The nature, purpose, and experimental procedures were explained verbally to each participant, who then signed an informed consent form before participating in the study. The participants were tested at the same time of day (in the morning), to avoid any diurnal variation in temperature. Participants were instructed to not exercise and to obtain from caffeine or alcohol on the day before, or day of, testing. At their initial visit, subject examinations included a standardized health questionnaire, anthropometry and body composition, resting blood pressure, and fasting venous blood sampling for blood chemistry. After their baseline measurements, participants were randomized into a line dancing exercise group (n = 18) or a “no exercise”
control group (n = 18) for the 16-week duration of the study.
2.3 Body composition and anthropometric assessment
Blood pressure readings were performed after at least 10 min of resting in the supine position in a quiet environment. Height was measured, with the participant barefoot, to the nearest 0.1 cm, and body weight was measured to the nearest 0.1 kg with the participant wearing light clothing. Body mass index (BMI) was calculated as weight in kilograms divided by the square of height in meters[12]. Body composition (including
overall body fat mass, lean body mass, and visceral fat area [VFA]) was analyzed at the beginning and end of each phase of the study, using the bioelectrical impedance analysis method (Inbody 720; Biospace, Seoul, Korea) and following the procedures recommended by the American College of Sports Medicine[13].
2.4 Blood sampling
Venous blood samples were drawn between 8 AM and 10 AM after a 12-h overnight fast, and the serum samples were separated and stored at –70°C. Using these serum samples, concentrations of glucose, total cholesterol (TC), triglycerides (TG), high-density lipoprotein cholesterol (HDL-C), and low-density lipoprotein cholesterol (LDL-C) were measured using a Toshiba TBA 200FR NEO analyzer (Diamond Diagnostics, Inc., Holliston, MA, USA). Apolipoprotein A-I and apolipoprotein B were analyzed by kinetic immunoturbidimetry on a Hitachi auto-analyzer, model 705. Fasting concentrations of insulin, leptin, and ghrelin were measured using an insulin kit (Coat-A-count Insulin, DPC, USA) and γ-counter (COBRA 5010 Quantum, PACKARD, USA). The index of insulin resistance was assessed using the HOMA-IR equation, where HOMA-IR = [fasting insulin (μU/mL) × fasting glucose (mmol/L)]/22.5[14].
2.5 Aerobic exercise program
The line dancing program was a 16-week beginner-level program that took place 3× per week, in 60 min sessions. Each session was composed of a 10-min warm-up, 40 min of dance, and 10 min of wrap-up, which gradually increased in intensity from the adjustment stage (weeks 1–4, maximum heart rate [MHR]: 50–60%), to the improvement stage (weeks 5 –8, MHR: 60–70%) and the advanced stage (weeks 9 –12, MHR: 70–80%). The program was designed for general health promotion, and the intensity of physical activity was considered moderate. Wireless heart rate monitors (worn by all participants) were used to
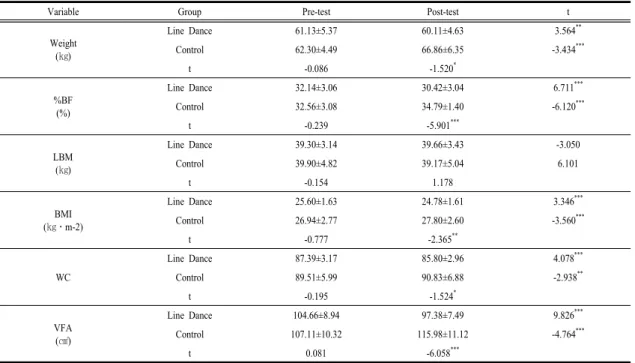
Table 2. Changes in body composition after 16-week Line Dancing exercise
Variable Group Pre-test Post-test t
Weight (㎏)
Line Dance 61.13±5.37 60.11±4.63 3.564**
Control 62.30±4.49 66.86±6.35 -3.434***
t -0.086 -1.520*
%BF (%)
Line Dance 32.14±3.06 30.42±3.04 6.711***
Control 32.56±3.08 34.79±1.40 -6.120***
t -0.239 -5.901***
LBM (㎏)
Line Dance 39.30±3.14 39.66±3.43 -3.050
Control 39.90±4.82 39.17±5.04 6.101
t -0.154 1.178
BMI (㎏․m-2)
Line Dance 25.60±1.63 24.78±1.61 3.346***
Control 26.94±2.77 27.80±2.60 -3.560***
t -0.777 -2.365**
WC
Line Dance 87.39±3.17 85.80±2.96 4.078***
Control 89.51±5.99 90.83±6.88 -2.938**
t -0.195 -1.524*
VFA (㎠)
Line Dance 104.66±8.94 97.38±7.49 9.826***
Control 107.11±10.32 115.98±11.12 -4.764***
t 0.081 -6.058***
* p<0.05, ** p<0.01, *** p<0.001
%BF: percentage of body fat, LBM: lean body mass, BMI: body mass index WC: waist circumference, VFA: visceral fat area
determine whether the specified intensity levels were reached.
2.6 Statistical analysis
All data were presented as mean ± standard deviation (SD) and all statistical analyses were completed using the Statistical Package for Social Sciences (SPSS) version 21.0 for Windows (SPSS Inc., Chicago, IL). All statistical tests used an alpha level set at p < 0.05, and compared the pre- and post-exercise intervention variables. Changes from baseline to the end of the intervention were evaluated using a paired t-test and independent t-test. In the multiple linear regression analysis, serum blood lipids and energy metabolic factors were assessed as the independent variables, with visceral fat change considered the dependent variable in the line dance group. A power analysis was conducted using a sample size of eight for each group, generating an estimated power of 0.82 for a paired sample t-test.
3. Results
3.1 Participant characteristics and body composition
A complete description of demographic characteristics of the study participants can be found in Table 1. The changes in participants’ body composition and VFA before and after the 16-week line dancing program are listed in Table 2. In the line dancing group, weight,
%BF, BMI, WC, and VFA decreased significantly (all, p < 0.001) after the program. In the control group, weight, %BF, BMI, WC, and VFA increased significantly (all, p < 0.001) after the program, while LBM decreased, although this decrease was not statistically significant. Although no significant differences were observed between the groups before the program, the line dancing group had significantly lower weight, %BF, BMI, WC, and VFA (all, p <
0.05) after the exercise program, while LBM exhibited no significant difference.
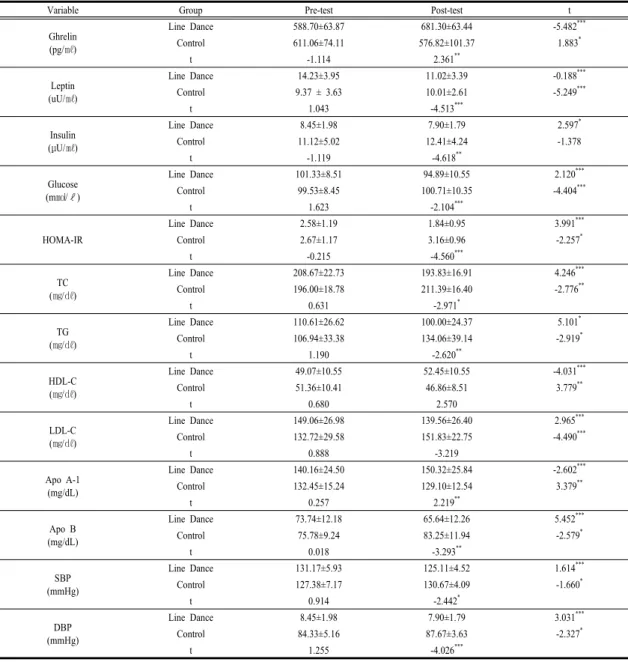
Table 3. Changes in Energy metabolic factors, HOMA-IR and blood lipids
Variable Group Pre-test Post-test t
Ghrelin (pg/㎖)
Line Dance 588.70±63.87 681.30±63.44 -5.482***
Control 611.06±74.11 576.82±101.37 1.883*
t -1.114 2.361**
Leptin (uU/㎖)
Line Dance 14.23±3.95 11.02±3.39 -0.188***
Control 9.37 ± 3.63 10.01±2.61 -5.249***
t 1.043 -4.513***
Insulin (μU/㎖)
Line Dance 8.45±1.98 7.90±1.79 2.597*
Control 11.12±5.02 12.41±4.24 -1.378
t -1.119 -4.618**
Glucose (m㏖/ℓ)
Line Dance 101.33±8.51 94.89±10.55 2.120***
Control 99.53±8.45 100.71±10.35 -4.404***
t 1.623 -2.104***
HOMA-IR
Line Dance 2.58±1.19 1.84±0.95 3.991***
Control 2.67±1.17 3.16±0.96 -2.257*
t -0.215 -4.560***
TC (㎎/㎗)
Line Dance 208.67±22.73 193.83±16.91 4.246***
Control 196.00±18.78 211.39±16.40 -2.776**
t 0.631 -2.971*
TG (㎎/㎗)
Line Dance 110.61±26.62 100.00±24.37 5.101*
Control 106.94±33.38 134.06±39.14 -2.919*
t 1.190 -2.620**
HDL-C (㎎/㎗)
Line Dance 49.07±10.55 52.45±10.55 -4.031***
Control 51.36±10.41 46.86±8.51 3.779**
t 0.680 2.570
LDL-C (㎎/㎗)
Line Dance 149.06±26.98 139.56±26.40 2.965***
Control 132.72±29.58 151.83±22.75 -4.490***
t 0.888 -3.219
Apo A-1 (mg/dL)
Line Dance 140.16±24.50 150.32±25.84 -2.602***
Control 132.45±15.24 129.10±12.54 3.379**
t 0.257 2.219**
Apo B (mg/dL)
Line Dance 73.74±12.18 65.64±12.26 5.452***
Control 75.78±9.24 83.25±11.94 -2.579*
t 0.018 -3.293**
SBP (mmHg)
Line Dance 131.17±5.93 125.11±4.52 1.614***
Control 127.38±7.17 130.67±4.09 -1.660*
t 0.914 -2.442*
DBP (mmHg)
Line Dance 8.45±1.98 7.90±1.79 3.031***
Control 84.33±5.16 87.67±3.63 -2.327*
t 1.255 -4.026***
* p<0.05, ** p<0.01, *** p<0.001
TC : total cholesterol, TG: triglyceride, HDL-C: high-density lipoprotein cholesterol LDL-C: low-density lipoprotein cholesterol, Apo: apolipoprotein, SBP: systolic blood pressure DBP: diastolic blood pressure, HOMA-IR: homeostasis model assessment insulin resistance index
3.2 Energy metabolic factors and blood lipids
Changes in the energy metabolic factors, HOMA-IR, and serum lipid levels before and after the 16-week line dancing program are listed in Table 3. In the line dancing group, Apo A-I, ghrelin and HDL-C increased
significantly (all, p < 0.01) after the program, while leptin, insulin, glucose, HOMA-IR, Apo B, TC, TG, LDL-C, SBP, and DBP decreased significantly (all p <
0.01). In the control group, ghrelin, Apo A-I, and HDL-C decreased significantly (all, p < 0.05) after the program, while leptin, insulin, glucose, HOMA-IR, TC,
Table 4. Regression analysis of visceral fat and blood lipids factors after 16-week Line Dancing exercise group Independent
variables B SE B β t F R2
Constant 85.651 20.233 4.233
8.159* .867
TC .963 .266 1.575 3.625*
LDL-C -.821 .253 -1.541 -3.246*
Apo A-1 -6.53 .140 -1.459 -4.670*
* p<0.05
* by multiple linear regression
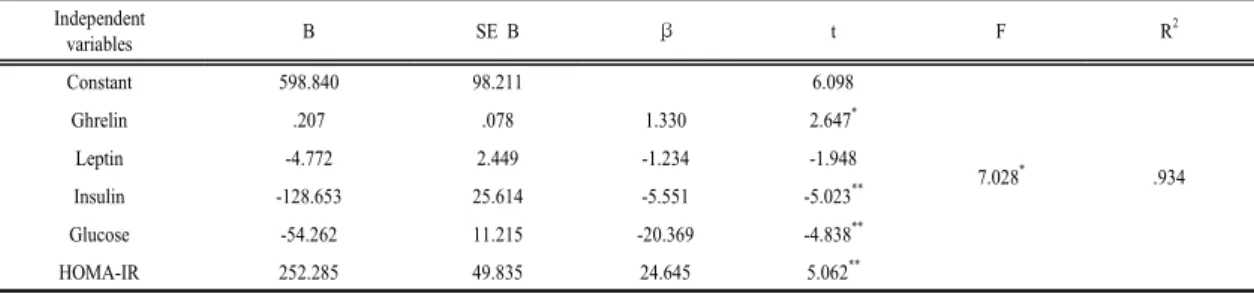
Table 5. Regression analysis of visceral fat and energy metabolic factors after 16-week Line Dancing exercise group Independent
variables B SE B β t F R2
Constant 598.840 98.211 6.098
7.028* .934
Ghrelin .207 .078 1.330 2.647*
Leptin -4.772 2.449 -1.234 -1.948
Insulin -128.653 25.614 -5.551 -5.023**
Glucose -54.262 11.215 -20.369 -4.838**
HOMA-IR 252.285 49.835 24.645 5.062**
* p<0.05, ** p<0.01
* by multiple linear regression
TG, Apo B, LDL-C, SBP, and DBP increased significantly (all, p < 0.05). Although no significant differences were observed between the groups before the program, the line dancing group have significantly lower leptin, insulin, glucose, HOMA-IR, Apo B, TC, TG, SBP, and DBP (all, p < 0.05) after the program, while ghrelin and Apo A-I increased significantly and HDL-C and LDL-C exhibited no significant difference.
The results of the regression analysis of the serum blood lipids and energy metabolic factors that affect visceral fat after the 16-week line dancing program are listed in Table 4 and 5.
Serum lipid factors that affected the visceral fat of the exercise group included TC, Apo A-I, and LDLC (p < 0.05). Energy metabolic factors influenced visceral fat included ghrelin, leptin, insulin, glucose, and HOMA-IR. It was also found that the t-value that determined the statistical significance of the independent variables was significant for ghrelin, glucose, insulin, and HOMA-IR (p < 0.05). Leptin was at the significant level, and the beta coefficient that indicates the importance of the regression coefficient was highest for HOMA-IR at 24.645.
4. Discussion
Aging is known to induce an increase in %BF and a decrease in LBM, while fat storage is likely to change from peripheral subcutaneous to abdominal internal storage[15]. Among women, the accumulation of abdominal fat rapidly increases due to the reduced secretion of estrogen, and the increase in abdominal fat is closely related to the development of metabolic syndromes such as type 2 diabetes, hypertension, and hyperlipidemia[16-18]. Although obesity is associated with genetic factors and body shape, a lack of exercise can also increase the visceral-subcutaneous fat ratio[19]. However, ongoing aerobic exercise decreases abdominal fat, with significant fat reduction in the abdomen compared to that in the limbs, and a subsequent significant decrease in the abdomen-to-thigh ratio of subcutaneous fat[20].
Most of postmenopausal obese women are afflicted with at least one disease, and two or more of the diseases associated with obesity. Postmenopausal women who did not participated in regular and continuous physical activity have increased and/or
decreased body composition, serum blood lipids levels, adipose tissue, and metabolic syndrome factors because non physical activity significantly decreases and increases body weight, BMI, lipid profiles, glucose, and energy metabolsim.
One study evaluated the effects of 12 months of aerobic exercise and calisthenics among overweight postmenopausal women, and observed that ghrelin levels exhibited a significant gradual increase, while the exercise-without-diet program resulted in a 10%
increase in ghrelin levels and 3 kg of weight loss[21].
In addition, another study reported that a 16-week yoga program for postmenopausal women with >35% body fat (average age, 57.3 years) significantly decreased TC, TG, and glucose levels[8]. Yet another study reported that aquarobics exercise significantly increased HDL-C and decreased WC among menopausal women[22].
Interestingly, a study regarding cardiovascular risk factors among 86 adult men and women (age, 21–71 years) revealed a significant negative correlation between ghrelin levels and WHR, VFA, fasting blood sugar, and HOMA-IR in the obesity group, and a positive correlation with HDL-C[23]. However, a significant negative correlation was observed between leptin and ghrelin. Other studies have reported that ghrelin and insulin were negatively correlated[24], that plasma ghrelin and insulin exhibited no correlation[25], and that ghrelin exhibited a significant correlation with WHR, which is related to truncal obesity[26].
Our results are consistent with those of previous studies, despite the differences in the types of exercise that were used. For example, one study regarding the correlations between HOMAIR, TG, FFA, and abdominal visceral fat (among 75 middle-aged obese Koreans without diabetes) revealed that each factor had a significant positive correlation with the insulin resistance index[27]. In addition, in a 12-week swimming exercise program for obese middle-aged women with >30% body fat resulted in a significant decrease in leptin levels[28], while a 12-week aerobic
exercise program and resistance exercise program for middle-aged women with >35% body fat also resulted in a decrease in leptin levels[8,29,30].
Excessive amounts of FFAs in the blood are known to cause hyperinsulinemia by reducing the removal of insulin, subsequently increasing blood pressure and TG, and causing atherosclerosis. In addition, a lack of exercise is considered a risk major factor for heart disease, along with hypertension, hyperlipidemia, and smoking, while regular exercise is an effective way to prevent and treat heart disease. Therefore, regular aerobic exercise is reported to reduce adult diseases that are related to lipid imbalances and obesity (which are caused by inactive lifestyles), as well as hypokinetic disease[1,8,31].
For those with obesity, ghrelin levels decrease, while leptin levels increase. Ghrelin also causes marked hyperglycemia by inhibiting the secretion of insulin.
Ghrelin is a hormone that is produced in the stomach and affects cardiovascular disease, and therefore low ghrelin levels are independently related to type 2 diabetes, insulin resistance, and hypertension, and are negatively correlated with fasting %BF, insulin, and leptin levels[32-35]. Obese patients exhibit lower plasma ghrelin levels, along with significantly higher insulin, glucose, and insulin resistance index than normal patients[31,33,34]. In addition, another study reported that low ghrelin was associated with high WC, high BP, insulin, leptin, and TG[36]. Therefore, the lower ghrelin concentration is independently associated with fasting insulin levels, insulin resistance, and type 2 daiabetes. Similarly, we also observed that the insulin levels of obese participants increased after exercise had reduced their body fat. In addition, we observed that the 16-week line dance program resulted in a significant decrease in weight, %BF, BMI, and VFA among postmenopausal obese women, in terms of changes in body composition and VFA. The line dance program also resulted in a significant increase in ghrelin, Apo A-I, and HDL-C levels, along with a significant decrease in energy metabolic factors and
serum lipid levels (leptin, insulin, glucose, HOMA-IR, TC, TG, Apo B, LDL-C, SBP, and DBP). Among these factors, TC, LDL-C, ghrelin, leptin, insulin, glucose, and HOMA-IR significantly affected visceral fat. The results are consistent with those from previous studies, which have reported improvements in insulin resistance, along with a balancing of energy metabolic factors, due to weight loss. Therefore, our results suggest that regular, ongoing line dance exercise results in a balancing of energy metabolic factors, due to a reduction in body fat, among postmenopausal obese women. Similar programs may be effective in preventing and ameliorating the various lifestyle diseases that may appear after menopause, by improving the participants’ insulin resistance.
5. Conclusions
Regular and continuous line dancing exercise was effective in improving body composition, visceral fat, serum lipids, leptin, ghrelin, and HOMA-IR among postmenopausal women. Therefore, line dance exercise may be effective in preventing the cardiovascular diseases that are caused by obesity in this population.
Future studies are needed to validate these results, as well as to compare the effects of line dancing exercise on these variables in obese and non-obese men and women (in various age groups and exercise types).
This information might then be used to develop effective another aerobic exercise programs for subjects with different ages or body types.
References
[1] D. Y. Kim, J. A. Lee, J. H. Yang. “Effects of hatha yoga exercise on body composition, serum lipids, and health-related fitness in obese middle-aged women”, Journal of Life Science, Vol. 21, No. 4, pp. 521-528, 2011.
DOI: https://doi.org/10.5352/JLS.2011.21.4.521
[2] J. B. Prins, "Adipose tissue as an endocrine organ", Best Practice & Research Clinical Endocrinology &
Metabolism, Vol. 16, No. 4, pp. 639-651, 2002.
DOI: https://doi.org/10.1053/beem.2002.0222
[3] J. M. Zigman, J. K. Elmquist, "Minireview: From anorexia to obesity-the yin and yang of body weight control", Endocrinology, Vol. 144, No. 9, pp. 3749-3756, 2003.
DOI: https://doi.org/10.1210/en.2003-0241
[4] E. Jequier, L. Tappy, "Regulation of body weight in humans", Physiological Reviews, Vol. 79, No. 2, pp.
451-480, 1999.
[5] M. Shintani, Y. Ogawa, K. Ebihara, A. M. Aizawa, F.
Miyanaga, K. Takaya, T. Hayashi, G. Inoue, K. Hosoda, M. Kojima, K. Kangawa, K. Nakao, "Ghrelin, an endogenous growth hormone secretagogue, is a novel orexigenic peptide that antagonizes leptin action through the activation of hypothalamic neuropeptide Y/Y1 receptor pathway", Diabetes, Vol. 50, No. 2, pp.
227-232, 2001.
DOI: https://doi.org/10.2337/diabetes.50.2.227
[6] B. Otto, U. Cuntz ,E. Fruehauf , R. Wawarta, C.
Folwaczny, R. L. Riepl, M. L. Heiman, P. Lehnert, M.
Fichter, M. Tschop, "Weight gain decreases elevated plasma ghrelin concentrations of patients with anorexia nervosa" European Journal of Endocrinology, Vol. 145, No. 5, pp. 669-673, 2001.
[7] M. Tschop, C. Weyer, P. A. Tataranni, V. Devanarayan, E. Ravussin, M. L. Heiman, "Circulating ghrelin levels are decreased in human obesity", Diabetes, Vol. 50, No.
4, pp. 707-709, 2001.
DOI: https://doi.org/10.2337/diabetes.50.4.707
[8] J. A. Lee, D. Y. Kim, "Effects of hatha yoga exercise on serum leptin and metabolic syndrome factors in menopause obese middle-aged women", Journal of Life Science, Vol. 20, No. 7, pp. 1100-1106, 2010.
DOI: https://doi.org/10.5352/JLS.2010.20.7.1100 [9] B. Ludvik, J. J. Nolan, J. Baloga, D. Sacks, J. Olefsky,
"Effect of obesity on insulin resistance in normal subjects and patients with NIDDM", Diabetes, Vol. 44, No. 9, pp. 1121-1125, 1995.
DOI: https://doi.org/10.2337/diab.44.9.1121
[10] Y. H. Kim, C. W. Lee, Y. J. Jeon, M. J. Yong, J. Y.
Kim. Line Dance. Seoul: Daehanmedia, 2008.
[11] Korea Institute of Health and Society. 2001 National health and nutrition survey. Seoul: Ministry of Health and Welfare, 2003.
[12] V. H. Heyward, D. R. Wagner. Applied body composition assessment. 2nd Ed, Champaign, IL: Human Kinetic Publishers, 2004.
[13] American College of Sports Medicine. ACSM’s guidelines for exercise testing and prescription. 7th Ed, Philadelphia, PA: Lippinocott Williams & Wilkins Publishers, 2006.
[14] D. R. Matthews, J. P. Hosker, A. S. Rudenski, B. A.
Naylor, D. F. Treacher, R. C. Turner, "Homeostasis model assessment: insulin resistance and beta-cell function from fasting plasma glucose and insulin concentrations in man", Diabetologia, Vol. 28, No. 7, pp.
412-419, 1985.
DOI: https://doi.org/10.1007/BF00280883
[15] J. L. Kuk, T. J. Saunders, L. E. Davidson, R. Ross,
"Age-related changes in total and regional fat distribution", Ageing Research Reviews, Vol. 8, No. 4, pp. 339–348, 2009.
DOI: https://doi.org/10.1016/j.arr.2009.06.001
[16] S. M. Grundy, "Cholesterol and coronary heart disease"
The Journal of the American Medical Association, Vol.
264, No. 23, pp. 3053-3059, 2000.
DOI: https://doi.org/10.1001/jama.264.23.3053
[17] H. Shimokata, R. Andres, P. J. Coon, D. Elahi, C.
Muller, J. D. Tobin, "Studies in the distribution of body fat. II. Longitudinal effects of change in weight", International Journal of Obesity, Vol. 13, No. 4, pp.
455-464, 1989.
[18] X. H. Ma, R. Muzumdar, X. M. Yang, I. Gabriely, R.
Berger, N. Barzilai, "Aging is associated with resistance to effects of leptin on fat distribution and insulin action", The Journal of Gerontology, Vol. 57, No. 6, pp. 225– 231, 2002.
DOI: https://doi.org/10.1093/gerona/57.6.B225
[19] I. Shimomura, K. Tokunaga, K. Kotani, Y. Keno, M. F.
Yanase, K. Kanosue, S. Jiao, T. Funahashi, T. Kobatake, T. Yamamoto, "Marked reduction of acyl-CoA synthetase activity and mRNA in intra-abdominal visceral fat by physical exercise", American Journal of Physiology, Vol. 265, No. 1, pp. 44-50, 1993.
[20] J. P. Despres, M. C. Pouliot, S. Moorjani, A. Nadeau, A.
Tremblay, P. J. Lupien, G. Thériault, C. Bouchard, "Loss of abdominal fat and metabolic response to exercise training in obese women", The American Journal of Physiology, Vol. 261, No. 2, pp. 159-167, 1991.
[21] K. E. Foster-Schubert, A. McTiernan, R. S. Frayo, R. S.
Schwartz, K. B. Rajan, Y. Yasui, S. S. Tworoger, D. E.
Cummings, "Human plasma ghrelin levels increase during a one-year exercise program", The Journal of Clinical Endocrinology & Metabolism, Vol. 90, No. 2, pp. 820-825, 2005.
DOI: https://doi.org/10.1210/jc.2004-2081
[22] Y. A. Park, D. H. Kim. “Effects of aquarobics on metabolic syndrome and health fitness in abdominally obese elderly women”, Journal of the Korea Academia-Industrial cooperation Society, Vol. 16, No. 8, pp. 5180-5188, 2015.
DOI: http://dx.doi.org/10.5762/KAIS.2015.16.8.5180 [23] J. Y. Kim, H. W. Shin, I. K. Jeong, S. H. Cho, S. J.
Min, S. J. Lee, C. Y. Park, G. W. Oh, E. G. Hong, H.
G. Kim, D. M. Kim, "The relationship of adiponectin, leptin and ghrelin to insulin resistance and cardiovascular risk factors in human obesity“, The Korean Journal of Medicine, Vol. 69. No. 6, pp.
631-641, 2005.
[24] M. Tschop, C. Weyer, P. A. Tataranni, V. Devanarayan, E. Ravussin, M. L. Heiman, "Circulating ghrelin levels are decreased in human obesity", Diabetes, Vol. 50, No.
4, pp. 707-709, 2001.
DOI: https://doi.org/10.2337/diabetes.50.4.707
[25] A. Gokcel, Y. Gumurdulu, F. Kayaselcuk, E. Serin, B.
Ozer, A. K. Ozsahin, N. Guvener, "Helicobacter pylori has no effect on plasma ghrelin levels", European Journal of Endocrinology Prize, Vol. 148, No. 4, pp.
423-426, 2003.
DOI: https://doi.org/10.1530/eje.0.1480423
[26] K. M. Choi, J. Lee, K. W. Lee, J. A. Seo, J. H. Oh, S.
G. Kim, N. H. Kim, D. S. Choi, S. H. Baik, "The associations between plasma adiponectin, ghrelin levels and cardiovascular risk factors. European Journal of Endocrinology, Vol. 150, No. 5, pp. 715-718, 2004.
DOI: https://doi.org/10.1530/eje.0.1500715
[27] D. Kim, S. Nam, C. Ahn, K. Kim, S. Yoon, J. Kim, B.
Cha, S, Kim K. Lim, H. Lee, K. Huh, "Correlation between midthigh low-density muscle and insulin resistance in obese nondiabetic patients in Korea.
Diabetes Care, Vol. 26, No. 6, pp. 1825-1830, 2003.
DOI: https://doi.org/10.2337/diacare.26.6.1825
[28] S. C. Hong, J. Y. Lee, J. W. Yeom, "The Effect of long term swimming training on body composition and leptin hormone in obese middle-aged women", Journal of Exercise Nutrition & Biochemistry, Vol. 6, No. 2, pp.
157-161, 2002.
[29] C. H. Shin, "The effects of different weight loss program on metabolism regulatory hormone and body composition", Korean Journal of Physical Eduaction, Vol. 41, No. 4, pp. 421-433, 2002.
[30] D. K. Kang, "The effects of resistance exercise prescription on the body composition, abdominal fat and metabolism regulatory hormone in the severe obesity middle-age women", Korean Journal of Physical Eduaction, Vol. 43, No. 3, pp. 613-622, 2004.
[31] J. W. Kim, D. Y. Kim , "Effects of aerobic exercise training on serum sex hormone binding globulin, body fat index, and metabolic syndrome factors in obese postmenopausal women", Metabolic Syndrome and Related Disorders, Vol. 10. No. 6, pp. 452-457, 2012.
DOI: https://doi.org/10.1089/met.2012.0036
[32] A. F. Mohamed, D. Mohammed, N. Fiona, T. Ali, A.
Monira, B. Kazem, B. Abdullah, E. Naser, "Gender differences in ghrelin association with cardiometabolic risk factors in Arab population", International Journal of Endocrinology, Vol. 2014, pp. 8, 2014.
[33] M. Scerif, P. Goldstone, M. Korbonits, "Ghrelin in obesity and endocrine diseases", Molecular Cellular Endocrinology, Vol. 340, No. 1, pp. 15-25, 2011.
DOI: https://doi.org/10.1016/j.mce.2011.02.011 [34] J. A. Lee, J. W. Kim, D. Y. Kim, "Effects of yoga
exercise on serum adiponectin and metabolic syndrome factors in obese postmenopausal women", The Journal of The North American Menopause Society, Vol. 19, No. 3, pp. 296-301, 2012.
DOI: https://doi.org/10.1097/gme.0b013e31822d59a2 [35] J. A. Lee, D. Y. Kim. "Effects of line dance exercise on
HOMA-IR and evergy metabolic factors in postmenopausal obese women", Journal of the Korea Academia-Industrial cooperation Society, Vol. 13, No.
10, pp. 4636-4644, 2012.
DOI: http://dx.doi.org/10.5762/KAIS.2012.13.10.4636 [36] Poykko, S. M., E. Kellokoski, S. Horkko, H. Kauma, Y.
A. Kesaniemi, and O. Ukkola. Low plasma ghrelin is associated with insulin resistance, hypertension, and the prevalence of type 2 diabetes. Diabetes, 52(10), pp.
2546-2553, 2003.
DOI: https://doi.org/10.2337/diabetes.52.10.2546
Jeong-Ah Lee [Regular member]
•Feb 2003 : Kyungsung Univ., Exercise Science, MS
•Feb 2006 : Kyungsung Univ., Exercise Science, Ph.D
•March 2012 ~ current : Kyungsung Univ., Dept. of Physical Education, Professor
<Research Interests>
Metabolism, Obesity
Ji-Hyeon Kim [Regular member]
•Aug 2010 : Korea Maritime and Ocean Univ., Ocean Science, MS
•Jan 2017 : Pusan National Univ., Physical Education, ABD
•March 2014 ~ current : Korea Maritime and Ocean Univ, Adjunct Instructor
<Research Interests>
Metabolism, Cardiovascular, Obesity
Jong-Won Kim [Regular member]
•Feb, 1999 : Pusan National Univ., Exercise Science, MS
•Feb, 2004 : Pusan National Univ.,Exercise Science, Ph.D
•Feb 2011 ~ Feb 2012 : Pusan National Univ., Post-doctor
•Sep 2015 ~ current : Busan National Univ of Edu., Dept. of Physical Education, Professor
<Research Interests>
Elementary Physical Education, Obesity
Do-Yeon Kim [Regular member]
•May. 2005 : U of Utah (USA) xercise Science, MS
•Aug, 2009 : U of New Mexico (USA) Exercise Science, Ph.D
•March 2014 ~ current : Pusan National Univ., Dept. of Physical Education, Professor
<Research Interests>
Metabolism, Calorimetry, Obesity