DOI : 10.5394/KINPR.2010.34.9.705
Building Energy Management System Coupling with Renewable Energy System
Jin-Seok Oh*
* Professor, Korea Maritime University, Busan 606-791, Korea
Abstract : Buildings nowadays are increasingly expected to need higher and more economic performance requirements. Energy consumption in buildings accounts for over 30% of total energy use. The Building Energy Management System (BEMS) and renewable energy (RE) technologies are considered as a potential measure to improve energy efficiency and reduce use of grid-power. It is, however, a challenge to utilise the intermittent energy supply of RE in building energy systems. This paper presents an experimental study on a RE-embedded BEMS. A control algorithm for the RE-embedded BEMS was designed to maximise the utilisation of RE and eventually to reduce electrical utility bill. The proposed system is tested at a laboratorial chamber with an air conditioner, fan and heater.
The contribution of RE in building energy system is discussed to this end.
Key words : Building Energy Management System, Renewable Energy, Control Algorithm
* Corresponding Author : [email protected], 051)410-4283
Note) This paper was presented on the subject of "Experimental Study on Control Algorithm for A Building Energy Management System Coupling with Renewable Technologies" World Renewable Energy Congress Ⅺ 29th September 2010, Abu Dhabi, UAE.
1. Introduction
Increasing concern about soaring oil price and environmental issue has instigated researchers to study regarding improving energy efficiency and developing renewable energies. Especially, in many countries, energy consumption in buildings accounts for over 30% of total energy use(Kalz et al, 2009). The Building Energy Management System (BEMS) and renewable energy source are considered as a potential measure to improve energy efficiency and reduce use of grid-power. BEMS provides control, managing and monitoring of buildings' heating, ventilating and air-conditioning systems. It enables efficient control of building environments and reduces energy consumption. Meanwhile, due to the low carbon energy policy in many countries, the number of the installation of building integrated renewable energy systems increases. As a result, energy supply systems for buildings get diverse and complex in terms of monitoring and control. One of critical challenges is to maximise the utilisation of RE systems which have intermittent and unpredictable supply profiles. To address this, BEMS requires smarter approaches with which energy demand/supply systems are monitored and controlled dynamically depending on the availability of RE supply.
In this study, a control algorithm was proposed to manage RE-embedded energy systems in buildings. The algorithm was tested at a laboratorial room equipped with a
BEMS. This paper presents the control algorithm, the laboratorial BEMS, the results of the experimental test.
2. Methodology
2.1 The proposed control algorithm
Two modes of energy management in BEMS were defined for heating and cooling, which are real control mode and predictive control mode.
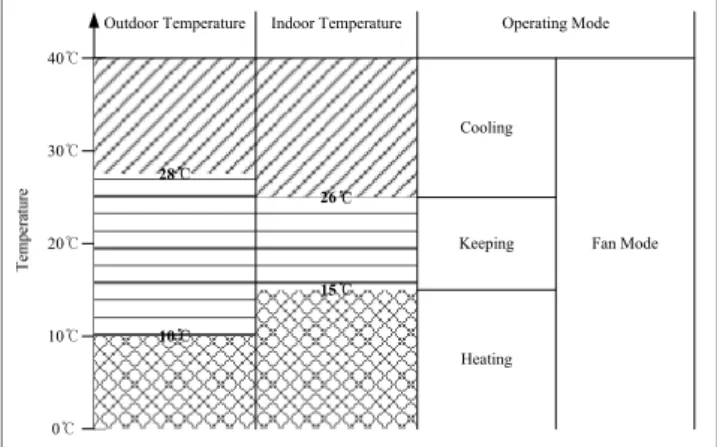
In the real control mode, room temperatures are controlled by air ventilation fans on the basis of outdoor temperature and setting room temperatures. There are four operating modes to control room temperatures which are heating, keeping, cooling and fan mode.
40℃
30℃
20℃
10℃
0℃
Outdoor Temperature Indoor Temperature
28
26
15 10
Operating Mode
Cooling
Keeping
Heating
Fan Mode
Fig. 1 Conceptual diagram regarding the real control mode
Fig. 1 illustrates the temperature conditions and operating modes in the real control mode. The fan is only operated when outdoor temperature gives an advantage to save energy. For example, while heating is required and outdoor temperature is higher than indoor temperature, indoor temperature can be raised by using a fan.
In the real control mode, the main aim is to maximise the utilisation of RE supply and minimise use of grid power. If the output from RE is sufficient to meet the electricity demand (i.e. fan or air conditioner) for heating/cooling, this RE generated energy is used. If it is not sufficient to meet the electricity demand, electricity from Grid is imported to
(a) The flowchart of real control mode
(b) The flowchart of predictive control mode Fig. 2 The flowcharts of real control mode and predictive
control mode
compensate insufficient amount of electricity to meet the electricity demand. (a) in Fig. 2 shows the flowchart of the control mode.
Recently electricity supply companies have adopted a new tariff system which increases cost per energy use unit when electricity demand reaches a threshold point(Kolokotsa et al, 2010). If BEMS allow energy demand entities to avoid the threshold point, it is expected that electricity bill will be reduced. Improving the real control mode, more intelligent control could be developed such as predictive control to address this economical energy management. In the predictive control mode, BEMS is supported by more comprehensive information and intelligent analysis methods.
The predictive control mode electricity from Grid at the threshold point can be avoided by predicting local weather on the day. In this study, the predictive control mode was excluded for the experiment since the main purpose of the study is to establish the laboratorial level hardware system of RE-embedded BEMS and assess the operational performance.
2.2 Test bed
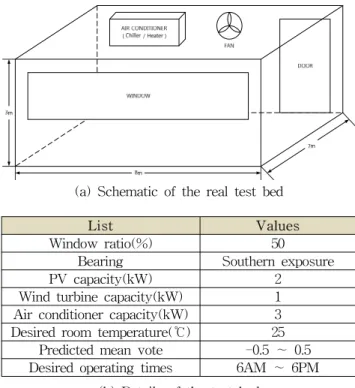
In order to implement the experimental test, a laboratory was set up as a test bed as illustrated in (a) in Fig. 3. The specification of the test bed is shown in (b) in Fig. 3. The test bed was assumed as an office room where indoor temperatures are control by an air conditioner and a fan.
(a) Schematic of the real test bed
List Values
Window ratio(%) 50
Bearing Southern exposure
PV capacity(kW) 2
Wind turbine capacity(kW) 1
Air conditioner capacity(kW) 3 Desired room temperature(℃) 25
Predicted mean vote -0.5 ∼ 0.5 Desired operating times 6AM ∼ 6PM
(b) Details of the test bed
Fig. 3 The specification of the real test bed
The electricity for the air-conditioner and the fan in the room are supplied from both of Grid and RE systems (i.e. a photovoltaic (PV) system and a wind turbine system) installed in the roof of the building.
2.3 RE-embedded BEMS 2.3.1 Hardware system
Fig. 4 illustrates the RE-embedded BEMS developed for the experiment. Renewable energy systems (i.e. PV and wind turbine) are controlled by the MPPT controller (KEPCO, 2009) and Hybrid power controller (Pfafferott et al, 2004; IEA, 2008) to maximise their efficiencies. Grid-connected inverter links energy supply systems with demand side controlled by Electric load controller. Electric load controller calculates the required electricity in demand side and checks total output power from renewable energy systems. The power distribution between grid and renewable systems is estimated using Pulse Width Modulation (PWM) method which provides intermediate amounts of electrical power between fully-switch on and fully-switch off. The power distribution between RE and Grid is managed aiming at maximising utilisation of RE. The electric load controller gives the high priority to renewable systems.
Fig. 4 Schematic diagram of the hardware
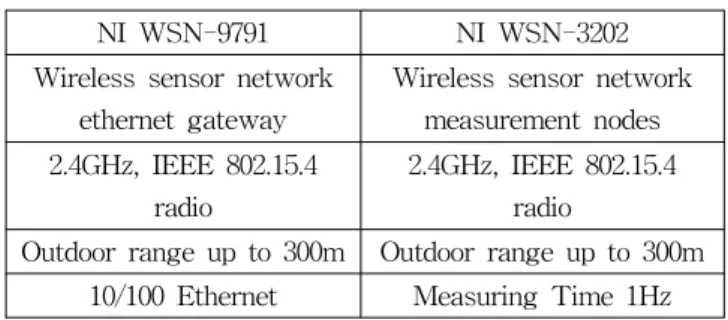
2.3.2 Monitoring system using wireless sensor network Considering installation costs and flexibility for changes in the layout of the building, wireless sensor network devides was adopted for monitoring. Fig. 5 illustrates the developed monitoring system using wireless sensor network to manage the energy in a building. Wireless modules (NI WSN-3202) mounted on both the PV and wind turbine respectively on the rooftop of E2E laboratory transmit information (such as output of voltage and current, temperature, solar radiation and wind velocity) to wireless gateway module (NI WSN-9791). In addition, wireless gateway also collects indoor information (such as room temperature and humidity) through wireless module (NI WSN-3202) mounted inside test laboratory. Table 1 shows
the specification of wireless modules used in this work. All collected data by gateway module are transmitted to host PC via Ethernet to monitor and control the developed building energy management system in real time using the proposed energy management algorithm.
Fig. 5 Schematic diagram of the wireless network system
NI WSN-9791 NI WSN-3202
Wireless sensor network ethernet gateway
Wireless sensor network measurement nodes 2.4GHz, IEEE 802.15.4
radio
2.4GHz, IEEE 802.15.4 radio
Outdoor range up to 300m Outdoor range up to 300m 10/100 Ethernet Measuring Time 1Hz Table 1 The specification of the wireless sensor module
3. Results
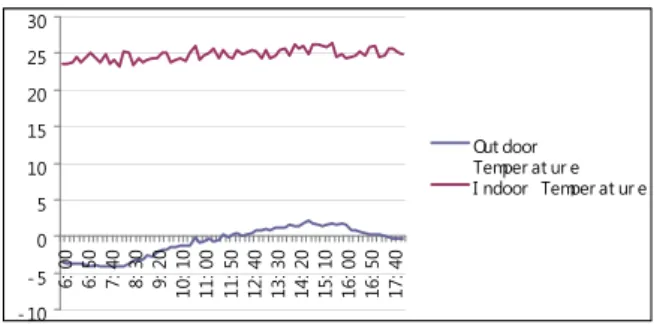
The experimental test of the performance of the RE-embedded BEMS was carried out during the periods of May, August and December in 2009. The environment data (i.e. indoor and outdoor temperature) and electricity use data are measured every 10 minutes. Fig.6 depicts the results of the test. The RE-embedded BEMS managed to maintain the indoor temperature at the setting point (i.e. 25 ℃) during heating, cooling, intermediate seasons as shown in (a), (c) and (e) in Fig. 6. Graphs (b), (d) and (f) in Fig. 6 shows the energy use of PV, wind turbine and Grid imported power to control the indoor setting temperature. Generally, the generation of Wind turbine is limited (i.e. less than 200 W even during the windy days).
Since the air-conditioner was controlled according to the temperature gap between indoor and outdoor temperature, the energy use of Grid increase when the electricity generation of PV and wind turbine cannot meet the demand
sufficiently. This can be seen in graph (d) in Fig. 6, where the temperature gap gets wider around 8 AM as shown in graph (c) in Fig.6, the energy use of Grid increase while the electricity output power from PV reaches at about 1.2 kW. . On the contrary, when the overall temperature gap is relatively small in May and August ((a) and (c) in Fig. 6), the electricity of Grid is used less. Table 2 shows the total consumed power, power from grid and reduction rate of Grid electricity measured from 6AM to 8AM on a day of each season. According to this result, the RE-embedded BEMS
0 5 10 15 20 25 30
6:00 6:50 7:40 8:30 9:20 10:10 11:00 11:50 12:40 13:30 14:20 15:10 16:00 16:50 17:40
Out door Temper at ur e I ndoor Temper at ur e
(a) Temperature (℃) on 17 May 2009 (Windy)
0 200 400 600 800 1000 1200 1400 1600 1800
6:00 6:50 7:40 8:30 9:20 10:10 11:00 11:50 12:40 13:30 14:20 15:10 16:00 16:50 17:40
Wind Power PV Power Gr i d Power
(b) Consumed power (W) on 17 May 2009 (Windy)
0 5 10 15 20 25 30 35
6:00 6:50 7:40 8:30 9:20 10:10 11:00 11:50 12:40 13:30 14:20 15:10 16:00 16:50 17:40
Out door Temper at ur e I ndoor Temper at ur e
(c) Temperature (℃) on 23 August 2009 (Sunny)
2000 400 600800 10001200 1400 16001800 2000
6:00 6:50 7:40 8:30 9:20 10:10 11:00 11:50 12:40 13:30 14:20 15:10 16:00 16:50 17:40
Wind Power PV Power Gr i d Power
(d) Consumed power (W) on 23 August 2009 (Sunny)
- 10 - 5 0 5 10 15 20 25 30
6:00 6:50 7:40 8:30 9:20 10:10 11:00 11:50 12:40 13:30 14:20 15:10 16:00 16:50 17:40
Out door Temper at ur e I ndoor Temper at ur e
(e) Temperature (℃) on 18 December 2009 (Sunny)
0 500 1000 1500 2000 2500 3000
6:00 6:50 7:40 8:30 9:20 10:10 11:00 11:50 12:40 13:30 14:20 15:10 16:00 16:50 17:40
Wind Power PV Power Gr i d Power
(f) Consumed power (W) on 18 December 2009 (Windy)
Fig. 6 Result graphs regarding temperature and consumed power in May, July and December
Date
Total consumed
power (Wh)
Power from Grid
(Wh)
Reduction rate (%)
17 May 2009 17,556 6,958 60
23 Aug 2009 25,594 10,528 58
18 Dec 2009 27,378 17,193 37
Table 2 Figure of consumed power
performed to achieve approximate 40% - 60% of Grid reduction rate depending on the power availability of RE. It is noticeable that the energy use of Grid decreased drastically when the energy demand is within the available power from PV and wind turbine
4. Conclusions
A RE-embedded BEMS with wireless monitoring and a smart control algorithm from heating/cooling was proposed.
The proposed system was tested in a laboratory during different seasons. According to the laboratorial test, the performance of the proposed system was noticeably demonstrated showing that about 40% - 60% reduction of Grid use was made. High reduction rate of Grid use is only
possible when the energy demand is met by the energy supply from RE. It implies that the reduction of energy demand is a critical measure as well as increasing the capacity of RE in order to increase the utilisation of RE.
Using wireless communication network, dynamic demand-side control could be implemented, which controls demand entities depending on the availability of RE power profiles.
Acknowledgements
The authors would like to thank British Council for support as a part of PMI2 program. The authors also would like to thank MLTM(Ministry of Land, Transport and Maritime affairs of Korea) for support as a part of "A Development of Hybrid Power Generation System for Ocean Facility" R&D program.
References
[1] IEA(International Energy Agency, 2008), Worldwide Trends in Energy Use and Efficiency
[2] Kalz, D. E., Herkel, S. and Wagner, A.(2009), "The impact of auxiliary energy on the efficiency of the heating and cooling system: Monitoring of low-energy buildings," Energy Build, Vol.41, pp.1019~1030
[3] Kolokotsa, D., Rovas, D., Kosmatopoulos E. and Kalaitzakis, K.(2010), "A roadmap towards intelligent net zero- and positive-energy buildings," Solar Energy, In Press, Corrected Proof.
[4] Korea Electric Power Corporation (KEPCO, 2009), Electric Rates Table
[5] Pfafferott, J., Herkel, S. and Wambsganß, M.(2004),
"Design, monitoring and evaluation of a low energy office building with passive cooling by night ventilation,"
Energy Build, Vol.36, pp.455~465
Received 27 October 2010 Revised 13 December 2010 Accepted 15 December 2010