국내 두록 품종의 근교수준 및 유효집단 크기 추정
홍준기1ㆍ송나래1ㆍ김두완1ㆍ김시동1ㆍ김영화1ㆍ최재관1ㆍ문효식2ㆍ조규호1*
1농촌진흥청 국립축산과학원, 2한국종축개량협회
Inbreeding levels and effective population size of duroc populations of major swine breeding farms in Korea
Joon Ki Hong1, Na Rae Song1, Du Wan Kim1, Si Dong Kim1, Young Hwa Kim1, Jae Gwan Choi1, Hyo Sik Mun2, Kyu Ho Cho1*
1National Institute of Animal Science, R.D.A, Cheonan 331-801 Korea
2Korea Animal Improvement Association, Seoul 137-871, Korea
Received on 13 January 2014, revised on 25 February 2014, accepted on 6 March 2014
Abstract : The pedigree data of 86,639 heads from six major swine breeding farms were investigated to check levels of inbreeding and effective population size of breeding stocks. The average rate of inbreeding was 1.04%, 0.87%, 3.17%, 1.05%, 3.23% and 3.33% for farms A, B, C, D, E and F, respectively. The average inbreeding rate was highest for F farm and lowest for B farm. In farms D and E, there were quite large numbers of immigrant animals per generation compared to other farms. The effective population sizes calculated from the average rate of inbreeding were distributed between 83.0 and 814.8. Specific values were 282.3, 225.5, 83.0, 814.8, 302.9 and 175.7 for farms A, B, C, D, E and F, respectively. The results showed that there was no cause for concern over the current inbreeding level of major swine breeding farm populations and the inbreeding level was within an acceptable range. In addition, internal sharing rather than importing pig is necessary to strengthen seed sovereignty.
Key words : Inbreeding, Inbreeding Coefficient, Swine, Pedigree Structure, Effective Population Size
*Corresponding author: Tel: +82-41-580-3305 E-mail address: [email protected]
I. 서 론
종돈산업에서 계통 또는 품종 간 교잡은 다음세대 잡종 강세 효과를 높이기 위해 다양한 방법으로 활용되고 있다.
종돈의 계통 및 품종 유지에 있어서 새로운 종돈이 유입되 지 않는 이상 근친교배는 피할 수 없는 문제이며, 근교수준 이 높아짐에 따라 유전적 다양성, 번식능력 및 생리학적 효율성이 감소된다(Falconer 등; 1996; Mandal 등; 2004;
Singh와 Gurnani, 2004).
우수한 종돈을 선발하기 위해선 개체 육종가 추정을 통 해 능력의 정확한 평가가 필요하다. Best Linear Unbiased Prediction (BLUP)을 활용한 선발방법(Henderson와Quaas, 1976)은 상가적 유전효과인 육종가를 추정하고 세대별 평
균 육종가 변화를 확인함으로 선발효과를 정확하게 추정할 수 있다. 하지만 BLUP을 활용한 선발방법은 과거에 활용 된 선발지수법과 표현형 선발 방법에 비해 집단의 근교수 준을 증가시킬 수 있다고 보고된 바 있다(Smith, 1988;
Quinton등, 1992). 따라서 정확한 선발과 동시에 근교수준 을 낮춰 유전적 다양성을 유지시키는 방안이 필요하다.
유전적 다양성을 확인하는 가장 일반적인 지표인 유효집 단 크기(effective population size; Ne)는 Wright (1931) 에 의해 개발되었으며, Sjödin 등(2005)은 혈통자료로 추 정한 근교계수를 활용하여 Ne 분석 방법을 발전시켰다.
Kim 등(2006)은 국내 혈통자료를 활용하여 2004년까지의 국내 주요 종돈장의 근교계수 변화와 유효집단 크기를 조 사한 바 있다. 국내 일반적인 돼지고기 생산 체계에서 두록 품종은 종료종모돈으로 활용되어 모계품종에 비해 두수가 상대적으로 적다. 따라서 국내 두록 품종의 집단현황을 조
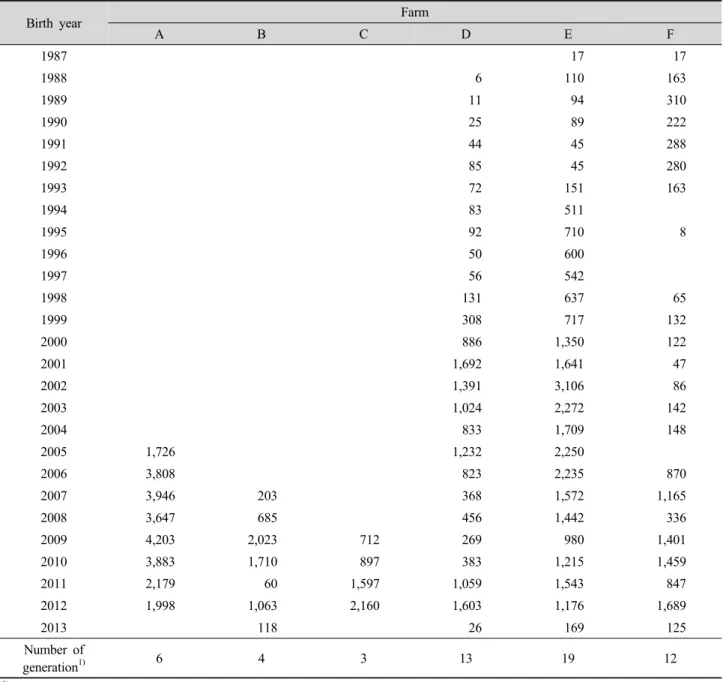
Table 1. Number of records and generation by farm.
Birth year Farm
A B C D E F
1987 17 17
1988 6 110 163
1989 11 94 310
1990 25 89 222
1991 44 45 288
1992 85 45 280
1993 72 151 163
1994 83 511
1995 92 710 8
1996 50 600
1997 56 542
1998 131 637 65
1999 308 717 132
2000 886 1,350 122
2001 1,692 1,641 47
2002 1,391 3,106 86
2003 1,024 2,272 142
2004 833 1,709 148
2005 1,726 1,232 2,250
2006 3,808 823 2,235 870
2007 3,946 203 368 1,572 1,165
2008 3,647 685 456 1,442 336
2009 4,203 2,023 712 269 980 1,401
2010 3,883 1,710 897 383 1,215 1,459
2011 2,179 60 1,597 1,059 1,543 847
2012 1,998 1,063 2,160 1,603 1,176 1,689
2013 118 26 169 125
Number of
generation1) 6 4 3 13 19 12
1)Number of generation was calculated while sorting animals in the pedigree by descent.
사할 필요가 있으며, 이를 위해 본 연구에서는 국내 주요 두록 종돈장의 혈통자료를 이용하여 근교수준과 유효집단 크기를 추정하였다.
II. 재료 및 방법
1. 혈통자료
분석을 위해 한국종축개량협회에서 생년월일과 혈연관 계가 확인된 두록 품종 혈통자료(6개 종돈장)를 이용하였
다. 혈연관계를 가지기 시작한 1987년부터 2013년까지 총 86,639두의 혈통자료를 최종적으로 이용하였다(Table 1).
2. 혈통구조와 근교계수
혈통파일의 모든 개체는 Golden등(1992)에 의해 개발된 Animal Breeders’ Tool Kit(ABTK)의 “stack”과 유사한 단 순반복 알고리즘을 사용하여 연대순으로 정렬하였다.
(1) 생성번호 1로 모든 개체를 표기하고 0으로 반복을 설정
G(i) = 1, i=1,2,….n Iteration = 0
n = 혈통동물의 수, G = 동물세대수의 벡터, G(i)
= i번째 동물 G벡터의 요소, iteration(반복) = 회전 수의 계산
(2) 0으로 카운트를 설정하고 반복을 1 씩 증가 Count = 0
Iteration = iteration+1
(3) 각 동물에 대해 i의 아비는 s, 어미는 d로 읽는다.
G(s)(G(d))가 G(i)+1보다 작을 경우 혈통에서 찾고 G(s)와 G(d)에 G(i)+1을 추가한다.
(G(s)<G(i) +1) G(s) = G(i)+1, count = count+1 (G(d)<G(i) +1) G(d) = G(i)+1, count = count+1
(4) G의 값이 변화가 없을 때까지 (2), (3) 단계를 수행한 다. 혈통에 루프가 있다면 일정수의 반복 후에 중지 하고 제외시킨다. 반복 수에 대한 기준은 특정 개체 의 생성번호보다 크면서 20세대를 초과하는 개체는 없기 때문에 본 연구에서는 20으로 설정하였다: if (count>0 and iteration <20) goto(2)
근교계수는 Meusissen과 Luo(1992)의 방법을 사용하였 다. 각각의 모든 기초 개체는 근교계수를 0으로 하여 근친 이 없는 것으로 가정하였다. 아비 또는 어미가 두 자손 이하 이고 개별로 혈통이 나열되지 않은 경우 삭제 하였다. 근교 계수 비율은 다음과 같이 계산하였다.
∑= Δ
= −
Δ nt Ft
F n 2
1 1
여기서 n은 각 종돈장의 세대 수이며 ΔFt = (Ft-Ft-1)/
(1-Ft-1)와 Ft = t는 세대 수에 태어난 개체들의 평균 근교 계수이다(Falconer 등, 1996).
III. 결과 및 고찰
1. 혈통구조 및 근교계수
Table 1에 혈통분석 두수와 종돈장별 세대 수를 분석한
결과를 나타내었다. 종돈장별 세대 수는 3~19세대로 다양 하게 분석되었는데, 이는 종돈장별 축군의 조성 및 육종 시작 시점이 다르기 때문에 다양한 차이를 나타낸 것으로 사료된다.
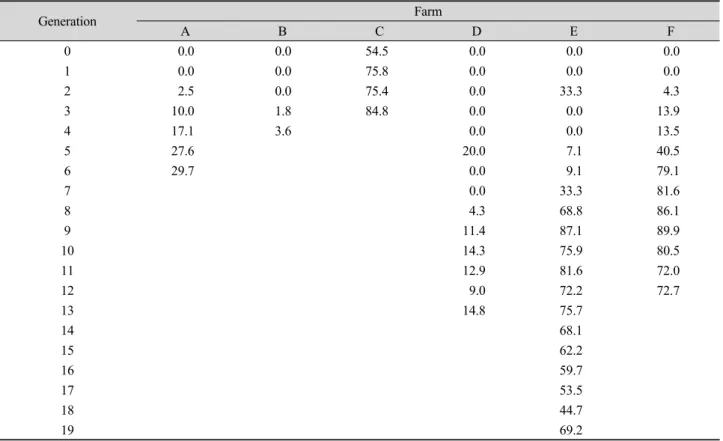
두록 품종의 세대에 따른 근교계수 변화는 Table 2에, 근 교계수가 0이상인 개체비율을 세대별로 분석한 결과는 Table 3에 나타내었다. Fig 1, 2는 세대별 근교계수와 근교계수 0 이상인 개체비율의 전형적인 변화 패턴을 나타내었다.
종돈장별 평균 근교계수는 0.87~3.33% 범위로 조사되 었으며 세대별 2가지 변화 양상을 보였다. 첫 번째 패턴으 로 A 종돈장과 같이 세대가 지남에 따라 근교계수가 증가하 는 경향은 Fig 1에 나타내었다. 두 번째 패턴으로 F 종돈장 과 같이 세대가 지남에 따라 근교계수가 증가하지만 특정 시점에 감소한 후 다시 증가하는 경향은 Fig 2에 나타내었 다. D종돈장의 4~6세대, E종돈장의 1~3세대는 근교계수 가 0에서 4~5%로 급격하게 상승한 후 다시 0으로 내려가 는 것을 확인 할 수 있다(Table 2). 이와 같은 경우는 초기 집단 규모가 작기 때문에 교배과정에서 큰 차이로 근교계 수가 상승하였으며, 그 다음세대에서 자체집단이 아닌 외 부 새로운 종돈을 도입하여 집단의 근교계수를 낮춘 것으 로 사료된다.
전반적으로 세대별 평균 근교계수는 0~5% 수준을 나타 냈다. NSIF(1987)에서는 집단의 근교계수 평균이 10% 이 상으로 상승하면 생존산자수와 증체량이 감소하기 때문에 10% 이하로 유지할 것을 권장하고 있다.
2. 유효집단 크기(Ne)
근교비율(ΔF)은 집단이 얼마나 많은 세대를 구성하고 있 는지를 포함하기 때문에, 일반적인 집단 근교계수 평균보 다 더 중요한 의미를 가진다(Kim 등, 2006). 또한 이전 세 대와의 근교수준 비교를 통해 유효집단 크기(Ne)를 추정할 수 있다(Falconer 등, 1996;). 근교비율(ΔF)을 통해 추정 한 종돈장의 유효집단 크기는 Table 4에 나타내었다.
6개 종돈장(A~F)의 ΔF는 각각 0.177%, 0.222%, 0.603%, 0.061%, 0.165% 및 0.285%로 분석되었다. ΔF 비율이 가 장 높게 측정된 C 종돈장은 세대수가 3세대이며 세대별 근 교계수 증가비율(ΔFt)은 0.30~1.14%로 관찰되었다. 다른 종돈장과는 달리 C 종돈장은 세대가 3세대로 매우 짧고 1세 대의 근교계수 증가비율(ΔF1)이 크기 때문에 ΔF1이 전체 근교비율(ΔF)에 많은 영향을 준 것으로 사료된다. 반면에
Table 2. Mean level of inbreeding (%) for each generation and farm in Duroc.
Farm
GEN A B C D E F
N Mean SD Max2) N Mean SD Max N Mean SD Max N Mean SD Max N Mean SD Max N Mean SD Max 0 25 0.00 0.00 0.00 3 0.00 0.00 0.00 11 1.42 1.52 3.91 1 0.00 0.00 0.00 1 0.00 0.00 0.00 4 0.00 0.00 0.00 1 45 0.00 0.00 0.00 5 0.00 0.00 0.00 62 2.55 2.16 7.81 1 0.00 0.00 0.00 4 0.00 0.00 0.00 22 0.00 0.00 0.00 2 79 0.08 0.49 3.13 22 0.00 0.00 0.00 179 2.84 3.40 26.95 2 0.00 0.00 0.00 3 4.17 5.89 12.50 23 1.09 5.10 25.00 3 120 0.42 1.56 12.50 167 0.45 3.32 25.00 5,114 3.19 3.64 27.34 2 0.00 0.00 0.00 9 0.00 0.00 0.00 36 0.39 1.00 3.13 4 158 0.50 1.25 6.25 5,665 0.88 4.60 25.00 3 0.00 0.00 0.00 17 0.00 0.00 0.00 37 0.38 1.03 3.52 5 449 0.76 1.58 14.45 5 5.00 10.00 25.00 28 0.89 3.22 12.50 37 0.91 1.27 3.52 6 24,514 1.06 2.46 25.00 8 0.00 0.00 0.00 33 0.85 3.01 12.50 43 1.61 1.39 4.74 7 13 0.00 0.00 0.00 33 1.05 2.53 12.50 76 2.10 1.83 9.23 8 23 0.55 2.57 12.62 32 2.98 3.53 12.50 101 3.25 2.19 13.93 9 44 0.32 1.44 9.38 31 3.88 4.25 15.73 129 4.06 2.60 16.30 10 70 1.68 4.83 25.00 29 3.24 3.83 15.63 220 3.99 3.62 29.42 11 163 0.84 2.96 16.65 38 3.40 2.94 12.50 560 3.23 3.08 27.62 12 522 0.60 2.76 25.00 36 2.74 2.34 8.42 8,797 3.38 2.97 29.97 13 12,151 1.07 3.60 26.56 37 3.14 3.76 15.97
14 47 2.97 3.76 16.76
15 82 2.97 4.21 16.89
16 124 2.59 3.61 17.71
17 333 2.58 3.80 27.27
18 1,090 2.11 3.72 27.27
19 24,921 3.30 4.25 32.08
Total1)25,390 0.40 1.05 5,862 0.27 1.58 5,366 2.50 2.68 13,008 0.72 2.01 26,928 2.14 2.93 10,085 1.88 2.01 1) Animals in base population (generation 0) were added to total number of animals.
2) Minimum inbreeding coefficient was 0 for all generations and farms.
Table 3. Proportion of individuals (%) with inbreeding coefficients greater than zero.
Generation Farm
A B C D E F
0 0.0 0.0 54.5 0.0 0.0 0.0
1 0.0 0.0 75.8 0.0 0.0 0.0
2 2.5 0.0 75.4 0.0 33.3 4.3
3 10.0 1.8 84.8 0.0 0.0 13.9
4 17.1 3.6 0.0 0.0 13.5
5 27.6 20.0 7.1 40.5
6 29.7 0.0 9.1 79.1
7 0.0 33.3 81.6
8 4.3 68.8 86.1
9 11.4 87.1 89.9
10 14.3 75.9 80.5
11 12.9 81.6 72.0
12 9.0 72.2 72.7
13 14.8 75.7
14 68.1
15 62.2
16 59.7
17 53.5
18 44.7
19 69.2
Fig. 1. Pattern I, average inbreeding coefficients (%) and proportion of animals (%) with inbreeding coefficients greater than zero.
Fig. 2. Pattern II, average inbreeding coefficients (%) and proportion of animals (%) with inbreeding coefficients greater than zero.
Table 4. The rates of increase in inbreeding coefficients, ΔFt, ΔF and effective population size (Ne).
Generation Farm
A B C D E F
1 0.00 0.00 1.14 0.00 0.00 0.00
2 0.08 0.00 0.30 0.00 4.17 1.09
3 0.34 0.45 0.37 0.00 -4.35 -0.70
4 0.07 0.44 0.00 0.00 -0.01
5 0.27 5.00 0.89 0.54
6 0.30 -5.26 -0.04 0.70
7 0.00 0.20 0.49
8 0.55 1.95 1.18
9 -0.23 0.93 0.84
10 1.36 -0.67 -0.08
11 -0.85 0.17 -0.79
12 -0.24 -0.68 0.15
13 0.47 0.41
14 -0.18
15 0.00
16 -0.38
17 -0.02
18 -0.48
19 1.22
△F(%) 0.177 0.222 0.603 0.061 0.165 0.285
Ne 282.3 225.5 83.0 814.8 302.9 175.7
∑=Δ
= −
Δ tn Ft
F n 2
1
1 , where nis the number of generation for each breed and farm, ΔF=(FtFt−1) (/1−Ft−1) and Ft is the average inbreeding coefficient of individuals born in generation t (Falconer 등, 1996).
Effective population size, Ne F
= Δ 2
1 (Falconer등, 1996).
ΔF 비율이 가장 낮은 D 종돈장의 경우, 세대수는 13세대이 며 세대별 근교계수 증가비율은 -5.26%~5.00% 범위이 다. 이 종돈장은 근교계수 증가비율이 특정 세대에서 큰
폭으로 상승하지만(ΔF5) 다시 큰 폭으로 감소하고(ΔF6), 전 반적으로 ΔFt의 증가와 감소를 반복하는 특징을 가져 ΔF가 상쇄된 것으로 관찰되었다. 다시 말하면, 지속적으로 외부
종돈을 집단에 도입 함으로 적절한 근교계수를 유지한 것 으로 사료된다.
ΔF를 통해 계산된 6개 종돈장의 유효집단 크기(Ne)는 각 각 282, 226, 83, 815, 303, 176 두로 분석되었다. Ne는 ΔF의 역수로 계산되기 때문에 C종돈장의 Ne가 83두로 가 장 낮으며, D 종돈장의 Ne가 815두로 가장 높았다. Ne 적정 크기에 대해선 아직까지도 명확하진 않지만, 일반적으로 단기적으로 집단을 유지하기 위한 최소 Ne는 50, 장기적인 유지를 위한 Ne는 500으로 권장하고 있다(Braude와 Low, 2010).
IV. 요 약
본 연구는 국내 주요 두록 종돈장의 혈통자료를 이용하 여 근교수준과 유효집단 크기를 추정하기 위해 수행하였 다. 혈연관계를 가지기 시작한 1987년부터 2013년까지 총 86,639두의 혈통자료를 최종적으로 이용하여 6개 종돈장 의 세대별 근교계수 및 유효집단크기를 추정하였다. 종돈 장별 세대에 따른 근교계수 변화는 2가지 패턴으로 조사되 었으며, 근교계수 평균은 5% 이내로 적절한 수준을 유지하 는 것으로 사료된다. 유효집단 크기는 종돈장별 다양한 차 이를 보였지만 모든 종돈장이 최소권장수준인 50두 이상으 로 유지하는 것으로 분석되었다. 대부분의 종돈장이 낮은 근교수준을 유지하는 것으로 조사되었는데, 근교계수를 고 려한 교배관리와 외부 종돈 도입이 주된 원인이라 사료된 다. 외부 종돈을 수입해서 도입하는 경우, 집단의 유전적 다양성은 증가할 수 있지만, 향후 국제적 종자주권 행사에 는 불리한 상황이 될 수 있다. 특히 나고야의정서의 ABS (Access, Benefit, Sharing) 규정(2010)에 따라 유전자원 을 제공하는 업체나 국가가 종자 주권 행사에 유리하도록 전개되고 있다. 그리고 업체상호 간 계약합의가 국제거래 규약의 효력을 가지기 때문에 정액, 자손 등 종자의 사후활 용에 대해서도 로열티를 요구할 수 있다. 따라서 유효집단 크기를 높이기 위한 방법으로 무분별한 수입보다는 국내 종돈장 사이에서 우수 종돈을 공유하는 것이 필요할 것으 로 사료된다.
참 고 문 헌
Convention on Biological Diversity. 2010. An Introduction to the Nagoya Protocol on ABS.
Falconer, D. S., Trudy, F. C. Mackay., 1996. Introduction to quanitative genetics, 4th edition. Prentice Hall. London.
Golden, B. L., Snelling, W. M. & Mallinckrodt, C. H., 1992.
Animal breeder’s tool kit user’s guide and reference manual. Colorado State Univ. Agric. Exp. Sta. Tech. Bull.
LTB 92-2.
Harmon LJ, Braude S. Conservation of small populations:
Effective population size, inbreeding, and the 50/500 rule.
In An Introduction to Methods and Models in Ecology and Conservation Biology. 2010. Edited by Braude S, Low SB.
Princeton, New Jersey, USA. Princeton University Press, 125-138.
Henderson, C. R., and R. L. Quaas. 1976. Multiple trait evaluation using relatives’ records. Journal Of Animal Science.
43:1188-1197.
Mandal Ajoy., K. P. Pant., P. K. Rout., R. Roy. 2004. Effects of inbreeding on lamb survival in a flock of Muzaffarnagari sheep. Asian-Aust. Journal Of Animal Science.
17(5):594-597.
Meuwissen, T., Z. Luo., 1992. Computing inbreeding coefficients in large populations. Genetics Selection Evolution Journal.
24(4):305-313.
NSIF. 1987. Guidelines for Uniform Swine Improvement Pro- grams. (Ed. C. J. Christians) National Swine Improvement Federation/Sci. Education Admin./USDA/National Pork Producers Council, Des Moines, IA.
Quinton, M., C. Smith., M. E. Goddard. 1992. Comparison of selection methods at the same level of inbreeding. Journal Of Animal Science. 70:1060-1067.
Sidong Kim., Agapita Salces., Hongrip Min., Kwanghyun Cho and Heebal Kim., 2006. Inbreeding Levels and Pedigree Structure of Landrace, Yorkshire and Duroc Populations of Major Swine Breeding Farms in Republic of Korea. Asian- Aust. Journal Of Animal Science. 19(9):1217-1224.
Singh, M. K., M. Gurnani. 2004. Performance evaluation of Karan Fries and Karan Swiss Cattle under closed breeding system. Asian-Aust. Journal Of Animal Science. 17(1):1-6.
Sjödin P, Kaj I, Krone S, Lascoux M, Nordborg M. 2005. On the meaning and existence of an effective population size.
Genetics, 169:1061-1070.
Smith, C. 1988. Selection of egg laying chickens as juveniles on the average genetic merit of their parents. Poult. Science.
67: 1655-1657.
Wright S. 1931. Evolution in Mendelian populations. Genetics, 16:97-159.