1)
†To whom correspondence should be addressed.
National Academy of Agricultural Science, RDA E-mail: [email protected]
시설원예단지와 논습지의 육상곤충 다양성 비교분석
손진관・공민재・강동현・강방훈
*・ 윤성욱・이시영†
농촌진흥청 국립농업과학원
*농촌진흥청 기획재정담당관실
The Comparative Studies on the Terrestrial Insect Diversity in Protected Horticulture Complex and Paddy Wetland
Son, Jin-Kwan・Kong, Min-Jae・Kang, Dong-Hyeon・Kang, Bang-hun
*・Yun, Sung-Wook・Lee, Si-Young
†National Institute of Agricultural Sciences
*
Planning & Budget Officer, Rural Development Administration
(Received : 09 August 2016, Revised: 25 October 2016, Accepted: 25 October 2016)
요 약
농업생태계는 본래 가졌던 식량생산 이외에도 수질정화, 생물서식처, 대기정화, 토양보전, 경관창출 등 다양한 서비스를 제공하는 공간으로 평가 받는다. 농업경관에서 시설원예단지 조성은 불투수면적 확장과 생물서식처 손실로 인해 생태계서비 스 기능저하의 원인이 될 수 있다고 평가된다. 따라서 본 연구는 시설원예단지가 조성 된 상태와 논생태계의 곤충다양성을 비교하고자 하였다. 연구대상지는 시설원예단지 분포현황을 고려해 단동형온실, 연동형온실, 유리온실로 구분하고, 논 4개소와 비교하였다. 조사 지역은 구미, 부여, 진주, 김제 등으로 선정하였다. 본 조사에서 채집된 종은 9목 38과 76속 80종으로 총 2333개체가 채집되었다. 목 조성은 노린재목 22.37%, 딱정벌레목 18.42%, 벌목 14.47%, 메뚜기목 11.84%, 파리목 10.53%, 나비목 10.53% 등으로 구분된다. 채집 종의 평균은 논(39.4종)> 단동형온실(35.5종)> 연동형온실(22.5종)>
유리온실(24.0종)의 순이다. 다양성지수(H`)는 논(4.76)> 단동형온실(4.57)>연동형온실(4.12), 유리온실(4.12) 순이다. 종 풍부도지수(RI)는 논(7.72)과 단동형온실(7.03)> 연동형온실(4.99)과 유리온실(5.32) 순이다. 연구결과 시설원예단지 조성 시 곤충의 생물다양성 기능이 떨어지는 것을 알 수 있다. 유리온실과 연동형비닐하우스 보다 단동형 비닐하우스가 곤충 다양성에는 유리하다. 시설원예단지 조성 시에는 곤충의 서식처를 창출 할 필요가 있다.
핵심용어 : 생태계서비스, 생물다양성, 농업경관, 온실
Abstract
Agricultural ecosystem is recognized as a space for providing a variety of services, in addition to the food production that it originally encompassed, such as water purification, biological habitat, air purification, soil conservation, and landscape development. The construction of greenhouses in agricultural landscapes can cause deterioration of ecosystem services because of the increase of impermeable area and loss of biological habitats. This study aimed to compare insect diversity between different types of constructed greenhouses and paddy ecosystems. The target study area was selected by considering the distribution status of horticultural complexes and was classified as Single Vinyl Greenhouse, Multi Vinyl Greenhouse or Glass Greenhouse and they were compared with four paddies. The study locations were in Gu-Mi, Bu-Yeo, Ginje and Jin-Ju.
A total of 2,333 individual insects belonging to 9 orders, 38 families, 76 genus, and 80 species were collected. The composition of orders was Hemiptera (22.37%), Coleoptera (18.42%), Hymenoptera (14.47%), Orthoptera (11.84%), and Diptera (10.53%). The average number of collected species were in the order Paddy (39.38 species) > Single Vinyl Greenhouse (35.50 species) > Multi Vinyl Greenhouse (22.50 species) > Glass Greenhouse (24.00 species). The Diversity Index (H′) was Paddy (4.76) > Single Vinyl Greenhouse (4.57) > Multi Vinyl Greenhouse (4.12), and Glass Greenhouse (4.12). The Richness Index (RI) was Paddy (7.72) and Single Vinyl Greenhouse (7.03) > Multi Vinyl Greenhouse (4.99) and Glass Greenhouse (5.32).
From our results, it can be seen that the biological diversity features of insects decreased when greenhouses are constructed.
However, Single Vinyl Greenhouse is noted to promote insect diversity more than that by Multi Vinyl Greenhouse and Glass Greenhouse. Hence, when constructing greenhouses, it is necessary to consider insect habitat to conserve insect diversity.
Key words : Ecosystem Service, Biodiversity, Agricultural Landscape, Greenhouse
1. 서 론
인간이 생태계로부터 제공받는 다양한 기능을 일컬어 생태 계서비스라 하며(Daily, 1997; Palmer et al. 2004), 이것은 자연과 인간의 연관성, 경제적 혜택 등으로 정의된다(Lee, 2013; Odum, 1959; Vihervaara et al., 2010). 국내 농업생태 계(Agricultural Ecosystem)는 국토면적의 약 23%를 차지하 는 곳으로 국가 생물다양성에 있어서도 중요한 공간으로 평가 된다(Kang, 2009). 농업생태계의 주요 기능은 식량생산과 공 급이지만 홍수조절, 생물서식처, 기후완화, 토양보전, 경관창 출, 수질정화 등 다양한 서비스를 제공하는 공간으로 평가받는 다(Power, 2010; Kim and Oh, 2003; Kim, 2005; Kong, 2013; Lee et al., 2003; Son et al., 2015). 하지만 화학비료사 용, 단일작물 재배, 비점오염 증가, 토지이용의 급격한 변화 등은 다양한 공익적 기능을 제공하는 농업생태계에 위협요인 이 된다(Kim, 2005; Son et al., 2015).
그 중 시설원예단지 조성은 농산물의 부가가치를 상승시켜 백색혁명이라 불릴 만큼 농업의 주요 기술로 자리하고 있지만 (GDI, 2009; Kang et al., 2015), 불투수 면적으로의 전환은 앞서 거론한 바와 같은 농업생태계의 다양한 공익적 기능이 저하되는 원인이 된다(Palmer et al. 2004; Son et al., 2015).
이러한 토지이용변화에 따른 생물다양성에 미치는 영향을 분석 하는 것은 주요한 과제이며(Dunning et al., 1992; Bestelmeyer et al., 2003), 어떤 서식처에서 면적과 종이 밀접한 상관관계로 설명되는 것과 같이(Holt et al., 1999), 특정 토지이용과 생물다 양성 사이의 연관성은 연구를 통해 찾아 낼 수 있다(Gustafson, 1998; Tischendorf, L, 2001; Turner et al., 2001).
세계적으로 지난 50여 년간 농업과 임업의 발달은 서식처의 감소를 야기 시켰으며(Kang, 2009), 그로인해 생물다양성 또한 현저히 감소되고 있는 것으로 평가된다. 다양한 생물 분류군 중 곤충은 지구상에 100만종이 넘게 기재되어 있으며, 먹이 연쇄에 중요한 위치를 차지하는 분류군으로 최근 들어 중요성이 부각되고 있다(Gullan and Cranston, 2005; Park, 2012). 이
뿐만 아니라 생태계의 에너지대사, 영양소순환 등의 역할을 수행 하며(Odum et al,1962), 화분매개로 인한 식물다양성 유지에 없어서는 안 될 중요한 역할을 수행하는 것으로 평가된다(Park, 2012). 우리나라에는 503과 14,188종이 보고되어 있고, 이것 은 한반도 서식 곤충의 약 16~20% 정도로 추정한다(Kim et al.,2010; Park, 2012). 일반적으로 곤충은 주변 환경과 밀접한 관계를 나타내고 곤충에 대한 조사, 해당 생태계의 환경 질을 측정 할 수 있는 기준으로 활용 할 수 있다(KNPS, 2006).
또한 육상곤충에 대한 지속적인 조사, 평가는 해당 생태계에 대한 변화를 예측할 수 있는 중요 자료로 활용 가능하다(Park, 2012).
따라서 본 연구는 농업생태계에서 다양한 중요한 생태계서 비스 기능을 수행하고 있는 논습지의 육상곤충을 조사하고, 이곳과 비교 할 수 있는 비슷한 면적의 시설원예단지의 육상 곤충과 비교하고자 하였다. 시설원예단지는 단동형온실, 연 동형온실, 유리온실로 구분하였다. 연구를 통해 논습지와 시설원예단지의 곤충다양성에 대한 비교를 실시하고 시설원 예단지 유형에 따른 곤충의 종 다양성에 어떠한 영향을 미치 는지 알아보았다. 연구결과는 시설원예 농업의 환경적, 생태 적 문제점 거론과 지속가능한 농업경관 제공을 위해 실시되 었으며, 연구결과를 활용하여 생태적 온실단지 조성을 제안 하고자 하였다. 이러한 연구결과들을 취합하여 새만금 등 대 규모 간척지 개발 사업에 친환경, 생태적인 시설원예단지가 조성 될 수 있도록 예산배정 등 국가 정책자료에 활용되길 기대한다.
2. 조사 및 분석방법
2.1 연구대상지
연구대상지는 농림축산식품부(2015)에서 발간한 ‘2014 시 설채소 온실현황 및 채소류 생산실적’을 고려해 시설원예단 지 유형을 단동형비닐하우스(Single Vinyl Greenhouse), 연 동형비닐하우스(Multi Vinyl Greenhouse), 유리온실(Glass
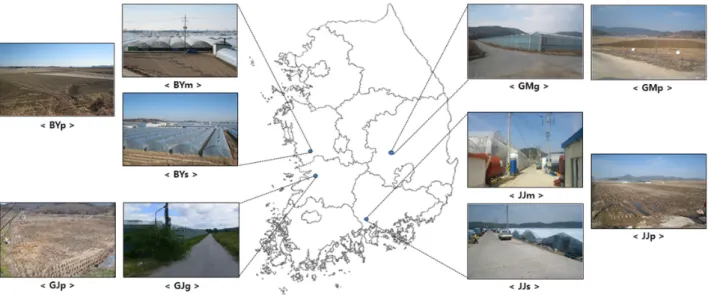
Fig. 1. The location of study sites.
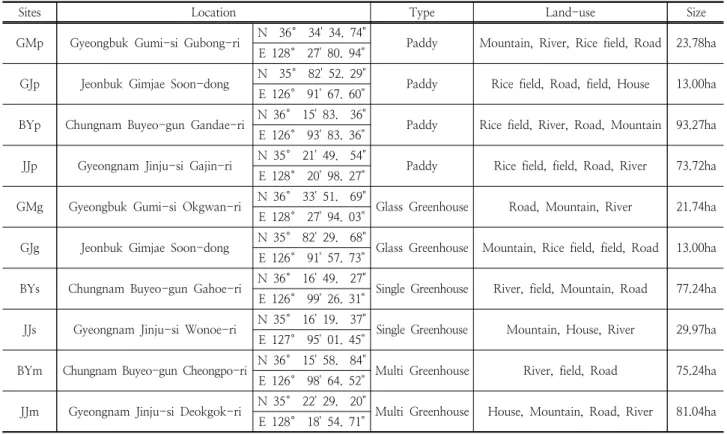
Greenhouse)로 구분하였다. 시설원예단지 이전의 토지이용 은 대부분 논이었으므로 시설원예 대상지와 면적이 비슷한 논(Paddy)을 인접하게 선정하여 비교하였다. 지역 분포는 부여(BY), 진주(JJ), 구미(GM), 김제(GJ) 등 4개 지역을 중 심으로 조사하였다(Table 1; Fig. 1).
2.2 조사 및 분석방법
육상곤충의 조사는 2015년 5월(First)과 9월(Second)로 구분하여 연구대상지 별로 2회 씩 실시하였다. 육상곤충의 현지조사는 쓸어잡기법(sweeping)을 각 조사 대상지역 당 3지점 3반복씩 총 9회 정량채집 하였으며, 연구대상지별로 지역을 선정하여 최대치의 다양성을 확인할 수 있도록 하 였다. 채집되거나 관찰된 종은 한국곤충 총 목록(Baek et al, 2010)과 한국동물명집(KOSZ, 1997)을 이용하여 현장 에서 동정 및 계수하여 군집분석 하였으며, 미 동정종은 Ethyl alcohol에 고정하여 실험실로 운반하여 동정하였다.
군집분석은 우점도지수(Dominance Index; McNaughton, 1967), 다양도지수(Diversity Index; Pielou, 1969), 풍부도 지수(Species Richness Index; Margalef, 1958), 균등도지 수(Evenness Index; Pielou, 1975) 실시하였다(Table 2).
통계분석은 SPSS 19.0을 이용하여 출현종과 개체수에 따라 유형별로 차이분석을 실시하고 군집분석결과에 대해서도 동일하게 실시하였다.
3. 결과 및 고찰
3.1 연구대상지 출현 곤충상 일반현황
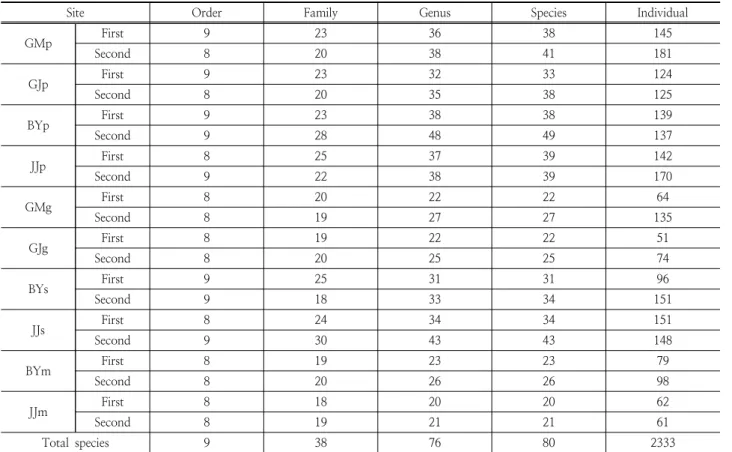
본 조사에서 채집된 종은 9목 38과 76속 80종으로 총 2,333개체가 채집되었으며(Table 3.), 종조성은 일반적으로 농업생태계에서 많이 출현하는 노린재목(Hemiptera)과 딱 정벌레목(Coleoptera)이 우세하게 출현하는 것으로 분석되 었다(Choi et al.2007; Kang, 2009).
Table 1. The present condition of 10 study sites.
Sites Location Type Land-use Size
GMp Gyeongbuk Gumi-si Gubong-ri N 36° 34' 34. 74"
Paddy Mountain, River, Rice field, Road 23.78ha E 128° 27' 80. 94"
GJp Jeonbuk Gimjae Soon-dong N 35° 82' 52. 29"
Paddy Rice field, Road, field, House 13.00ha E 126° 91' 67. 60"
BYp Chungnam Buyeo-gun Gandae-ri N 36° 15' 83. 36"
Paddy Rice field, River, Road, Mountain 93.27ha E 126° 93' 83. 36"
JJp Gyeongnam Jinju-si Gajin-ri N 35° 21' 49. 54"
Paddy Rice field, field, Road, River 73.72ha E 128° 20' 98. 27"
GMg Gyeongbuk Gumi-si Okgwan-ri N 36° 33' 51. 69"
Glass Greenhouse Road, Mountain, River 21.74ha E 128° 27' 94. 03"
GJg Jeonbuk Gimjae Soon-dong N 35° 82' 29. 68"
Glass Greenhouse Mountain, Rice field, field, Road 13.00ha E 126° 91' 57. 73"
BYs Chungnam Buyeo-gun Gahoe-ri N 36° 16' 49. 27"
Single Greenhouse River, field, Mountain, Road 77.24ha E 126° 99' 26. 31"
JJs Gyeongnam Jinju-si Wonoe-ri N 35° 16' 19. 37"
Single Greenhouse Mountain, House, River 29.97ha E 127° 95' 01. 45"
BYm Chungnam Buyeo-gun Cheongpo-ri N 36° 15' 58. 84"
Multi Greenhouse River, field, Road 75.24ha E 126° 98' 64. 52"
JJm Gyeongnam Jinju-si Deokgok-ri N 35° 22' 29. 20"
Multi Greenhouse House, Mountain, Road, River 81.04ha E 128° 18' 54. 71"
Table 2. The analysis method of environment evaluation
Analysis Method Explanation
Dominance Index
(McNaughton, 1967) DI = (n1 + n2) / N n1, n2 : 1,2 Number of individuals Dominant Species, N : Number of Total Species
Diversity Index (Shannon Index, H' 1963)
s
H' = -Σ [ (ni/N)․ln(ni/N) ] i=1
ni : i Number of individuals Dominant Species, N : Total Number of Species
Evenness Index
(Pielou, 1975) E' = H' / InS E' : Evenness Index, H' : Diversity Index, S : Total number of species
Richness Index
(Margalef, 1958) RI = (S – 1) / In(N) RI : Richness Index, N : Total Number of Species, S : Total number of species
분류군별 출현한 종수는 총 80종 중 노린재목(Hemiptera) 17종(22.37%), 딱정벌레목(Coleoptera) 14종(18.42%), 벌목 (Hymenoptera) 11종(14.47%), 메뚜기목(Orthoptera) 9종 (11.84%), 파리목(Diptera) 8종(10.53%), 나비목(Lepidoptera) 8종 (10.53%), 잠자리목(Odonata) 4종(5.26%), 매미목(Orthoptera) 3종(3.95%), 집게벌레목(Dermaptera) 2종(2.63%) 순으로 조 사되었다. 분류군별 출현한 개체수는 총 2333개체 중 노린재 목 787개체(33.73%), 딱정벌레목 498개체(21.35%), 나비목 340개체(14.57%), 메뚜기목 184개체(7.89%), 벌목 164개체 (7.03%), 파리목 156개체(6.69%), 잠자리목 143개체(6.13%), 매미목 42개체(1.80)%, 집게벌레목 19개체(0.81%)로 조사되 었다. 이것은 동강일대(Park et al., 2014), 공단지역 농경지 (Choi et al., 2007), 주남습지(Ahn and Park, 2012)와 유사 한 경향으로 일반적인 국내 육상곤충 출현양상으로 판단할 수 있다(Appendix 1.).
조사대상지 유형별 출현 종과 개체수에 대한 1회 조사 결
과는 육상곤충은 논이 39.38±4.50종 145.38±20.25개체, 유리온실 24.00±2.45종 81.00±37.21개체, 단동형온실 35.50±5.20종 136.50±27.04개체, 연동형온실 22.50±2.65 종 75.00±17.42개체로 분석되었다. 이것을 통계적으로 분 석한 결과 논과 단동형온실 유형이 유리온실과 연동형온실 유형에 비해 종다양성과 개체수가 높게 분석된다는 것을 99.99%의 유의수준으로 확인 할 수 있었다. 따라서 농업생 태계의 육상곤충 종 다양성을 위해서는 유리온실과 연동형 온실의 곤충서식처를 위한 공간배치 필요성이 인정되었다 고 판단된다(Table 4).
목별 출현종의 양상에 대한 유형별 ANOVA분석 결과 노린재목이 논에서 9.13±1.36종 조사된 반면 유리온실, 단 동형온실, 연동형온실에서 5.50~6.75종이 조사되어 99%
이내에서 통계적 유의성을 확인하였다. 이 외에도 잠자리 목, 집게벌레목, 파리목 또한 논에 비해 시설원예단지의 곤 충 종 다양성이 낮음을 통계적으로 확인 할 수 있었다. 시
Table 3. The number of insect species and individual at 10 study sites
Site Order Family Genus Species Individual
GMp First 9 23 36 38 145
Second 8 20 38 41 181
GJp First 9 23 32 33 124
Second 8 20 35 38 125
BYp First 9 23 38 38 139
Second 9 28 48 49 137
JJp First 8 25 37 39 142
Second 9 22 38 39 170
GMg First 8 20 22 22 64
Second 8 19 27 27 135
GJg First 8 19 22 22 51
Second 8 20 25 25 74
BYs First 9 25 31 31 96
Second 9 18 33 34 151
JJs First 8 24 34 34 151
Second 9 30 43 43 148
BYm First 8 19 23 23 79
Second 8 20 26 26 98
JJm First 8 18 20 20 62
Second 8 19 21 21 61
Total species 9 38 76 80 2333
Table 4. The statistical analysis of insect species and individual at study site type
Classification Paddy Glass Single Multi
F post-hoc
Mean S.D Mean S.D Mean S.D Mean S.D
Order 8.63b 0.52 8.00a 0.00 8.75b 0.50 8.00a 0.00 4.42* G,M < P,S
Family 23.00ab 2.62 19.50a 0.58 24.25b 4.92 19.00a 0.82 3.79* M,G < P < S
Genus 37.75b 4.62 24.00a 2.45 35.25b 5.32 22.50a 2.65 17.91*** M,G < S,P
Species 39.38b 4.50 24.00a 2.45 35.50b 5.20 22.50a 2.65 22.42*** M,G < S,P
Individual 145.38b 20.25 81.00a 37.21 136.50b 27.04 75.00a 17.42 10.64*** M,G < S,P
*Test result is statistically significant at the P = 0.05 level( * ), 0.001 level( *** ), N.S = Not significant result.
설원예단지 유형별로는 유리온실 유형이 목별 출현양상이 대부분 낮게 조사되었다(Table 5).
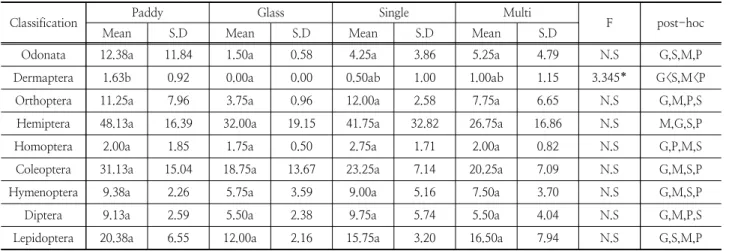
목별 출현 개채수에 대한 유형별 ANOVA분석 결과 대부 분 통계적 유의성은 확인되지 않았다. 하지만 논에서 대부분 출현개체수가 높게 조사되었고 다음으로 단동형온실 유형이 출현개체수가 높음을 알 수 있다. 반면 유리온실유형과 연동 형온실 유형은 논과 단동형온실에 비해 조사 된 개체수가 낮게 분석되었다. 조사 대상지별로 조사된 개체수의 편차가 심해 통계적 유의성은 확인되지 않았지만 시설원예단지에서 곤충 서식 정도에서 차이를 확인하였다(Table 6).
3.2 시설원예단지 유형에 따른 군집분석
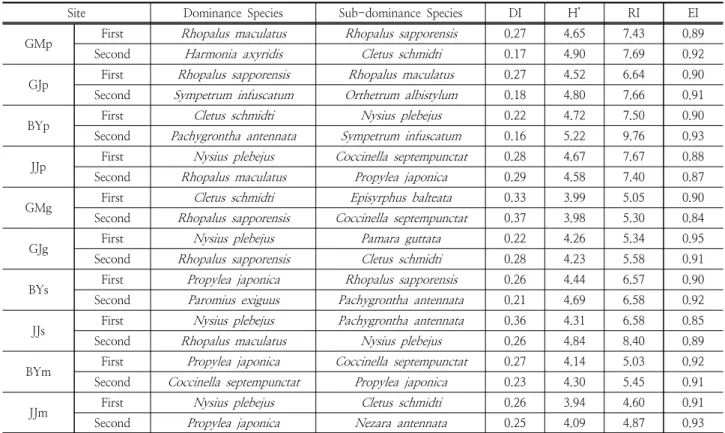
조사대상지 10개소에서 확인된 우점종과 아우점종을 분 석한 결과 애기노린재(
Nysius plebejus
)가 총 6회, 삿포로 잡초노린재(Rhopalus sapporensis
)가 5회, 우리가시허리노 린재(Cletus schmidti
, 5회), 꼬마남생이무당벌레(Propylea japonica
, 4회), 칠성무당벌레(Coccinella septempunctat
, 4회), 더듬이긴노린재(Pachygrontha antennata
, 3회), 붉은잡초 노린재(Rhopalus maculatus
, 3회) 등으로 노린재목의 노린 재류와 딱정벌레목의 무당벌레류가 주를 이루고 있음을 확인하였다. 이것은 앞서 거론한 Choi et al.(2007) 등의 연구 와 비교했을 때 우리나라의 일반적 육상곤충 출현경향으로 판단된다(Table 7).
조사대상지 유형별 군집분석 결과 우점도지수(DI)는 논이 0.23±0.05, 연동형온실 0.25±0.02, 단동형온실 0.27±0.06, 유리온실 0.30±0.06 순으로 분석되었지만 통계적으로는 유의성이 인정되지 않았으며, 균등도지수(EI) 또한 0.89∼
0.92 수준으로 유사하게 분석되어 통계적 차이는 확인되지 않았다. 하지만 종다양성지수(H’)는 논이 4.76±0.22, 단동 형온실이 4.57±0.24, 연동형온실과 유리온실이 각 4.12±0.15로 99.99% 통계적 차이가 확인되었다. 풍부도 지수(RI) 또한 논이 7.72±0.89, 단동형온실이 7.03±0.91, 유리온실이 5.32±0.22, 연동형온실리 4.99±0.36로 종다양성 지수와 같은 99.99%의 통계적 차이를 확인하였다. 이 결과는 육상곤충 다양성과 풍부도는 논에 비해 단동형온실에 따른 영향은 적으나 연동형온실과 유리온실에 미치는 영향이 크 다고 할 수 있다. 농업의 생태계서비스 기능 중 육상곤충 다양성 기능을 위해서는 연동형온실과 유리온실 형태는 단 동형온실 만큼의 육상곤충 서식처를 제공할 필요가 있다고 판단된다(Table 8).
Table 5. The statistical analysis of species numbers at study site type
Classification Paddy Glass Single Multi
F post-hoc
Mean S.D Mean S.D Mean S.D Mean S.D
Odonata 3.13b 1.13 1.00a 0.00 2.00ab 1.41 1.50a 0.58 4.930* G,M<S<P
Dermaptera 0.88b 0.35 0.00a 0.00 0.25a 0.50 0.50ab 0.58 4.825* G,S<M<P
Orthoptera 3.38a 1.19 2.00a 0.00 3.50a 0.58 2.25a 1.50 N.S G,M,S,P
Hemiptera 9.13b 1.36 5.50a 0.58 6.75a 2.22 5.50a 1.91 7.211** G,M,S<P
Homoptera 1.13a 0.99 1.00a 0.00 1.75a 0.50 1.00a 0.00 N.S G,M,P,S
Coleoptera 7.00b 1.41 4.75a 0.50 5.50ab 1.73 5.75ab 0.96 N.S G<S,M<P
Hymenoptera 5.00a 1.07 3.00a 0.82 4.50a 2.65 3.00a 0.82 N.S G,M,S,P
Diptera 4.13b 1.25 1.75a 0.96 3.25ab 1.71 2.50ab 1.29 3.346* G<M,S<P
Lepidoptera 5.63a 1.30 5.00a 0.82 4.00a 0.00 4.50a 1.29 N.S S,M,G,P
* Test result is statistically significant at the P = 0.05 level( * ), 0.01 level( ** ), N.S = Not significant result.
Table 6. The statistical analysis of individual numbers at study site type
Classification Paddy Glass Single Multi
F post-hoc
Mean S.D Mean S.D Mean S.D Mean S.D
Odonata 12.38a 11.84 1.50a 0.58 4.25a 3.86 5.25a 4.79 N.S G,S,M,P
Dermaptera 1.63b 0.92 0.00a 0.00 0.50ab 1.00 1.00ab 1.15 3.345* G<S,M<P
Orthoptera 11.25a 7.96 3.75a 0.96 12.00a 2.58 7.75a 6.65 N.S G,M,P,S
Hemiptera 48.13a 16.39 32.00a 19.15 41.75a 32.82 26.75a 16.86 N.S M,G,S,P
Homoptera 2.00a 1.85 1.75a 0.50 2.75a 1.71 2.00a 0.82 N.S G,P,M,S
Coleoptera 31.13a 15.04 18.75a 13.67 23.25a 7.14 20.25a 7.09 N.S G,M,S,P
Hymenoptera 9.38a 2.26 5.75a 3.59 9.00a 5.16 7.50a 3.70 N.S G,M,S,P
Diptera 9.13a 2.59 5.50a 2.38 9.75a 5.74 5.50a 4.04 N.S G,M,P,S
Lepidoptera 20.38a 6.55 12.00a 2.16 15.75a 3.20 16.50a 7.94 N.S G,S,M,P
* Test result is statistically significant at the P = 0.05 level( * ), N.S = Not significant result.
4. 결 론
농업생태계(Agricultural Ecosystem)는 본래 가졌던 식량 생산 이외에도 수질정화, 생물서식처, 대기정화, 토양보전, 경관창출 등 다양한 서비스를 제공하는 공간으로 평가 받는 다. 농업경관에서 시설원예단지 조성은 불투수면적 확장과 생물서식처 손실로 인해 생태계서비스 기능저하의 원인이 될 수 있다고 평가된다. 따라서 본 연구는 시설원예단지가 조성 된 상태와 논생태계의 곤충다양성을 비교하고자 하였다. 연구 대상지는 시설원예단지 분포현황을 고려해 Single Vinyl Greenhouse, Multi Vinyl Greenhouse, Glass Greenhouse 로 구분하고, Paddy 4개소와 비교하였다. 본 조사에서 채 집된 종은 9목 38과 76속 80종으로 총 2333개체가 채집되 었다. 목 조성은 노린재목 17종(22.37%), 딱정벌레목 14종 (18.42%), 벌목 11종(14.47%), 메뚜기목 9종(11.84%), 파 리목 8종(10.53%), 나비목 8종(10.53%), 잠자리목 4종 (5.26%), 매미목 3종(3.95%), 집게벌레목 2종(2.63%) 등
으로 구분된다. 논이 39.38±4.50종 145.38±20.25개체, 유리온실 24.00±2.45종 81.00±37.21개체, 단동형온실 35.50±5.20종 136.50±27.04개체, 연동형온실 22.50±2.65 종 75.00±17.42개체로 분석되었다. 종다양성지수(H’)는 논 이 4.76±0.22, 단동형온실이 4.57±0.24, 연동형온실과 유 리온실이 각 4.12±0.15로 99.99% 통계적 차이가 확인되 었다. 풍부도 지수 또한 논이 7.72±0.89, 단동형온실이 7.03±0.91, 유리온실이 5.32±0.22, 연동형온실리 4.99±0.36 로 종다양성지수와 같은 99.99%의 통계적 차이를 확인하 였다. 연구결과 시설원예단지 조성 시 곤충의 생물다양성 기능이 떨어지는 것을 알 수 있고 유리온실과 연동형비닐 하우스 보다 단동형 비닐하우스가 곤충 다양성에는 유리하 므로 시설원예단지 조성 시에는 곤충 서식처를 창출을 제 안하였다.
이러한 연구결과는 대규모 시설원예단지가 보다 친환경, 생태적으로 조성 될 수 있도록 하는 국가 정책자료에 활용 할 수 있을 것으로 기대한다.
Table 7. The various community analysis at 10 study sites
Site Dominance Species Sub-dominance Species DI H’ RI EI
GMp First
Rhopalus maculatus Rhopalus sapporensis
0.27 4.65 7.43 0.89Second
Harmonia axyridis Cletus schmidti
0.17 4.90 7.69 0.92GJp First
Rhopalus sapporensis Rhopalus maculatus
0.27 4.52 6.64 0.90Second
Sympetrum infuscatum Orthetrum albistylum
0.18 4.80 7.66 0.91BYp First
Cletus schmidti Nysius plebejus
0.22 4.72 7.50 0.90Second
Pachygrontha antennata Sympetrum infuscatum
0.16 5.22 9.76 0.93JJp First
Nysius plebejus Coccinella septempunctat
0.28 4.67 7.67 0.88Second
Rhopalus maculatus Propylea japonica
0.29 4.58 7.40 0.87GMg First
Cletus schmidti Episyrphus balteata
0.33 3.99 5.05 0.90Second
Rhopalus sapporensis Coccinella septempunctat
0.37 3.98 5.30 0.84GJg First
Nysius plebejus Pamara guttata
0.22 4.26 5.34 0.95Second
Rhopalus sapporensis Cletus schmidti
0.28 4.23 5.58 0.91BYs First
Propylea japonica Rhopalus sapporensis
0.26 4.44 6.57 0.90Second
Paromius exiguus Pachygrontha antennata
0.21 4.69 6.58 0.92JJs First
Nysius plebejus Pachygrontha antennata
0.36 4.31 6.58 0.85Second
Rhopalus maculatus Nysius plebejus
0.26 4.84 8.40 0.89BYm First
Propylea japonica Coccinella septempunctat
0.27 4.14 5.03 0.92Second
Coccinella septempunctat Propylea japonica
0.23 4.30 5.45 0.91JJm First
Nysius plebejus Cletus schmidti
0.26 3.94 4.60 0.91Second
Propylea japonica Nezara antennata
0.25 4.09 4.87 0.93Table 8. The statistical analysis of community analysis at study site type
Classification Paddy Glass Single Multi
F post-hoc
Mean S.D Mean S.D Mean S.D Mean S.D
DI 0.23a 0.05 0.30a 0.06 0.27a 0.06 0.25a 0.02 N.S -
H` 4.76b 0.22 4.12a 0.15 4.57b 0.24 4.12a 0.15 13.95*** G,M<S,P
RI 7.72b 0.89 5.32a 0.22 7.03b 0.91 4.99a 0.36 17.21*** M,G<S,P
EI 0.90a 0.02 0.90a 0.05 0.89a 0.03 0.92a 0.01 N.S -
* Test result is statistically significant at the P = 0.001 level( *** ), N.S = Not significant result.
사 사
본 연구는 농촌진흥청 국립농업과학원 농업과학기술 연 구개발사업(과제번호:PJ010894)의 지원에 의해 이루어진 것임.
References
Ahn, SJ and Park, CG (2012). Terrestrial Insect Fauna of the Junam Wetlands Area in Korea.
J. of the Korea Appl Entomol,
51(2), pp. 111-129. [Korean Literature]Baek, MG, Hwang, JM, Jung, GS, Kim, TW, Kim, MC, Lee, YJ, Cho, YB, Park, SW, Lee, HS, Koo, DS, Jung, JC, Kim, KK, Choi, DS, Shin, YH, Hwang, JH, Lee, JS, Kim, SS and Bae, YS. (2010).
Checklist of Korean Insects,
Nature and Ecology. [Korean Literature].Bestelmeyer, BT, Brown, JR, Havstad, KM, Alexander R, Chavez G and Herrick, JE (2003). Development and use of state-and-transition models for rangelands.
J. Range Manage.
56(2), pp. 114-126.Choi, YC, Kim, JG, Choi, JY, Kim, WT, Shim, HS and Park, BD (2007). Evaluation of Farm Lands located in Urban Area and Industrial Complex using Insect Diversity Indices.
J. of the Korea Appl Entomol,
46(3), pp. 363-373.Daily, GC (1997).
What are ecosystem services. Nature's services: societal dependence on natural ecosystems.
Island Press, Washington, DC.Dunning, JB and Danielson, BJ (1992). Ecological processes that affect populations in complex landscapes.
Oikos
65, pp. 468-475.Gullan PJ and PS Cranston (2005). The insects, an outline of entomology.
3rd ed,
pp. 528 Blackwell Publ. Ltd., USA.Gustafson, EJ (1998). Quantifying landscape spatial pattern.
What is the state of the art
Ecosystems
1, pp. 143-156.Gyeongnam Development Institute (GDI) (2009). Gyeongnam horticulture development of era of low carbon green growth. Gyeongnam Development Institute, [Korean Literature]
Holt, RD, Lawton, JH, Polis GA and Martinez ND (1999).
Trophic rank and the species area relationship.
Ecology
80, pp. 1495-1504.Kang, BH, Son, JK, Lee, SH and Kim, NC (2009). The Vegetation Characteristics of Small Palustrine Wetland in Rural Area,
J. Korean Env. Res. Tech,
12(3), pp. 33-48. [Korean Literature]Kang, DH, Lee, SY, Kim, JK, Choi, HK, Park, MJ, Yeon, JS and Son, JK (2015). The Meteorological Themes Selection for the Site Selection of Protected Horticulture Complex in Saemanguem.
Protected Horticulture and Plant Factory,
24(4), pp. 1-9.
Kim, JH (2005).
Ecological land use planning considering the characteristics of urban ecosystem - a case study of Hanam, Kyeonggi province
, Dissertation of University of Seoul. pp.271. [Korean Literature]
Kim, SS and Oh, SI (2003) Valuation of The Multifunctionality of Agriculture, J. of Korea rural economic institute, 26(2), pp. 47-58. [Korean Literature]
Kong, MJ. (2013) Value assessment of the paddy field by cultivation methods according to wetland function assessment system. Graduate School of Dongkook University. Master's thesis. [Korean Literature]
Korea National Park Service(KNPS) (2006). The Research of Natural Resources in Hallyeohaesang National Park, Korea National Park Service. [Korean Literature]
Korea Society of Systematic Zoology(KOSZ) (1997). List of animals in Korea. Academy Books. Korea Society of Systematic Zoology. [Korean Literature]
Lee, KB, Kim, CH, Kim, JG, Lee, DB, Lee, SB and Na, SY (2003).
How Soil Characteristics and Vegetation Influence the Inflow of Sewage in a Tributary of the Mankyeong River,
Published by the Institute for Environmental Science
, 12, pp. 9-21.[Korean Literature]Lee, MS (2013).
Development and Application of Assessment Model for Urban Green Ecosystem Services : Focusing on Urban Cemeteries in Seoul
. Ph.D. Dissertation, Dongkook University, Youngin-si, Korea. [Korean Literature]Margalef, R (1958). Information theory in ecology.
Gen. Syst.,
3, pp. 36-71.McNaughton, SJ (1967). Relationship among functional properties of California Glassland.
Nature,
216, pp.168-144.
Ministry of Agriculture, Food and Rural Affairs(MAFRA) (2014).
2014 Vegetable greenhouse Status and Vegetable production performance,
Ministry of Agriculture, Food and Rural Affairs. [Korean Literature]Odum, EP, Connell, CE and Davenport, LB (1962). Population energy flow of three primary consumer components of old field ecosystems,
Ecology
43(1), pp. 88-96.Odum, EP, (1959). Fundamentals of ecology, Philadelphia:
W.B.
Saunders Company
, pp. 546.Palmer, ME., Bernhardt, E., Chornesky, S., Collins, AP., Dobson, C,. Duke, B., Gold, R., Jacobson, S., Kingsland, R,. Kranz, M., Mappin, ML,. Martinez, F., Micheli, J., Morse, M., Pace, M., Pascual, S., Palumbi, OJ., Reichman, A., Simons, A., Townsend, and M., Turner (2004). Ecology for a crowded planet.
Science,
304, pp. 1251-1252.Park, J, Park, SJ, Cha, JY and Park, JK (2014). Terrestrial Insect Diversity of the Donggang River in Korea.
J. of Wetlands Research,
16(3), pp. 337-346. [Korean Literature]Park, JD (2012).
Comparative Community Structure of
Terrestrial Insect between areas in Hallyohaesang National Park.
Master’s Thesis, Changwon University ,Changwon, Korea. [Korean Literature]Park, KL, Kong, MJ, Kim, NC and Son, JK (2012). The Analysis of Vegetation Characteristics of Organic Rice Paddy for Value Assessment of the Rice Paddy Wetland.
J.
of Wetlands Research,
14(1), pp. 59-73. [Korean Literature]Pielou (1969). Shannon's formula as a measure of specific diversity: its use and misuse.
Amer. Nat.,
100, pp. 463-465.Pielou, E.C. 1975. Ecological diversity. New York, John Wiley.
Powe, AG (2010). Ecosystem services and agriculture : tradeoffs and synergies.
Philos Trans R SocB
, 365, pp. 2959-2971.Son, JK, Kong, MJ, Kang, DH, Nam, HS and Kim, NC. (2015).
The Comparative Studies on the Urban Park and Rural Landscape for the Improvement Ecosystem Service Function in Pond Wetland.
J. of Wetlands Research,
17(1), pp. 62-74. [Korean Literature]Tischendorf L (2001). Can landscape indices predict ecological processes consistently.
Landsc. Ecol,
16, pp. 235–254.Turner DG, Gary W, Marianne G and David F (2001).
Characteristics Of The Variable Star P Cygni Determined From Cluster Membership.
JAAVSO,
29.Vihervaara, P, Raunkiaer, M and Walls, M (2010). Trends in ecosystem service research : early steps and current drivers.