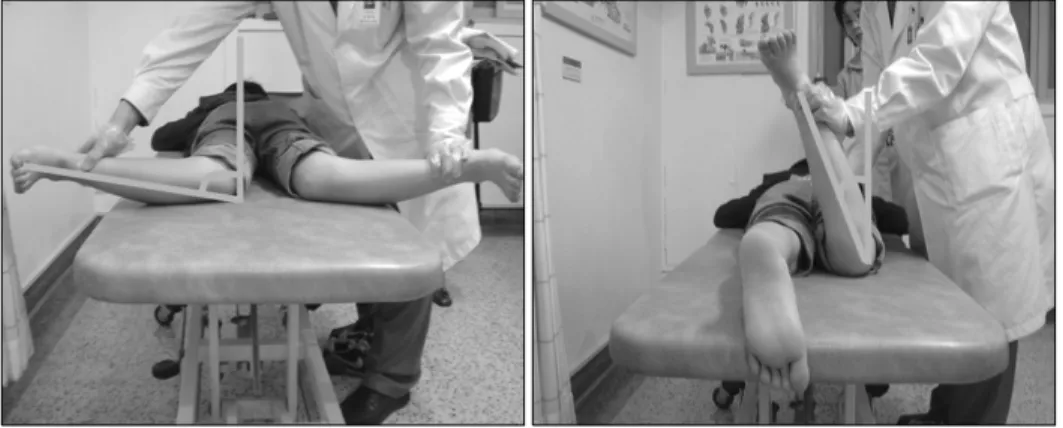
Physical Examination and Computed Tomography in Children with Toe in Gait
6
0
0
전체 글
(2)
(3)
(4)
(5)
(6)
수치

관련 문서
