Effect of Customized Fertilizer Application and Soil Properties on Amino Acids Composition in Rice Grain
Jwakyung Sung, Yejin Lee, Hyenjung Chun
1, Sangkeun Ha, Yeonkyu Sonn, and Jongsik Lee
2* Division of Soil and Fertilizer, NAAS, RDA, Wanju, 55365, Korea
1
Division of Crop Production Technology, NICS, RDA, Miryang, 50424, Korea
2
Division of Climate Change and Agroecology, NAAS, RDA, Wanju, 55365, Korea
(Received: July 6 2015, Revised: October 12 2015, Accepted: October 13 2015)
Our government has performed to support the nation-wide application of customized fertilizer based on soil-testing results and crop nutrient balance in order to promote the environment-friendly agriculture and to respond the global environment guide-line since 2010. This study was performed at the selected local paddy fields (Hwaseong-si, Uiseong-gun and Miryang-si) with different soil chemical properties in 2012. The contents of amino acids measured showed an increasing trend with fertilization, and glutamic acid was the most abundant amino acid followed by aspartic acid, leucine and alanine. However, valine, isoleusine, tyrosine and lysine were not significantly affected by fertilization. The significant differences in grain N, expressed as a crude protein, and amino acids dose was observed between experimental sites (p<0.001), treatments (p<0.01 to 0.001) and interaction of both factors (p<0.01 to 0.001). In our experiment the following order of carbon skeleton backbones to produce amino acids was observed irrespective of experiment sites and fertilization: α-ketoglutarate > oxalate > pyruvate > 3-phosphoglycerate > phosphoenolpyruvate. In conclusion, customized fertilizer had no difference in amino acids compared to the conventional-NPK practice which was higher than in no fertilization, and also the normal paddy represented slightly higher amino acids compared to the reclaimed. Further study based on the present results is required to investigate what is main factor to amino acids between genetic and environmental factors.
Key words: Amino acids, Customized fertilizer, Rice grain
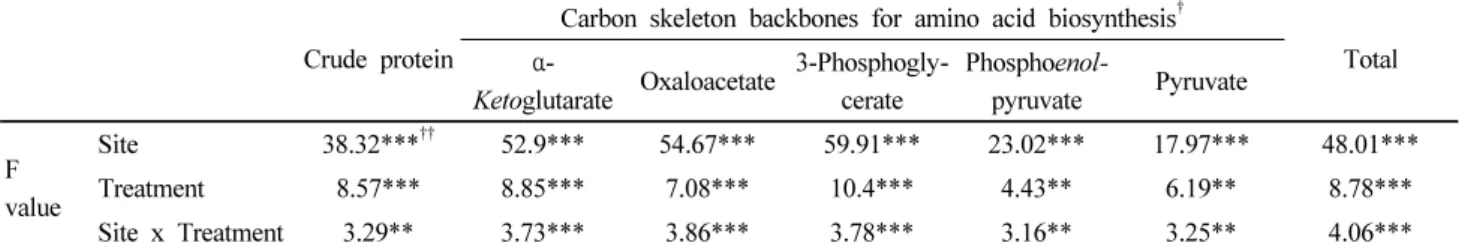
ANOVA analysis of amino acids and crude protein in rice seeds.
Crude protein (%)
Carbon skeleton backbones for amino acid biosynthesis (mg g
-1, seed)
†Total α-
ketoglutarate Oxaloacetate 3-Phosphogly- cerate
Phosphoenol-
pyruvate Pyruvate
Contents 6.48 20.5 12.0 7.6 5.6 12.0 59.7
F value
Site 38.32*** 52.9*** 54.67*** 59.91*** 23.02*** 17.97*** 48.01***
Treatment 8.57*** 8.85*** 7.08*** 10.4*** 4.43** 6.19** 8.78***
Site x Treatment 3.29** 3.73*** 3.86*** 3.78*** 3.16** 3.25** 4.06***
†
Amino acid derivatives; 1) α-ketoglutarate (Glutamate, Histidine, Arginine and Proline), 2) Oxaloacetate (Aspartate, Threonine, Isoleusine, Methionine and Lyscine), 3) 3-Phosphoglycerate (Serine, Glycine and Cystenine), 4) Phosphoenolpyruvate (Tyrosine and Phenylalanine) and 5) Pyruvate (Alanine, Leusine and Valine)
1)
*Corresponding author : Phone: +82632382484, Fax: +82632383823, E-mail: [email protected]
§
Acknowledgement : This study was supported financially by a grant from the research project (No. PJ010899) of National Academy
of Agricultural Science, Rural Development Administration, Republic of Korea.
Introduction
A healthful soil management is very important to sustain crop productivity. In particular, consumer’s needs on high quality and safety agricultural products have been increasing year by year, and thus soil mineral status-based fertilization is essential to ensure stable supply of agri- cultural products. In order to perform the law “Environment- Friendly Agriculture Promotion”, the RDA has monitored soil chemical properties by cultivation types every 4 years since 1999 (Ko et al., 2009; Kim et al., 2010a). As a result of the project, it was concluded that a scientific approach-based nutrient management was strongly required to sustain and improve soil fertility, and many studies were performed in relation to soil testing-based fertilization and an enhancement of soil fertility (Song et al., 1993;
Lee et al., 1994; Hong, 1998; Hong et al., 2009). Our government has performed to support the nation-wide application of customized fertilizer based on soil-testing results and crop nutrient balance in order to promote the environment-friendly agriculture and to respond the global environment guide-line since 2010. The customized fertilizer is different with general combined chemical fertilizers in that the amount of N, P or K is adjusted with various levels to be applied differently with soil chemical properties.
In particular, the reclaimed paddy fields are faced with a low effectiveness of fertilizer application because of con- trolling the salt, and thus it is strongly required to investigate whether the customized fertilizer has an effect.
Half of the world’s population depends on rice as the main food source (Shimamoto, 1995). Protein is the second most abundant component of rice grain, accounting for about 9% of its dry weight (Kennedy and Burlingame, 2003). Many studies found that protein play a significant role in determining the functional properties of the starch which is a polymer of D-glucose and occupy about 90%
of rice grain. However amino acids in rice grain are very important source to promote the health of a human being although are deficient in the essential amino acids lysine, and hence is of poor nutritional quality. It is well defined that amino acid score of the milled rice grain based on 5.8 g lysine per 16 g N as 100% is ranged from 55 to 69 (Eggum et al., 1982; Pedersen and Eggum, 1983). Thus, increasing amino acid content of rice grain to develop high nutritional varieties is one of important research objectives to be performed for improving grain quality via the improved cultivation technique as well as breeding.
Fertilizer, particularly, nitrogen has a positive effect on grain protein accumulation with N topdressing at the panicle development stage playing a major role (Borrell et al., 1999; Perez et al., 1996). However, little in known concerning the variations in amino acid composition in
milled rice among contrasting fertilization treatments. In the present study, five japonica rice cultivars with different cultivation region and soil properties (see Lee et al., 2012) were used and three fertilization treatments were undertaken. Our aims were to: (1) examine an effect of the customized fertilizer on amino acid composition in milled rice, and (2) indentify whether there is any difference in amino acid content between cultivation region and soil properties.
Materials and Methods
Experiment sites and soil properties This study was performed at the selected local paddy fields (Hwaseong-si, Uiseong-gun and Miryang-si) with different soil chemical properties (Table 1, Lee et al., 2012) in 2012, and the paddy fields located in Hwaseong-si included a general (Hwaseong III) and two reclaimed (Hwaseong I and II).
Rice growth and treatment Twenty-days-old rice seedlings (Hwaseong I - Chilbo-byeo; Hwaseong II - Chucheong-byeo; Hwaseong III - Haiami-byeo; Uiseong - Ilpum-byeo; Miryang - Ilmi-byeo;) were transplanted between mid-May and early-June in 2012 on the basis of best transplanting season by region. The treatment of fertilizers was composed of no-fertilization, NPK, customized fertilizer (CF) - 70 (basal : topdressing at ear formation stage = 70 : 30), and CF - 50 (basal : topdressing at tillering stage : topdressing at ear formation stage = 50 : 25 : 25). The N-P-K ratio of customized fertilizer based on soil-testing result was 22-10-8 (Hwaseong I and III), 21-13-9 (Hwaseong II), 26-12-8 (Uiseong) and 21-11-19 (Miryang), respectively.
Samples of rice seeds collected from five treatments at harvesting stage were dried to adjust below 14 % of water content and used for amino acid analysis.
Amino acids analysis Representative samples (100 mg) of the ground rice seeds obtained from each treatment were hydrolyzed with 40ml of 6N HCl for 24 hrs at 110
°C in sealed tubes under N
2, HCl solution was evaporated at 50°C in a rotary-evaporator, and amino acids were resolved with 50 ml of buffer solution (67 mM Na-citrate dehydrate including 16.5 ml of HCl, 0.1 ml of caprylic acid, 20 ml of β-thiodiglycol and 2 ml of Brij35). Sulfur- containing amino acids, cysteine and methionine, were firstly transformed into cysteic acid and methionine sulfone with 20 ml of 7.65% formic acid solution including 1%
hydrogen peroxide, stored at below 5°C for 12 hrs ,
evaporated at 50°C in a rotary-evaporator and followed
by the procedure for the hydrolysis of amino acids described
above. The hydrolyzed amino acids were analyzed with a
Hitachi L-8900 Amino Acid Analyzer.
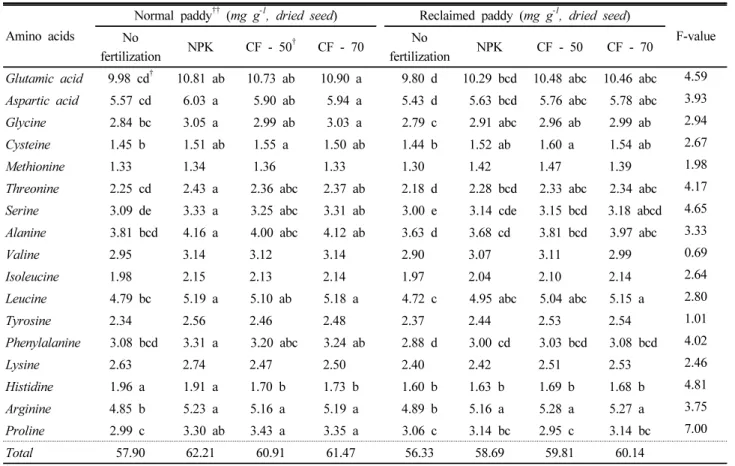
Table 1. Comparison of amino acids composition in rice grain between experiment sites and fertilizer treatments.
Amino acids
Normal paddy
††(mg g
-1, dried seed) Reclaimed paddy (mg g
-1, dried seed)
F-value No
fertilization NPK CF - 50
†CF - 70 No
fertilization NPK CF - 50 CF - 70
Glutamic acid 9.98 cd
†10.81 ab 10.73 ab 10.90 a 9.80 d 10.29 bcd 10.48 abc 10.46 abc 4.59 Aspartic acid 5.57 cd 6.03 a 5.90 ab 5.94 a 5.43 d 5.63 bcd 5.76 abc 5.78 abc 3.93 Glycine 2.84 bc 3.05 a 2.99 ab 3.03 a 2.79 c 2.91 abc 2.96 ab 2.99 ab 2.94
Cysteine 1.45 b 1.51 ab 1.55 a 1.50 ab 1.44 b 1.52 ab 1.60 a 1.54 ab 2.67
Methionine 1.33 1.34 1.36 1.33 1.30 1.42 1.47 1.39 1.98
Threonine 2.25 cd 2.43 a 2.36 abc 2.37 ab 2.18 d 2.28 bcd 2.33 abc 2.34 abc 4.17 Serine 3.09 de 3.33 a 3.25 abc 3.31 ab 3.00 e 3.14 cde 3.15 bcd 3.18 abcd 4.65 Alanine 3.81 bcd 4.16 a 4.00 abc 4.12 ab 3.63 d 3.68 cd 3.81 bcd 3.97 abc 3.33
Valine 2.95 3.14 3.12 3.14 2.90 3.07 3.11 2.99 0.69
Isoleucine 1.98 2.15 2.13 2.14 1.97 2.04 2.10 2.14 2.64
Leucine 4.79 bc 5.19 a 5.10 ab 5.18 a 4.72 c 4.95 abc 5.04 abc 5.15 a 2.80
Tyrosine 2.34 2.56 2.46 2.48 2.37 2.44 2.53 2.54 1.01
Phenylalanine 3.08 bcd 3.31 a 3.20 abc 3.24 ab 2.88 d 3.00 cd 3.03 bcd 3.08 bcd 4.02
Lysine 2.63 2.74 2.47 2.50 2.40 2.42 2.51 2.53 2.46
Histidine 1.96 a 1.91 a 1.70 b 1.73 b 1.60 b 1.63 b 1.69 b 1.68 b 4.81
Arginine 4.85 b 5.23 a 5.16 a 5.19 a 4.89 b 5.16 a 5.28 a 5.27 a 3.75
Proline 2.99 c 3.30 ab 3.43 a 3.35 a 3.06 c 3.14 bc 2.95 c 3.14 bc 7.00
Total 57.90 62.21 60.91 61.47 56.33 58.69 59.81 60.14
†
CF : Customized Fertilizer
††
Normal paddy: an average of Hwaseong, Uiseong and Miryang, Reclaimed paddy: an average of two experiment sites located in Hwaseong
†††
The same letter within each column indicates no significant difference (p<0.05).
Statistics Statistical analysis was performed with SAS software package (version 9.01, SAS Institute Inc, Cary, NC). Data were subjected to one-way ANOVA. If the ANOVA yielded a significant F value (P < 5%), the differences among treatments were compared using a least significant difference (LSD).
Results and Discussion
The fertilization, particularly nitrogen, status is one of the major factors influencing plant growth under field conditions (Mosse and Huet, 1990). In terms of essential amino acids, the contents of amino acids measured showed an increasing trend with fertilization. In particular, nitrogen is a main factor supporting earlier studies which documented the dependence of grain protein on N supply (Table 1).
However, valine, isoleusine, tyrosine and lysine were not significantly affected by fertilization. In our experiment, the most abundant amino acids were observed: glutamic acid (10.43 mg g
-1) > aspartic acid (5.75 mg g
-1) > leucine (5.02 mg g
-1) > alanine (3.90 mg g
-1). According to the previous studies, major amino acids in maize grain were glutamine, aspartic acid, asparagines, glutamic acid and
alanine (Seebauer et al., 2004), and glutamic acid, pheny- lalanine, leucine and aspartic acid (Ning et al., 2010).
Certainly, the concentration of amino acids greatly depended on fertilizer application, and was much higher in normal paddy than in reclaimed. The carbon skeleton backbones used for amino acid biosynthesis in plants are derived from glycolysis, photosynthetic carbon reduction, the oxidative pentose phosphate pathway and the citric acid cycle, and major carbon precursors are 3-phosphoglycerate, phospho enolpyruvate, pyruvate, oxalate and α-ketoglutarate.
In our experiment we sum up the content of each amino
acid derived from carbon skeleton backbones. The signi-
ficant differences in grain N, expressed as a crude protein,
and amino acids dose was observed between experimental
sites (p<0.001), treatments (p<0.01 to 0.001) and interaction
of both factors (p<0.01 to 0.001) (Table 2). It was
analyzed whether the contents of amino acids were statis-
tically different between experimental sites (Table 3) and
fertilization (Table 4) or not. In our experiment the
following order of carbon skeleton backbones to produce
amino acids was observed irrespective of experiment sites
and fertilization: α-ketoglutarate (20.5 mg g
-1) > oxalate
(14.0 mg g
-1) > pyruvate (12.0 mg g
-1) > 3-phosphoglycerate
Table 2. Analysis of variance for crude protein and amino acids in rice grain.
Crude protein
Carbon skeleton backbones for amino acid biosynthesis
†Total α-
Ketoglutarate Oxaloacetate 3-Phosphogly- cerate
Phosphoenol-
pyruvate Pyruvate F
value
Site 38.32***
††52.9*** 54.67*** 59.91*** 23.02*** 17.97*** 48.01***
Treatment 8.57*** 8.85*** 7.08*** 10.4*** 4.43** 6.19** 8.78***
Site x Treatment 3.29** 3.73*** 3.86*** 3.78*** 3.16** 3.25** 4.06***
†
Amino acid biosynthes; 1) α-ketoglutarate (Glutamate, Histidine, Arginine and Proline), 2) Oxaloacetate (Aspartate, Threonine, Isoleusine, Methionine and Lyscine), 3) 3-Phosphoglycerate (Serine, Glycine and Cystenine), 4) Phosphoenolpyruvate (Tyrosine and Phenylalanine) and 5) Pyruvate (Alanine, Leusine and Valine)
††
The star marks, *, ** and ***, mean significant difference at p<0.05, 0.01 and 0.001, respectively.
Table 3. Comparison of amino acids between experimental sites.
Site Carbon skeleton backbones for amino acid biosynthesis
Total α-Ketoglutarate Oxaloacetate 3-Phosphoglycerate Phosphoenolpyruvate Pyruvate
Hwaseong I
†21.1 ± 1.6b 14.6 ± 1.1b 7.9 ± 0.6b 5.7 ± 0.5b 12.1 ± 1.1b 61.3 ± 4.8b Hwaseong II 19.1 ± 0.9d 13.1 ± 0.5d 7.2 ± 0.3d 5.2 ± 0.3c 11.4 ± 0.4c 56.2 ± 2.1c Hwaseong III 20.4 ± 0.9c 14.0 ± 0.6c 7.6 ± 0.3c 5.6 ± 0.4b 12.1 ± 0.7b 59.7 ± 2.7b Miryang 23.1 ± 1.5a 15.7 ± 0.8a 8.5 ± 0.5a 6.3 ± 0.5a 13.2 ± 1.1a 66.7 ± 4.0a Uiseong 18.9 ± 0.7d 13.1 ± 0.4d 7.0 ± 0.2d 5.2 ± 0.3c 11.2 ± 0.5c 55.4 ± 1.9c
†