2013, 24
(4)
,763–771
대학입학전형에서 동일계 특별전형 합격생들에 대한 연구 †
신재경
1
1창원대학교 통계학과
접수 2013년 6월 7일, 수정 2013년 6월 21일, 게재확정 2013년 6월 26일
요 약
1990년 이후 국내 저 출산 붐으로 인한 대학 입시생들의 감소로 인하여 2016년 이후는 대학 정원 이 수험생들의 수요보다 많은 상황으로 예측된다. 이로 인해 지방대학들의 학생 충원이 대학의 존폐 여부를 좌우할 만큼 학생수급 정도가 심각한 상황으로 부각되고 있다. 따라서 전국 대부분 대학들은 우수한 인재들을 선점하기 위한 특성화 및 전문화된 방식으로 신입생들을 선발하는 다양한 전형방법 을 개발하여 시행하고 있다. 본 연구는 지방의 A국립대학교를 중심으로 동일계 특별전형 입학생들에 대한 통계적 분석을 통해 이들을 효과적으로 관리할 수 있는 방법을 찾아보고자 한다. 동일계 특별전 형 입학생들을 대상으로 통계적 방법을 통한 재학현황과 학내 적응여부를 분석하고 계열별 성별과의 관계를 파악하여 보다 나은 신입생 선발을 위한 방법에 대해 살펴본다. 저 출산으로 인한 학생 수의 감소로 정원 외로 전형하는 동일계 특별전형을 통해 인재를 확보하는 방안으로 활용할 수 있으며, 이 를 토대로 졸업 시까지 학생들을 추수 관리할 수 있다. 또한 다른 전형으로 확대하여 분석을 하고 서 로 비교한다면 앞으로의 입시정책에 적합한 전형유형을 개발할 수도 있을 것이다.
주요용어: 대학입학전형, 동일계, 입시정책, 특별전형.
1. 1.서론
1990년 이 후 국내 저 출산 붐으로 인한 대학 입시생들의 감소로 인하여 2016년 이후는 대학 정원이 수험생들의 수요보다 많은 상황으로 예측된다. 이로 인해 지방대학들의 학생 충원이 대학의 존폐 여부 를 좌우할 만큼 학생수급 정도가 심각한 상황으로 부각되고 있다. 따라서 전국 대부분 대학들은 우수한 인재들을 선점하기 위한 특성화 및 전문화된 방식으로 신입생들을 선발하는 다양한 전형방법을 개발하 여 시행하고 있다. 대학입학전형과 관련하여 많은 학자들이 연구하여왔다. 이들을 구체적으로 살펴보 면 먼저, Huh와 Jun (1996)은 1994, 1995년도의 고려대학교 일반전형 입학생들의 고교내신, 대학수학 능력시험, 대학별고사성적과 대학 입학 후 평균평점 (grade point average; GPA) 자료를 분석하여 고 교내신이 GPA에 가장 큰 영향을 주었다고 주장하였다. Oh 등 (2010)은 대학입학전형별 학업성취도 에 관해 연구하였고, Choi와 Ha (2012)는 2011학년도 A대학교의 일반전형 입학생들의 입학전형요소 가 학업성취도에 어떤 영향을 주는지 상호관련성을 분석하였으며, Choi와 Han (2010)은 입학사정 전형 요소 상대적 중요도 결정에 대한 퍼지 계층 분석적 접근방법에 대해 연구하였다. Han (2011)은 지방 J 대학의 입시사정관 교육·훈련을 위한 교육과정을 개발하였고 Cho (2010)는 학업성취도에 대한 대입전 형요인들의 영향력 분석을 통하여 학업성취도에 대한 전형관련 변수들에 대한 주 효과와 상호작용효과 를각각 분석하였다. 대학입학 정원수와 관련하여 Yoon과 Kim (2010)은 수도권지역의 고3학생 수 예
†
이 논문은 2011-2012년도 창원대학교 연구비에 의하여 연구되었음.
1
(641-773) 경남 창원시 사림동 9번지, 창원대학교 통계학과, 교수. E-mail: [email protected]
측과 대학입학정원수와의 관계를 2027년까지 분석하여 수도권의 집중화 현상으로 심각한 저 출산의 영 향에도 불구하고 수도권의 대학들의 신입생 유치에는 문제가 없다고 주장하였으며, Kim 등 (2009)은 2026년까지 대구광역시와 경상북도 지역의 고등학교 3학년 학생 수에 대한 예측과 대학입학정원수와의 비교분석에서 2019년과 2020년에는 대구·경북의 입학생 유치에 심각한 어려움이 있을 것으로 예측하였 다. Park (2011)은 대학입시에서 면접점수 표준화 방법으로 사용되고 있는 절사, 순위 및 z-점수평균방 법을 모의실험을 통해 비교하였으며, Park과 Kim (2012)은 사영에 근거한 면접점수의 통계적 모형을 제시하였다. 그 이외 Choi 등 (2010)은 행렬도를 이용하여 전북대학교의 2009년도에 실시된 신입생의 진로의식 조사 자료를 이용하여 신입생의 선호직업과 진로성숙도의 관계를 분석하였으며, Choi와 Kang (2011)은 중요도와 만족도의 변환지수를 이용하여 대학교육서비스품질측정에 관한 분석에서 29개의 품 질속성에 대해 교수요인, 신뢰요인 및 유형요인에 대해서는 매우 긍적적인 평가인 반면 직원요인에 대 해서는 덜긍적적인 평가를 얻었다고 주장하였다. 본 연구에서는 지방의 A국립대학교의 대학입학전형 에서 동일계 특별전형 입학생들에 대한 통계적 분석을 통해 이들을 효과적으로 관리할 수 있는 방법을 찾아보고자 한다. 2절에서는 다양한 대학입시제도에 대해 간단히 소개하고 3절에서는 대학입학전형에 서 동일계 특별전형으로 합격한 학생들에 대한 통계적 분석을 통해 우수한 인재들을 선발하고 또한 이들 인재들을 어떻게 관리할 것인가에 대해 살펴보고자 한다. 마지막 4절에서는 결론 및 향후과제에 대하여 살펴보기로 한다.
2. 대학입학전형
전국의 국·공립 및 사립 대학교에서는 매년 다양한 전형방법으로 신입생들을 모집하고 있다. 여기서 본 연구 논문의 중심인 지방의 A국립대학교의 입학전형을 먼저 살펴보기로 하자. 지방의 A국립대학교 의 입학전형유형은 크게 정원 내 와 정원 외로 구분할 수 있다. 우선 정원 내의 전형유형을 구체적으로 살펴보면 교과 성적우수자 특별전형, 지역사회 기여 인재 특별전형, 특기자 특별전형, 선·효행 자 특별 전형, 독립유공자 손 자녀 및 국가유공자 자녀 특별전형 및 취업자 특별전형 등 6개의 특별전형과 일반 학생전형이 있다. 한편, 정원 외의 유형은 농어촌학생 특별전형, 전문계고교출신자 (이하 동일계로 표기 함, 2011학년도와 2012학년도는 입학사정관제 전형으로 신입생 모집) 특별전형, 전문계고졸업 재직자 특별전형, 기회균형선발 특별전형 과 특수교육대상자 특별전형으로 신입생을 모집하고 있다. 본 연구 논문의 배경이 된 지방의 A국립대학교의 정원 외 유형인 동일계고교출신자 특별전형은 경상대학 7개학 과, 자연과학대학 6개학과, 공과대학 15개학과 (총 28개학과)에서 정원 외로 50명을 모집하고 있다. 지 원 자격은 동일계 (상업, 공업, 가사계, 농업계) 졸업 (예정)자로서 지방의 A국립대학교의 동일계출신 특별전형 모집학과 (부)가 지정하는 출신학과 계열이 동일한 자 중 출신고등학교장의 추천을 받은 학생 이다.
3. 자료 분석
3.1. 연구 분석 대상자료
본 연구 자료는 지방의 A국립대학교의 2008학년도부터 2011학년도까지 정원 외 유형 중 동일계 특별 전형으로 합격한 입학생들의 자료이다.
3.2. 기초자료분석
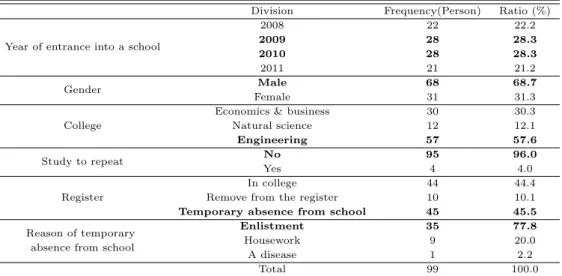
Table 3.1은 앞의 3.1절의 연구 분석 대상 자료들을 속성 분석한 자료이고 Table 3.2는 입학학과별 속 성분석 자료이다. Table 3.3은 출신학교의 출신과별 속성 분석한 자료이다.
Table 3.1 The characteristic analysis of new students in special selection for vocational high schools (2008 school year-2011 school year)
Division Frequency(Person) Ratio (%)
Year of entrance into a school
2008 22 22.2
2009 28 28.3
2010 28 28.3
2011 21 21.2
Gender Male 68 68.7
Female 31 31.3
College
Economics & business 30 30.3
Natural science 12 12.1
Engineering 57 57.6
Study to repeat No 95 96.0
Yes 4 4.0
Register
In college 44 44.4
Remove from the register 10 10.1
Temporary absence from school 45 45.5
Reason of temporary Enlistment 35 77.8
absence from school Housework 9 20.0
A disease 1 2.2
Total 99 100.0
Table 3.2 The characteristic analysis of new students in special selection for vocational high schools (classified by dept. · division · school)
Name of dept. Frequency Ratio
Name of dept. Frequency Ratio
(Person) (%) (Person) (%)
Division of Economics and International
3 3.0 School of Mechatronics Engineering
1 1.0
Trade and Finance & insurance (Mechnical Design and Manufacturing) Dept. of Business
6 6.1 School of Mechatronics
1 1.0
Administration Engineering(Electrical)
Division of Business
3 3.0 School of Mechatronics
1 1.0
Administration and ccounting Engineering (Electronic)
Dept. of Economics 3 3.0 School of Mechatronics
3 3.0
Engineering (Control and Instrumentation)
Dept. of International Trade 3 3.0 School of Architectural
1 1.0
Engineering Dept. of International Trade
4 4.0 Dept. of Industrial and
2 2.0
(evening class) Systems Engineering
Dept. of Finance & insurance 1 1.0 Dept. of Civil Engineering 5 5.1
Dept. of Tax Management 3 3.0 Dept. Electrical Engineering 4 4.0
Dept. of Accounting 4 4.0 Dept. of Control and 3 3.0
Instrumentation Engineering Dept. of Biochemistry and
4 4.0 Dept. of Information and
3 3.0
Health Science Communication Engineering
Dept. of Microbiology 1 1.0 Dept. of Naval Architecture 1 1.0
Division of Bio Science 1 1.0 Dept. of Naval Architecture
2 2.0
and Marine Engineering
Dept. of Biology 1 1.0 Dept. of Computer Engineering 3 3.0
Dept. of Child Development
1 1.0 School of Computer and Information
6 6.1
and Family Studies and Communication Engineering
Dept. of Food and Nutrition 2 2.0 Dept. of Environmental
2 2.0
Engineering
Division of Life Science 1 1.0 Dept. of Chemical Engineering 2 2.0
Dept. of Clothing and
1 1.0 Division of Environmental and
2 2.0
Textiles Chemical Engineering
Dept. of Mechnical
3 3.0 Dept. of Mechnical Design and
2 2.0
Engineering Manufacturing Engineering
School of Nano and
4 4.0 Dept. of Architectural
2 2.0
Advanced Materials Engineering Engineering (4 years)
School of Mechatronics Engineering 4 4.0 Total 99 100.0
Table 3.1의 입학생 속성분석에서 진하게 나타난 부분은 각 속성에서 가장 높은 비율을 나타내며 이 들을 분야별로 살펴보면 입학년도는 2009년과 2010년이 각 28.3%의 비율로 가장 높게 나타났으며, 성
별에서는 남학생의 비율이 68.7%로 여학생의 31.3% 보다 2배 이상 높은 비율을 보였으며 단과대학별 로는공과대학이 57.6%로 가장 높게 나타났고 자연과학대학이 12.1%로 가장 낮은 비율로 나타났다. 재 수여부는 재수하지 않은 입학생이 96% (95명)의 압도적인 비율로 나타났으며, 현재의 재적상황을 살펴 보면 휴학이 45.5% (45명), 재학 중이 44.4% (44명)로 거의 비슷한 비율을 보이고 있는데 제적된 학생 도 10.1% (10명)의 비율을 보여주고 있다. 휴학과 제적을 합치면 55.6% (55명)로 전체 입학생의 절반 을 넘는데 이들의 비율을 줄이는것이 앞으로의 과제라고 할 수 있다.
Table 3.3 The characteristic analysis of new students in special selection for vocational high schools (graduated high school)
Graduated high school Frequency Ratio
Graduated high school Frequency Ratio
(Person) (%) (Person) (%)
Gyeognam tourism high school 8 8.1 Busan digital high school 1 1.0
Kyeognam beauty high school 1 1.0 Busan energy science high school 1 1.0
Gyeognam animation high school 2 2.0 Busan automotive high school 1 1.0
Kyeongnam electronic high school 1 1.0 Busan electronic technical high school school 2 2.0
Gyeongil high school 1 1.0 Busan computer science high school 1 1.0
Gyeongju technical high school 1 1.0 Buil electronics & design high school 1 1.0
Goseong high school 1 1.0 Sunsan-girls high school 1 1.0
Gumi-information high school 1 1.0 Uiryeong high school 1 1.0
Keumjeong electronic technical high school 4 4.0 Jinju mechanical technical high school 1 1.0 Kimhae construction and technician high school 9 9.1 Jinhae sehwa girls’ high school 6 6.1
Gimhae high school of life science 7 7.1 Jinhae joongang high school 2 2.0
Gimhae hanil girls’ high school 2 2.0 Changnyeong jeil high school 2 2.0
Naju commercial high school 1 1.0 Changwon technical high school 7 7.1
Daejin high school of information &
1 1.0 Changwon mechanical technical
10 10.1
communication high school
Busan port logistics high school 2 2.0 Chungryol girls’ high school 1 1.0
Dong-a technical high school 1 1.0 Pohang girls’ electronic high school 1 1.0
dongju girls’ high school 1 1.0 Hadong high school 1 1.0
Masan technical high school 4 4.0 International financial power high school 1 1.0
Masan muhak girls’ high school 2 2.0 Haman high school 1 1.0
Milseong jeil high school 1 1.0 Hamyang jeil high school 1 1.0
Milyang dongmyung high school 1 1.0 Haeundae technical high school 1 1.0
Busan technical high school 2 2.0 Heunghae technical high school 1 1.0
Total 99 100.0
휴학사유를보면 입대의 비율이 77.78% (35명)로 가장 높은 비율을 보여주고 있으며 다음으로 가사 휴학 20% (9명), 신병휴학 2.22% (1명)의 순으로 나타났다. 이는 성별에서도 살펴보았듯이 남학생의 비율이 여학생 비율보다 높은데서 기인하였다고 볼 수 있다. Table 3.2를 살펴보면 경상대학의 경영학 과와 공과대학의 컴퓨터·정보통신공학부가 6.1% (6명)로 가장 높은 비율을 보여주고 있으며 (진하게 표 시된 부분) 전체 39개 학과·학부 (입시 요강의 변경으로 인하여 28개에서 39개 학과·학부로 나타남)에 학생들이 입학한것으로 나타났다.
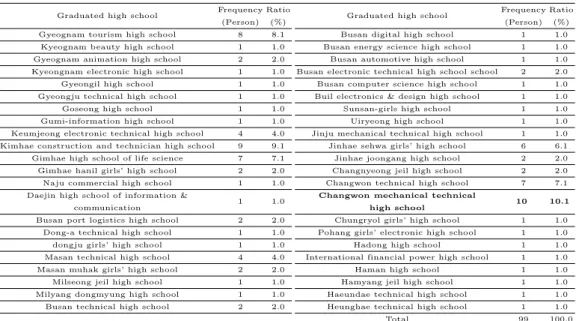
Table 3.3의 입학생들의 출신 고등학교별 속성분석을 살펴보면 창원기계공업고등학교가 10.1%
(10명)의 비율로 가장 높게 나타났으며 (진하게 표시된 부분) 다음으로 김해건설공업고등학교가 9.1%
(9명), 경남관광고등학교 8.1% (8명), 김해생명과학고등학교와 창원공업고등학교가 각 7.1% (7명)의 순으로 나타났으며 1명이라도 입학생을 배출한 고등학교는 모두 44개 학교이다.
3.3. 각 속성별 동일성 검정 3.3.1. 입학년도 별 동일성 검정
먼저, 입학년도와 다른 속성과의 동일성 검정에 대해 살펴보기로 한다. Table 3.4와 Table 3.5는 각 각 입학년도와 성별 및 입학년도와 단과대학과의 동일성 검정 결과이다.
Table 3.4 Analysis of year of entrance and gender (person (%)) Gender
Total
Male Female
Year of entrance into a school
2008 15 (68.2) 7 (31.8) 22 (100.0)
2009 19 (67.9) 9 (32.1) 28 (100.0)
2010 21 (75.0) 7 (25.0) 28 (100.0)
2011 13 (61.9) 8 (38.1) 21 (100.0)
Total 68 (68.7) 31 (31.3) 99 (100.0)
χ
2= 0.980, p-value = 0.806
Table 3.5 Analysis of year of entrance and college (person (%)) College
Total Economics & business Natural science Engineering
Year of entrance into a school
2008 7 (31.8) 3 (13.6) 12 (54.5) 22 (100.0) 2009 7 (25.0) 4 (14.3) 17 (60.7) 28 (100.0)
2010 8 (28.6) 1 (3.6) 19 (67.9) 28 (100.0)
2011 8 (38.1) 4 (19.0) 9 (42.9) 21 (100.0)
Total 30 (30.3) 12 (12.1) 57 (57.6) 99 (100.0)
χ
2= 4.782, p-value = 0.572
이들 결과를 살펴보면, 입학년도와 성별 및 입학년도와 단과대학과의 동일성 검정 결과는 유의수준 5%에서 유의확률이 각각 0.806과 0.572로 응답 차이가 없는 것으로 나타났다.
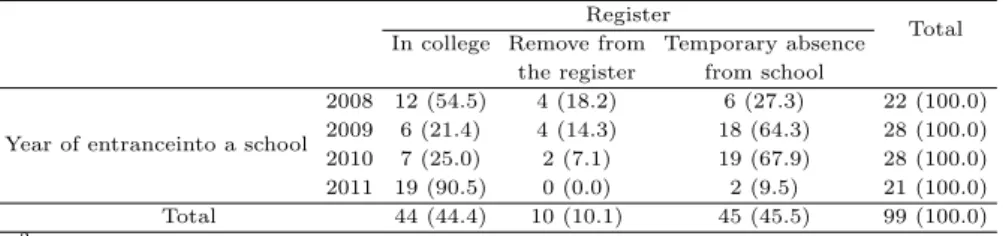
Table 3.6, Table 3.7 및 Table 3.8은 각각 입학년도와 재수여부, 입학년도와 재적상태 및 입학년도와 휴학사유와의 동일성 검정 결과이다.
Table 3.6 Analysis of year of entrance and study to repeat (person (%)) Study to repeat
Total
No Yes
Year of entrance into a school
2008 22 (100.0) 0 (0.0) 22 (100.0) 2009 27 (96.4) 1 (3.6) 28 (100.0) 2010 26 (92.9) 2 (7.1) 28 (100.0) 2011 20 (95.2) 1 (4.8) 21 (100.0)
Total 95 (96.0) 4 (4.0) 99 (100.0)
χ
2= 1.666, p-value = 0.645
Table 3.7 Analysis of year of entrance and register (person (%)) Register
Total In college Remove from Temporary absence
the register from school
Year of entranceinto a school
2008 12 (54.5) 4 (18.2) 6 (27.3) 22 (100.0) 2009 6 (21.4) 4 (14.3) 18 (64.3) 28 (100.0) 2010 7 (25.0) 2 (7.1) 19 (67.9) 28 (100.0) 2011 19 (90.5) 0 (0.0) 2 (9.5) 21 (100.0)
Total 44 (44.4) 10 (10.1) 45 (45.5) 99 (100.0)
χ
2= 33.348, p-value = 0.000
Table 3.8 Analysis of year of entrance and reason of temporary absence from school (person (%)) Reason of temporary absence from school
Total Enlistment Housework A disease
Year of entrance into a school
2008 3 (50.0) 3 (50.0) 0 (0.0) 22 (100.0) 2009 15 (83.3) 3 (16.7) 0 (0.0) 28 (100.0) 2010 15 (78.9) 3 (15.8) 1 (5.3) 28 (100.0) 2011 2 (100.0) 0 (0.0) 0 (0.0) 21 (100.0)
Total 35 (77.8) 9 (20.0) 1 (2.2) 99 (100.0)
χ
2= 5.534, p-value = 0.477
Table 3.6을 보면 입학년도와 재수여부와의 동일성 검정 결과는 유의수준 5%에서 유의확률이 0.645로 응답 차이가 없는 것으로 나타났으며, Table 3.7의 입학년도와 재적상태와의 동일성 검정 결과를 보면, 유의수준 5%에서 유의확률이 0.000으로 응답 차이가 있는 것으로 나타났다. 이를 자세 하게 살펴보면 2009년과 2010년은 재적상태가 휴학이 가장 많으며, 2008년과 2011년에는 상대적으로 재학 중이 많은것으로 나타났다. Table 3.8은 입학년도와 휴학사유와의 동일성 검정 결과로 유의수준 5%에서 유의확률이 0.477로 응답 차이가 없는 것으로 나타났다.
3.3.2. 성별과의 동일성 검정
다음으로 성별과 그 이외 다른 속성과의 동일성 검정에 대해 살펴보기로 한다. Table 3.9와 Table 3.10은 각각 성별과 단과대학 및 성별과 재수여부와의 동일성 검정 결과이다.
Table 3.9 Analysis of gender and college (person (%)) College
Total Economics & business Natural science Engineering
Gender Male 6 (8.8) 7 (10.3) 55 (80.9) 68 (100.0)
Female 24 (77.4) 5 (16.1) 2 (6.5) 31 (100.0)
Total 30 (30.3) 12 (12.1) 57 (57.6) 99 (100.0)
χ
2= 54.149, p-value = 0.000
Table 3.10 Analysis of gender and study to repeat (person (%)) Study to repeat
Total
No Yes
Gender Male 65 (95.6) 3 (4.4) 68 (100.0)
Female 30 (96.8) 1 (3.2) 31 (100.0)
Total 95 (96.0) 4 (4.0) 99 (100.0)
χ
2= 0.077, p-value = 0.629
성별과 단과대학과의 동일성 검정 결과는 유의수준 1%에서 유의확률이 0.000으로 응답 차이가 있는 것으로 나타났는데 (Table 3.9 참조), 이것은 남학생인 경우는 공과대학의 응답률이, 여학생인 경우는 경상대학의 응답률이 상대적으로 높게 나타났기 때문이다. 한편 성별과 재수여부와의 동일성 검정 결과 는 유의수준 5%에서 유의확률이 0.629로 응답 차이가 없는 것으로 나타났다 (Table 3.10 참조).
Table 3.11과 Table 3.12는 각각 성별과 재적상태, 성별과 휴학사유와의 동일성 검정 결과이다.
Table 3.11 Analysis of gender and register (person (%)) Register
Total In college Remove from the register Temporary absence from school
Gender Male 22 (32.4) 8 (11.8) 38 (55.9) 68 (100.0)
Female 22 (71.0) 2 (6.5) 7 (22.6) 31 (100.0)
Total 44 (44.4) 10 (10.1) 45 (45.5) 99 (100.0)
χ
2= 12.934, p-value = 0.002
Table 3.12 Analysis of gender and reason of temporary absence from school (person (%)) Reason of temporary absence from school
Total Enlistment Housework A disease
Gender Male 35 (92.1) 3 (7.9) 0 (0.0) 38 (100.0)
Female 0 (0.0) 6 (85.7) 1 (14.3) 7 (100.0)
Total 35 (77.8) 9 (20.0) 1 (2.2) 45 (100.0)
χ
2= 29.774, p-value = 0.000
Table 3.11의 성별과 재적상태와의 동일성 검정 결과와 Table 3.12의 성별과 휴학사유와의 동일성 검 정 결과를 보면 모두 유의수준 1%에서 각각 유의확률이 0.002와 0.000으로 응답 차이가 있는 것으로
나타났다. 이들을 자세하게 살펴보면 Table 3.11의 성별과 재적상태인 경우는 남학생은 휴학의 응답률 이 상대적으로 높게 나타났고 여학생은 재학 중의 응답률이 상대적으로 높게 나타났기 때문이며 Table 3.12의 성별과 휴학사유인 경우는 남학생은 입대의 응답률이 높게 나타났고 여학생은 가사휴학의 응답 률이 상대적으로 높게 나타났기 때문이다.
3.3.3. 단과대학과의 동일성 검정
마지막으로 단과대학과 그 이외 다른 속성과의 동일성 검정에 대해 살펴보기로 한다.
Table 3.13 Analysis of college and study to repeat (person (%)) Study to repeat
Total
No Yes
College
Economics & business 29 (96.7) 1 (3.3) 30 (100.0) Natural science 12 (100.0) 0 (0.0) 12 (100.0) Engineering 54 (94.7) 3 (5.3) 57 (100.0) Total 95 (96.)) 4 (4.0) 99 (100.0) χ
2= 0.765, p-value = 0.683
단과대학과 재수여부와의 동일성 검정 결과는 유의수준 5%에서 유의확률이 0.683으로 응답 차이 가 없는 것으로 나타났다 (Table 3.13 참조). 단과대학과 재적상태와의 동일성 검정 결과는 유의수준 1%에서 유의확률이 0.001로 응답 차이가 있는 것으로 나타났다 (Table 3.14 참조). 이를 자세하게 살펴 보면 경상대학은 재학 중 (73.3%)의 응답률이 높게 나타났고 공과대학은 휴학 (56.1%)의 응답률이 높 게 나타났다.
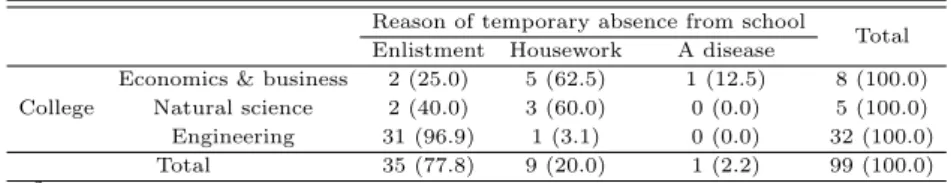
단과대학과 휴학사유와의 동일성 검정 결과는 유의수준 1%에서 유의확률이 0.000으로 응답 차이가 있는것으로 나타났다 (Table 3.15 참조). 이를 자세하게 살펴보면 경상대학과 자연과학대학은 가사휴 학 (각각 62.5%, 60%)에 대한 응답률이 높게 나타났고 공과대학은 입대 (96.9%)에 대한 응답률이 높게 나타났다.
Table 3.14 Analysis of college and register (person (%)) Register
Total In college Remove from Temporary absence
the register from school
College
Economics & business 22 (73.3) 0 (0.0) 8 (26.7) 30 (100.0) Natural science 6 (50.0) 1 (8.3) 5 (41.7) 12 (100.0) Engineering 16 (28.1) 9 (15.8) 32 (56.1) 57 (100.0) Total 44 (44.4) 10 (10.1) 45 (45.5) 99 (100.0) χ
2= 17.848, p-value = 0.001
Table 3.15 Analysis of college and reason of temporary absence from school (person (%)) Reason of temporary absence from school
Total Enlistment Housework A disease
College
Economics & business 2 (25.0) 5 (62.5) 1 (12.5) 8 (100.0) Natural science 2 (40.0) 3 (60.0) 0 (0.0) 5 (100.0) Engineering 31 (96.9) 1 (3.1) 0 (0.0) 32 (100.0)
Total 35 (77.8) 9 (20.0) 1 (2.2) 99 (100.0)
χ
2= 25.689, p-value = 0.000
4. 결론 및 향후과제
지방의 A 국립대학교의 2008학년도부터 2011학년도까지 정원 외 유형 중 동일계 특별전형으로 합격 한 입학생들의 자료를각 속성별로 동일성 검정을 하였다. 먼저, 입학년도와 다른 속성과의 동일성 검 정 결과는 입학년도와 재적상태만 유의수준 5%에서 유의한 차이를 보였고 다른 모든 속성에서는 차이 가 없는 것으로 나타났다. 다음으로 성별과 다른 속성과의 동일성 검정 결과는 성별과 단과대학, 성별 과 재적상태 및 성별과 휴학사유는 유의수준 1%에서 유의한 차이가 있었고 반면에 성별과 재수여부는 유의한 차이가 없는 것으로 나타났다. 마지막으로 단과대학과 다른 속성과의 동일성 검정 결과는 단과 대학과 재적상태 및 단과대학과 휴학사유는 유의수준 1%에서 유의한 차이가 있었으며 단과대학과 재수 여부는 유의한 차이가 없는 것으로 나타났다. 입학년도와 재적상태는 유의한 차이가 있다고 하였는데, 이것은 앞 절에서도 언급하였듯이 2009년과 2010년의 성별과 재적상태는 각각 남학생과 휴학의 비율이 상대적으로 높았다. 남학생의 비율이 높았으므로 휴학사유에서도 입대의 비율이 상대적으로 높게 나타 난것이다. 따라서 이들의 입대 후 복학 여부를 잘 관찰한다면 저 출산으로 인한 학생 수의 감소로 정원 외로 전형하는 동일계 특별전형을 통해 인재를 확보하는 방안으로 활용할 수 있으며, 이를 토대로 졸업 시까지 학생들을 추수 관리할 수도 있다. 또한 다른 전형으로 확대하여 분석을 실시한다면 앞으로의 입 시정책에 적합한 전형유형을 개발할 수도 있을 것이다. 향후 다른 전형으로 확대하여 분석, 다른 전형과 의 비교분석및 다른 대학교 입학전형과의 비교분석이 중요한 과제로 남아있다.
References
Cho, J. S. (2010). The influence analysis of admission variables on academic achievements. Journal of the Korean Data & Information Science Society, 21, 729-736.
Choi, H. M., Park, C. Y., Lee, S. H. and Chung, S. S. (2010). The use of a biplot in studying the career maturity of college freshmen. The Korean Journal of Applied Statistics, 23, 933-941.
Choi, H. S. and Ha, J. (2012). Analysis of academic achievement based on the university admission factors.
Journal of the Korean Data & Information Science Society, 23, 343-351.
Choi, K. H. and Han, D. W. (2010). The fuzzy AHP approach to the relative importance of the deciding factors for admission screening-J university case study. Journal of the Korean Data & Information Science Society, 21, 699-708.
Choi, K. H. and Kang, S. (2011). A stydy measuring university educational service guality using importance- satisfaction transformed index. Journal of the Korean Data & Information Science Society, 22, 765- 773.
Han, D. W. (2011). Curriculum development for education and training of admissions officer- J university case. Journal of the Korean Data & Information Science Society, 22, 857-866.
Huh, M. H. and Jun, S. Y. (1996). Predictive validity of admission indices. The Journal of Educational Research, 34, 299-310.
Kim, J. T., Seo, H. M. and Lee, L. S. (2009). The forecasting for the numbers of a high-school graduate and statistical analysis for the numbers of limit of matriculation until 2026 year in Daegu. Journal of the Korean Data & Information Science Society, 20, 159-169.
Oh, J. H., Jung, J. Y., Hong, Y. H., Park, S. G. and Kim, S. (2010). A study on the performance evaluation of the college-entrance processes. The Korean Journal of Applied Statistics, 23, 987-996.
Park, C. (2011). Simulation comparison of standardization methods for interview scores. Journal of the Korean Data & Information Science Society, 22, 179-188.
Park, C. and Kim, H. W. (2012). A statistical model for interview score based on projection. Journal of the Korean Data & Information Science Society, 23, 495-504.
Yoon, Y. H. and Kim, J. T. (2010). Projection number of the graduate student in high school around the
capital area and an entrance quota. Journal of the Korean Data & Information Science Society, 21,
523-534.
2013, 24
(4)
,763–771
A study of college students who were granted special admissions for vocational high school students †
Jae-Kyoung Shin
1
1Department of Statistics, Changwon National University
Received 7 June 2013, revised 21 June 2013, accepted 26 June 2013
Abstract
Due to a decrease in the number of college prep students which was triggered by the low birth rate since 1990, it is predicted, beginning 2016, that the entrance quota for colleges will exceed the number of applicants for college admissions. This serious imbalance between supply and demand raises serious problems for the regional univer- sities, many of which have already been struggling to recruit new students and even considered closing down the schools. In an effort to securing best high school students, many of the schools have been developing various unique and specialized selectional processes for the applicants. In this research, through a statistical analysis of special admission processes for vocational high school students who were admitted to a re- gional state-run university (University A), I tried to find a way to effectively deal with the student management. Statistically analyzing these first-year students’ enrollment and their adjustment processes as well as the departmental relationships and gender differences, I tried to find some better ways to secure good applicants. It is expected that this study will not only be utilized as guide to adopt a way to bypass the enroll- ment quota in order to secure talented students but also be served as a reference that will help the students adapt themselves to school life until they graduate. It is also expected that this study will be expanded in such a way as to compare it with other models and even develop a new type of college entrance system that would fit future college admission policies.
Keywords: College admission policy, college admissions, special admissions, vocational high schools.
†
This research is financially supported by Changwon National University in 2011-2012.
1