Received: September 5, 2018 Revised: October 22, 2018 Accepted: October 22, 2018 Trauma and InJury
Correspondence to Won Bin Park, M.D.
Department of Emergency Medicine, Gachon University Gil Medical Center, 21 Namdong-daero 774beon-gil, Namdong-gu, Incheon 21565, Korea Tel: +82-32-460-3015
Fax: +82-32-460-3019 E-mail: [email protected]
The new recreational Transportation on the Street: Personal mobility, Is It Safe?
Young Woo Kim, M.D.1, Won Bin Park, M.D.1, Jin Seong Cho, M.D.1, Sung Youl Hyun, M.D.2, Geun Lee, M.D.1
Departments of 1Emergency Medicine, 2Trauma Surgery, Gachon University Gil Medical Center, Incheon, Korea
Purpose: The interest in the personal mobility started to grow and as the interest in- creases, there are growing concerns about the safety of it. The purpose of the study is to look at the types and dynamics of patients injured by the personal mobilities.
methods: This was a retrospective 2-year observational study, from January 2016 to December 2017, on the patients who visited the emergency center and the trauma cen- ter, with an injury related to driving the personal mobility. Cases of the personal mo- bility-related accident were collected based on electronic medical records and hospital emergency department-based injury in-depth surveillance data.
results: A total of 65 patients visited the emergency center and the trauma center, during this study period. Six patients of 50 adults admitted the alcohol consumption (12%) and two adult patients wore the helmet as the protection gear (3.1%). The number of the patients in 2017 rises three times more than the number of patients in 2016 (51 vs. 14). Injuries to the head and neck region (67.7%) was the most common, followed by the upper extremity (46.2%). Eleven patients (16.9%) were admitted to the hospital, of whom three were admitted to the intensive care unit due to intracranial hemorrhage.
Nine patients underwent surgery.
Conclusions: The use of the personal mobility will continue to grow and the accidents, caused by the vehicle, will increase along with it. The study showed the damage is worse than expected. Personal mobility currently has a limited safety laws and the riders are not yet fully aware of its danger. The improvement of the regulation of the personal mobility, safety education is needed.
Keywords: Public health; Traffic accident; Brain Injuries, Traumatic; Facial injury
INTRODUCTION
Recently, the interest in the personal mobility has started to grow. It is easy to find people, from children to adults, riding the vehicle on the street. Personal mobility, or smart mobility, is a small personal vehicle that runs on electricity, powered by rechargeable lithium-ion vehicle batteries, and can travel at the speed of 20 to 40 km/hr (Fig.
1). Personal mobility includes electric scooter, electric unicycle, self-balancing scooter, electric bicycle, and elec- tric skateboard [1,2]. In 2012, the global personal mobility devices market was evaluated around USD 3.60 billion and is expected to reach approximately USD 7.55 billion by 2022 [3]. According to the Korea Transport Institute, the market size of the personal mobility in South Korea was over 60,000 units in 2016 and it will reach 75,000, an increase of 20%, in 2017 [4]. The institute estimates the products sales will increase by more than three times in 5 years.
As personal mobility gains attentions, there are growing concerns about the safety of it. The increase of accident associated with personal mobility is shown worldwide [2,5,6]. Statistics from the Hyundai Research Institute for Maritime and Environmental Affairs showed that the per- sonal mobility accidents in South Korea have more than quadrupled over the past 5 years from 29, in 2012, to 137 [7]. However, while researches are being progressed on the types and mechanisms of the personal mobility acci- dents in foreign countries, there is no domestic researches in South Korea. The purpose of this study is to look at the types and dynamics of patients injured by the personal mobility, who visited the university hospital emergency center and trauma center in Incheon.
METHODS
We performed a retrospective 2-year observational study,
Fig. 1. Pictures of the personal mobility. (A) Electric scooter, a stand-up scooter with a small platform with two wheels driven by an electric motor. (B) Electric unicycle, a single-rider electrically powered unicycle.
(C) Self-balancing scooter with handle. (D) Self-balancing scooter with no handle (hov- erboard), a self-balancing powered vehicle with two parallel wheels, where the rider’s foot position or the sensor in handle causes the vehicle to move. (E) Electric bicycle, a bi- cycle propelled in part or solely by recharge- able electric batteries.
A
D
b
E
C
which gathered data from January 2016 to December 2017, on the patients who visited the emergency center and trauma center, with an injury due to the personal mobility accident. Our hospital possess around 1,600 inpatient beds, with annual visit over 100,000 patients to the emergency department and over 1,000 patients to the trauma center.
Cases of the personal mobility-related accident were collected based on electronic medical records and hospital emergency department-based Injury in-depth Surveil- lance data. Hospital emergency department-based injury in-depth surveillance data about the traffic accident is col- lected by eight designated hospitals under the supervision of the Korea Centers for Disease Control and Prevention.
Pedestrians who were injured due to the collision with the personal mobility were excluded from this study.
Data collection included age, sex, vehicle type, mecha- nism of the accident, location, day of the week and time of the accident, transportation to visit the emergency center, type of activity during the accident, alcohol consumption, protection gear, initial Korean Triage and Acuity Scale (KTAS), injured body parts, injury type, disposition of the patients, and length of stay while admission. Injury severi- ty was measured using Excess Mortality Ratio-adjusted In- jury Severity Score (EMR-ISS) based on the International Statistical Classification of Diseases and Related Health Problems (ICD)-10 code for injuries. EMR-ISS was mea- sured as the sum of squares of three maximum severity grades. EMR-ISS severity was classified into four groups:
mild (1≤ EMR-ISS ≤8), moderate (9≤ EMR-ISS ≤24), se- vere (25≤ EMR-ISS≤ 75) and critical injury group (death).
Data entry was performed using Excel 2013 (Microsoft Corp., Redmond, WA, USA) We conducted statistical analysis using IBM SPSS Statistics for Windows, version 22.0 (IBM Corp., Armonk, NY, USA). We analyzed asso- ciations between the EMR-ISS and demographic variables using a multivariate logistic regression analysis. EMR-ISS was the dependent variable. A p-value <0.05 was consid- ered statistically significant.
RESULTS
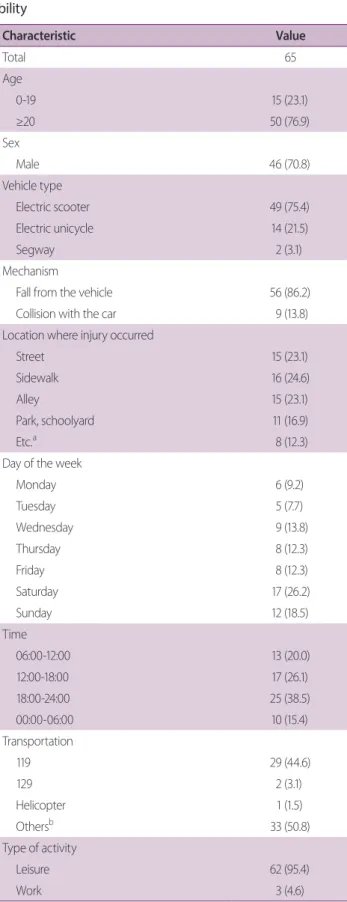
During the 2-year study period, a total of 65 patients with
the personal mobility accident visited the emergency cen- ter (Table 1). The mean age of the patients was 30.4 years (range, 8-61). There were 50 adult patients and 15 pediat- ric patients (76.9% vs. 23.1%), and 46 male patients and 19 female patients (70.8% vs. 29.2%). The most used ve- hicle were electric scooter, leading to electric unicycle and Segway (Segway Inc., Bedford, NH, USA); which account- ed for 49, 14, and tow patients respectively (75.4%, 21.5%, and 3.1%). There were no data of other personal mobility such as, a hoverboard or an electric bicycle. The majority of the mechanism of accident were due to falling off from the vehicle, without colliding with any other objects, due to loss of balance (n=56, 86.2%) and nine patients out of 65 collided with the car (13.8%). Most of the injuries occurred on the sidewalk, street, and the alley (24.6%, 23.1%, and 23.1%). The day of the week with the most patients were on the weekends; Saturday with 17 patients (26.2%) and Sunday with 12 patients (18.5%). The most common time of the accident occurred between 18:00 and 24:00, which accounted for 25 patients (38.5%), followed by between 12:00 and 18:00, 06:00 and 12:00 (26.1% and 20.0%). Ninety-five point four percent of the accidents happened during the leisure activity. Six patients of 50 adults (12%) admitted the alcohol consumption and only two patients, 24 year-old male and 25 year-old male, wore the helmet as the protection gear (3.1%). The initial KTAS score, scored by the triage nurse, of the 48 patients were in the score 4 group (73.8%), followed by score 3 and 2;
which accounted for 12 and four patients (18.5% and 6.2%). But there was escalations in the final KTAS status on 10 patients, who were discharged with KTAS score of 3. Two patients who wore the helmet were in the score 4 group. Four patients with alcohol consumption were in score 4 group and one patient was in score 2 group and other in score 3 group. According to the distribution of monthly occurrence, the most accidents happened in June and September (13 vs. 11, 20.0% vs. 16.9%) (Fig. 2).
The number of the patients in 2017 rose three times more than the number of patients in 2016 (51 vs. 14).
The number of the injured body parts due to the per- sonal mobility accidents is shown on the Fig. 3A. The most injured body part was the head and neck region with a percentage of 67.7%. Next were upper extremity and lower extremity, which accounted for 46.2% and 33.8%,
respectively (overlap due to multiple injuries). The injury types are shown on Fig. 3B. The most common injury type was laceration/abrasion (n=44, 67.7%). The body part with the most laceration/abrasion was the face (n=41, 63.1%), followed by the upper extremity with 20.0% (Ta- ble 2). The second and third most common injury type were fracture and contusion/sprain (47.7% and 44.6%).
The most common fracture site was the facial bone (n=13, 20.0%), followed by upper extremity (18.5%). Zygoma, maxilla, mandible, orbital wall, alveolar bone, nasal bone were the fracture sites of the facial bone. Six out of 12 patients with the upper extremity fracture were elbow fractures (50%). All the fractures in the torso fracture group were clavicle fractures (6.1%). Twenty-six patients Table 1. Demographics of patients injured by personal mo-
bility
Characteristic Value
Total 65
Age
0-19 15 (23.1)
≥20 50 (76.9)
Sex
Male 46 (70.8)
Vehicle type
Electric scooter 49 (75.4)
Electric unicycle 14 (21.5)
Segway 2 (3.1)
Mechanism
Fall from the vehicle 56 (86.2)
Collision with the car 9 (13.8)
Location where injury occurred
Street 15 (23.1)
Sidewalk 16 (24.6)
Alley 15 (23.1)
Park, schoolyard 11 (16.9)
Etc.a 8 (12.3)
Day of the week
Monday 6 (9.2)
Tuesday 5 (7.7)
Wednesday 9 (13.8)
Thursday 8 (12.3)
Friday 8 (12.3)
Saturday 17 (26.2)
Sunday 12 (18.5)
Time
06:00-12:00 13 (20.0)
12:00-18:00 17 (26.1)
18:00-24:00 25 (38.5)
00:00-06:00 10 (15.4)
Transportation
119 29 (44.6)
129 2 (3.1)
Helicopter 1 (1.5)
Othersb 33 (50.8)
Type of activity
Leisure 62 (95.4)
Work 3 (4.6)
Characteristic Value
Alcohol consumption
Yes 6 (9.2)
Protection Gear
Yes 2 (3.1)
Initial KTAS
1 0 (0)
2 4 (6.2)
3 12 (18.5)
4 48 (73.8)
5 1 (1.5)
Values are presented as number (%).
Etc.: et cetera., KTAS: Korean Triage and Acuity Scale.
aRoads in the apartment complex, parking lot, home, bicycle road.
bOn foot, by car, any other public transport.
Table 1. Continued
Fig. 2. The number of personal mobility patients from 2016 to 2017.
(40%) had a concussion and three patients (11.5%) had intracranial hemorrhage, in which two of them had com- bined skull fracture. Fourteen patients had dental injuries.
Intra-abdominal injury and spinal cord injury were not present in this study.
Eighty point zero percent of the patients were dis- charged from the hospital (Table 3). Two patients were transferred to other hospital by Orthopedics Department (3.1%). Eleven patients (16.9%) were admitted to the hospital, of whom seven underwent surgery. Most surger- ies were operated by the Orthopedic Department (n=6, 66.7%), followed by Plastic Surgery (n=2, 22.2%) and Table 2. The number of fracture and Lac+Abr of each body region
Lac+Abr Fracture
Total 71 33
Head 5 (7.7) 2 (3.1)
Face 41 (63.1) 13 (20.0)
Torso 1 (1.5) 4 (6.2)
Upper extremity 13 (20.0) 12 (18.5)
Lower extremity 11 (16.9) 2 (3.1)
Values are presented as number (%).
Lac: laceration, Abr: abrasion.
Table 3. Disposition and EMR-ISS of the patients injured by personal mobility
Value Disposition
Discharge 52 (80.0)
Ward admission 2 (3.1)
Ward admission after surgery 6 (12.3)
ICU admission 2 (3.1)
ICU admission after surgery 1 (1.5)
Transfer 2 (3.1)
Death 0 (0)
Length of stay (days)
Ward 6.5
ICU 19.3
EMR-ISSa
Mild 14 (21.5)
Moderate 40 (61.5)
Severe 11 (16.9)
Critical injury group 0 (0)
Values are presented as number (%).
ICU: Intensive care unit, EMR-ISS: excess mortality ratio-adjusted injury severity score.
aMild (1≤ EMR-ISS ≤8), moderate (9≤ EMR-ISS ≤24), severe (25≤ EMR-ISS
≤75), critical injury group (death).
Fig. 3. The number and percentage of injured body parts (A) and injury types (B) by personal mobility.
A b
Neurosurgery Department (n=1, 11.1%). Eight out of 11 patients, all the plastic surgery, orthopedic patients and two of Neurosurgery patients, were admitted to ward.
Three out of 65 patients admitted through the trauma center and all three patients showed a severe head trauma.
Two patients were admitted to the intensive care unit (ICU) and one of the patients underwent emergency cra- niectomy. The EMR-ISS had a mean value of 17.2 (range, 1-75). Severe group and critical injury group consists of
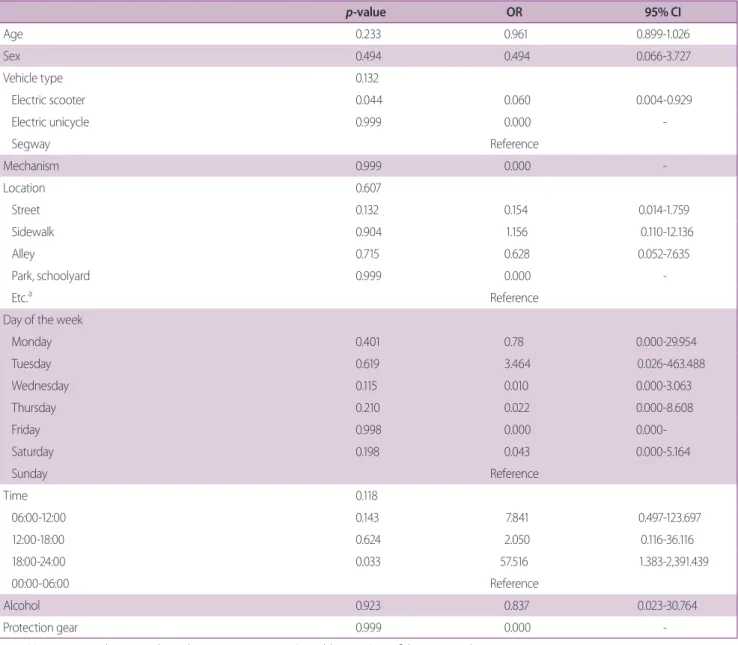
11 patients, which in comparison, mild and moderate group consists of 54 patients (16.9% vs. 83.1%). The av- erage length of hospital stay was 7.3 days for ward and 19.3 days for ICU. Logistic regression analysis between the EMR-ISS and demographics of the patients, injured body parts, and injury type were done (Tables 4, 5). However, no variable was statistically significant.
Table 4. Logistic regression analysis between EMR-ISS and the demographics
p-value OR 95% CI
Age 0.233 0.961 0.899-1.026
Sex 0.494 0.494 0.066-3.727
Vehicle type 0.132
Electric scooter 0.044 0.060 0.004-0.929
Electric unicycle 0.999 0.000 -
Segway Reference
Mechanism 0.999 0.000 -
Location 0.607
Street 0.132 0.154 0.014-1.759
Sidewalk 0.904 1.156 0.110-12.136
Alley 0.715 0.628 0.052-7.635
Park, schoolyard 0.999 0.000 -
Etc.a Reference
Day of the week
Monday 0.401 0.78 0.000-29.954
Tuesday 0.619 3.464 0.026-463.488
Wednesday 0.115 0.010 0.000-3.063
Thursday 0.210 0.022 0.000-8.608
Friday 0.998 0.000 0.000-
Saturday 0.198 0.043 0.000-5.164
Sunday Reference
Time 0.118
06:00-12:00 0.143 7.841 0.497-123.697
12:00-18:00 0.624 2.050 0.116-36.116
18:00-24:00 0.033 57.516 1.383-2,391.439
00:00-06:00 Reference
Alcohol 0.923 0.837 0.023-30.764
Protection gear 0.999 0.000 -
EMR-ISS: excess mortality ratio-adjusted injury severity score, OR: odds ratio, CI: confidence interval, Etc.: et cetera.
aRoads in the apartment complex, parking lot, home, bicycle road.
DISCUSSION
To our best knowledge, this study is one of the first emer- gency department based observational studies in South Korea to look at the demographics of the patients, both pediatric and adult, injured by all the personal mobility.
Our study showed the increase of the number of the pa- tient who were injured by operating the personal mobility and the accidents happened mostly by falling off the vehi- cle, due to loss of balance. It was confirmed that the most common injury body region was on the head and neck region, and upper extremity. The study showed 16.9%
of the patients were classified in EMR-ISS, as the severe group, however there was only two patients who wore the protective gear in this study.
The interest of the personal motility has risen quickly after its introduction to the market. Personal mobility has the strength of portability [8]. It is light and some are designed to be foldable, which makes it convenient to carry around and use along with other public transpor- tations. Furthermore, it is environmentally friendly with low carbon dioxide emission. It is an excellent leisure and transport vehicle, for its’ speed of 20 to 40 km/hr. with lower maintenance cost. However, the vehicle requires a high level of balance, coordination, and strength, and if not properly operated by following the instructions in user manuals, may lead to injury [9]. Furthermore, even though the rider drove the vehicle as written on the man-
ual, the rider still may lose balance and be injured due to the surrounding environment, such as the rough road, the curb, or the sudden appearance of the pedestrians and cars. It also has the fire hazard risk of the lithium battery used to power the device. There were a number of recalls including the largest issued by the United States Con- sumer Product Safety Commission on July 6, 2016, which recalled over 500,000 hoverboards, due to this problem [1,10]. However, there were none in this study.
Most of the other studies from abroad were based on the pediatric patients [1,5,9,11-13]. Hermon et al. [11]
reported that older children were more likely to be on E-bike and younger children were injured as pedestrians.
Fifty out of 65 patients were adults and predominantly male. The inclusion of adult patients as well as the pe- diatric patients is considered a strength of this study.
Importantly, there is no rule set for the personal mobility in South Korea. The personal mobility is classified as the
“motor bicycle”, a vehicle of no more than 125 mL pis- ton displacement, by the Road Traffic Act [8]. Thus, to operate the motor bicycle, the driver’s license is required and to obtain the driver’s license, the driver must be over 16 years old. However, our study showed only three pa- tients, among the pediatric patients, who were eligible to have driver’s license. Moreover, as the personal mobility is classified as the motor bicycle, it is required to be op- erated only on the streets. We showed that most of the accidents, more than 50% were not on the street or on the
Table 5. Logistic regression analysis between EMR-ISS and the injured body parts, and injury type
p-value OR 95% CI
Injured body parts
Head and neck 0.998 5.755E7 0.000-
Trunk 0.365 0.267 0.015-4.649
Upper extremity 0.270 0.315 0.074-32.506
Lower extremity 0.788 1.522 1.334-201.642
Injury type
Fracture 0.029 14.305 1.334-201.642
Contusion/sprain 0.900 0.867 0.093-8.052
Laceration/abrasion 0.392 3.429 0.204-57.572
Concussion 0.117 6.683 0.622-71.787
Dental injury 0.683 1.576 0.177-14.008
EMR-ISS: excess mortality ratio-adjusted injury severity score, OR: odds ratio, CI: confidence interval.
alley. With the increasing number of the personal mobil- ity owners and accidents, and without strict regulation where to ride the vehicle, the pedestrians could be high in risk of getting injured. However, we did not include the pedestrian injury in this study and further research on this matter is needed. Lastly, six patients of 50 adults admitted the alcohol consumption which is prohibited.
The incidence of the traffic accidents is 220,000 cases each year and 20,000 of which are driving under the influence accidents, which is similar to this study (9.2%) [14]. There is a safety concern that drivers are not aware of where to drive the devices, whether they need a driver’s license, or wear a protection gear. As the current law does not have any practical regulations on the personal mobility that emerged as a new form of transportation, new regulations on the personal mobility is needed. German, as well as United Kingdom, requires an approval and registration of the motor vehicle, so the unapproved personal transpor- tation system cannot be operated on the street [8]. How- ever, the two-wheeled vehicle with handrail and handle bar, and with maximum speed to 20 km/hr, could be op- erated on the street and bike road. As well as abroad, our country should improve the regulation about the personal mobility with stricter policy and providing the safety edu- cation.
In other studies about the hoverboard-related injuries, the patients sharply increases on December [1,13]. The reason for this result is probably due to Christmas holi- day season and the hoverboard, one of the most beloved presents, is capable of operating indoors, regardless of the weather. However, our study had the highest number of patients in June and September, with a slight decrease in patients in July and August. It is considered that, com- pared to the studies abroad, the reason for the difference is that the most of the patients included in this study were mostly adults and climate characteristics of South Korea, which is very hot in summer and very cold in winter.
Our study showed the number of patients in 2017 rises three times more than the patients in 2016. Siracuse et al.
[1] found the increased incidence of injuries associated with powered scooters or skateboards, with an average increase of 208% in 2015. The increase of the personal mobility related patients shows the urgent needs of find- ing a way to prevent the injury. Interestingly, the study
showed the injuries were concentrated on the head and face (67.7%). Fifteen out of 33 fractures and the 46 out of 71 laceration and the abrasions were on head and face, which needed emergency consultations to plastic surgery, dentistry, neurosurgery, otorhinolaryngology, and oph- thalmology specialists. Head injuries were usually mild, however, 3 out of 26 head injury patients (11.5%) had intracranial hemorrhage and two of them had combined skull fracture. Hermon et al. [11] reported the high rate of head region injury (40%) in pediatric e-bike accident.
Weber et al. [15] showed a higher rate of brain injury (75%) for adult E-bikers. Weingart et al. [2] reported that in head-injured patients by the hoverboard, the median cost of the hospital care increased by over USD 1,000.00 compared to non-head injured patients. This is the alarm sign for the personal mobility riders to wear helmets. The use of protective gear was very low in this study at 3.1%, even though it is a regulation to do so. It is well known that helmet reduces brain injuries and facial injuries on vehicle accidents [16-21]. Helmet use has been estimated to reduce the risk for serious head and face injury by up to 88% [21]. Therefore, the helmets must be implemented as a necessary. Not only head trauma but also, numerous of upper extremity fractures occurred. Twelve out of 33 fractures were on the upper extremity. Siracuse et al. [1]
reported the forearm fracture increase in 2015 by 475%.
The preventative benefits of wrist and elbow guards have been approved by numerous studies [22-24]. These pro- tective gears could not only protect us from injury but also shorten the length of stay in the hospital and reduce the medical expenses [2]. The regulation of the use of the protective gear while operating the personal mobility, must be strengthened.
In our study, there were three patients with intracra- nial hemorrhage. Eleven patients (16.9%) was classified as severe group in EMR-ISS. Hermon et al. [11] reported nine patients, out of 97 (9.3%), with ISSs greater than nine and two patients were diagnosed with grade 3 splenic laceration. It is possible to consider as a rather small case, however, the number and severity of the accident will rise as the popularity increases, and it is important to prepare for this matter.
There are several limitations in this study. First, the length of the research time is short. The data collection
about the personal mobility by hospital emergency de- partment-based injury in-depth surveillance has only started in 2016, therefore, the sample size is relatively small. Although, the introduction of the Segway, the first personal mobility product, was in 2001, due to its’ cost, it was not until 2014 that the personal mobility became popular as conveyance. We think it is a timely study, as the number of personal mobility is currently increas- ing in South Korea. Secondly, it is a single-center study.
However, our emergency center has the largest number of patients among, not only the hospitals participating in Surveillance, but also all the hospitals in South Korea. Ad- ditionally, this is the first study reported in South Korea.
Surely, the multi-center study will be needed for the fur- ther analysis in the future. Last of all, this is a retrospective study and the nature of study and electric medical record lacks detail records of the accident and the injury. Due to the nature of the emergency center-based surveys, data had to be collected retrospectively. Though, it has the limitation of gathering data, the retrospective emergency center-based survey best represents the information about the acute stage of patients and prehospital state, and is a useful method for the prevention policy, providing the basis for the improvement of the regulation and safety education, and setting the health indicators.
CONCLUSION
The use of personal mobility will continue to grow due to the development of domestic leisure culture, the pro- motion of eco-friendly policies, and the prevalence of individualism. Unfortunately, the accidents related to the personal mobility will increase along with it. To reduce the damage caused by the accidents, and social and eco- nomic expenses, the improvement of the regulation of the personal mobility, safety education and operation train- ing, mandating the educations by the merchandisers are needed
REFERENCES
1. Siracuse BL, Ippolito JA, Gibson PD, Beebe KS. Hoverboards: a
new cause of pediatric morbidity. Injury 2017;48:1110-4.
2. Weingart GS, Glueckert L, Cachaper GA, Zimbro KS, Maduro RS, Counselman F. Injuries associated with hoverboard use: a case series of emergency department patients. West J Emerg Med 2017;18:993-9
3. Crystal Market Research (CMR): Personal mobility devices market by product - global industry analysis and forecast to 2022 [Internet]. Las Vegas: CMR 2017 [cited 2018 Aug 1]. Avail- able from: https://www.crystalmarketresearch.com/report/per- sonal-mobility-devices-market.
4. The Korea Transport Institute (KOTI). Domestic person- al mobility market, expected to triple from 60,000 units in 2016 to 200,000 units in 2022 [Internet]. Sejong: KOTI 2017 [cited 2018 Aug 1]. Available from: https://www.koti.
re.kr/user/bbs/BD_selectBbs.do?q_bbsCode=1005&q_bb- scttSn=20170906164600945&q_clCode=1&q_lwprtClCode=-1.
5. Ho M, Horn BD, Lin IC, Chang B, Carrigan RB, Shah A. Mus- culoskeletal injuries resulting from use of hoverboards: safety concerns with an unregulated consumer product. Clin Pediatr (Phila) 2018;57:31-5.
6. Zhou SA, Ho AFW, Ong MEH, Liu N, Pek PP, Wang YQ, et al. Electric bicycle-related injuries presenting to a provincial hospital in China: a retrospective study. Medicine (Baltimore) 2017;96:e7395.
7. Lee SI, Kim SH, Kim TH. A comparison study on the risk and accident characteristics of personal mobility. J Korean Soc Saf 2017;32:151-9.
8. The Korea Transport Institute (KOTI). Study on the im- provement of laws and regulations for personal mobilities [Internet]. Sejong: KOTI 2016 [cited 2018 Aug 1]. Available from: https://www.koti.re.kr/user/bbs/BD_selectBbs.do?q_
bbsCode=1017&q_bbscttSn=20170206083657894&q_cl- Code=2&q_art=N.
9. Sobel AD, Reid DB, Blood TD, Daniels AH, Cruz AI Jr. Pediatric orthopedic hoverboard injuries: a prospectively enrolled cohort.
J Pediatr 2017;190:271-4.
10. United States Consumer product Safety Commission (CPSC).
Self-balancing scooters/hoverboards recalled by 10 firms due to fire hazard [Internet]. Bethesda: CPSC 2016 [cited 2018 Aug 1].
Available from: https://www.cpsc.gov/Recalls/2016/Self-Balanc- ing-Scooters-Hoverboards-Recalled-by-10-Firms.
11. Hermon K, Capua T, Glatstein M, Scolnik D, Tavor O, Rimon A.
Pediatric electric bicycle injuries: the experience of a large urban tertiary care pediatric hospital. Pediatr Emerg Care 2018 Jan 11
[Epub]. http://dx.doi.org/10.1097/PEC.0000000000001395.
12. Moneteilh C, Patel P, Gaffney J. Musculoskeletal injuries asso- ciated with hoverboard use in children. Clin Pediatr (Phila) 2017;56:909-11.
13. Schapiro AH, Lall NU, Anton CG, Trout AT. Hoverboards: spec- trum of injury and association with an uncommon fracture.
Pediatr Radiol 2017;47:437-41.
14. Korea Road Traffic Authority. Driving under the influ- ence [Internet]. Wonju: KoROAD 2018 [cited 2018 Aug 1].
Available from: http://taas.koroad.or.kr/sta/acs/exs/typical.
do?menuId=WEB_KMP_OVT_UAS_ASA.
15. Weber T, Scaramuzza G, Schmitt KU. Evaluation of e-bike acci- dents in Switzerland. Accid Anal Prev 2014;73:47-52.
16. Daverio M, Babl FE, Barker R, Gregori D, Da Dalt L, Bressan S.
Helmet use in preventing acute concussive symptoms in recre- ational vehicle related head trauma. Brain Inj 2018;32:335-41.
17. Ong JS, Soundappan SV, Adams S, Adams S. Helmet use in bicycles and non-motorised wheeled recreational vehicles in children. J Paediatr Child Health 2018;54:968-74.
18. Rostas JW, Donnellan KA, Gonzalez RP, Brevard SB, Ahmed N, Rogers EA, et al. Helmet use is associated with a decrease in
intracranial hemorrhage following all-terrain vehicle crashes. J Trauma Acute Care Surg 2014;76:201-4.
19. Fitzpatrick DG, Goh M, Howlett DC, Williams M. Bicycle hel- mets are protective against facial injuries, including facial frac- tures: a meta-analysis. Int J Oral Maxillofac Surg 2018;47:1121- 5.
20. Hwang K, Jeon YM, Ko YS, Kim YS. Relationship between loca- tions of facial injury and the use of bicycle helmets: A systemat- ic review. Arch Plast Surg 2015;42:407-10.
21. Thompson DC, Rivara FP, Thompson R. Helmets for prevent- ing head and facial injuries in bicyclists. Cochrane Database Syst Rev 2000;(2):CD001855.
22. Lewis LM, West OC, Standeven J, Jarvis HE. Do wrist guards protect against fractures? Ann Emerg Med 1997;29:766-9.
23. Orenstein JB. Injuries and small-wheel skates. Ann Emerg Med 1996;27:204-9.
24. Schieber RA, Branche-Dorsey CM, Ryan GW, Rutherford GW Jr, Stevens JA, O’Neil J. Risk factors for injuries from in- Line skating and the effectiveness of safety gear. N Engl J Med 1996;335:1630-5.