https://doi.org/10.15204/jkobgy.2021.34.1.048
창부도담탕이 비만 유도 흰쥐에 미치는 영향
동신대학교 한의과대학 한방부인과교실 김수현, 이은규, 최유진, 조성희, 양승정
ABSTRACT
Effects of Changbudodam-tang on Obesity-induced Rats Soo-Hyeon Kim, Eun-Kyu Lee, Yoo-Jin Choe,
Seong-Hui Jo, Seung-Jeong Yang
Dept. of Korean Gynecology and Obstetrics, College of Korean Medicine, Dong-Shin University
Objectives: This study was designed to evaluate the efficacy of Changbudodam-tang on obesity by using high-fat diet rats.
Methods: Rats were divided into five groups. Normal group: Normal diet, Control group: High-fat diet, Positive control group: High-fat diet+Dietamin 4 mg/kg/day, Changbudodam-tang -Low group: High-fat diet+ Changbudodam-tang 250 mg/kg/day, Changbudodam-tang -High group: High-fat diet+ Changbudodam-tang 500 mg/kg/day.
Weight, food intake were measured every week. After 7 weeks, total cholesterol, high density lipoprotein-cholesterol, low density lipoprotein-cholesterol, Triglyceride, free fatty acid, aspartate aminotransferase, alanine aminotransferase, complete blood count were measured and messenger ribonucleic acid expression of adiponectin, peroxisome proliferator-activated receptor-γ, leptin were observed using Reverse transcription polymerase chain reaction of liver cells.
Results: There was no difference in food intake between groups. Body weight tended to decrease compared with the Control group, but it wasn’t statistically meaningfull. The total cholesterol, low density lipoprotein-cholesterol, Triglyceride, free fatty acid tended to decrease compared with the Control group. High density lipoprotein-cholesterol tended to decrease compared with the Control group, but it wasn’t statistically meaningfull. White blood cell, red blood cell, hemoglobin, platelet, aspartate aminotransferase, alanine aminotransferase were not affected by Changbudodam-tang . The messenger ribonucleic acid expression of Adiponectin, peroxisome proliferator- activated receptor-γ, leptin, which are involved in the differentiation of adipocytes, was decreased compared with the Control group.
Conclusions: Based on the results above, it is suggested that Changbudodam-tang can be applied to improving serum lipid levels in obese patients caused by high fat diets.
Key Words: 3T3-L1 Cells, Diet, High-Fat, Obesity, Hyperlipidemias, Serum
4)
Corresponding author(Seung-Jeong Yang) : Dong-Shin University Naju Korean Medicine Hospital,
14, Kyoyuk-kil, Naju-si, Korea
Ⅰ. 서 론
비만이란 지방조직이 과도하게 축적된 상태를 의미하며, 단순히 하나의 질병이 아닌 지방세포의 비대나 수적인 증가에 의해서 지방 조직(adipose tissue)의 축적 이 증가하고 대사 장애를 동반하는 질환 의 집합체라고 할 수 있다 1) . 비만한 경우 에는 제2형 당뇨병, 고혈압, 심혈관질환, 고관절 및 슬관절 등 체중 지지 관절의 골관절염, 악성종양, 폐쇄성 수면 무호흡 증, 담낭 질환 등 동반질환의 발생률이 높으며, 체질량지수가 30 kg/m 2 를 초과 하는 경우 사망률의 증가와 관련된다 2,3) . 우리나라는 근래 서구화된 식생활과 운동량의 감소로 인하여 비만 인구가 증 가하고 있다. 2018년도 국민 건강영양조 사에 따르면 만 19세 이상의 체질량지수 (kg/m 2 )가 25 이상인 분율이 34.6%에 달하고(남자 42.8%, 여자 25.5%), 특히 남자는 2009년도의 35.8%에서 꾸준히 상 승세에 있는 실정이다 4) . 또한 이에 따른 사회적 비용도 증가하고 있는데 2016년 한해 국내에서 비만으로 인하여 지출된 의료비와 간병비 등 사회적 비용이 11조 5000억 원가량 된다는 분석 결과가 보고 되었다 5) .
서양의학에서는 이러한 비만의 치료로 서 운동과 식이요법 등 생활습관을 교정 하는 방법을 비롯하여 약물 및 수술의 방법 등이 시행되고 있으며 6) , 이중 약물 치료는 다양한 부작용과 사용상의 금기 로 인하여 한계점이 있다 7,8) .
한의학에서는 비만의 원인에 대하여 심리적 이완, 영양과잉 및 활동 부족, 氣 虛, 痰濕 등으로 보고 있으며 각각 心寬
體胖, 肥貴人, 肥人多氣虛, 肥人多痰’ 혹 은 ‘肥人多濕’이라는 용어로 언급하고 있 으며, 腎虛를 병기의 本으로 보고 痰, 濁, 脂, 瘀 등을 標로 인식하고 있다 1) . 辨證 治療로는 脾虛濕阻型은 健利濕하고, 胃 熱濕阻型은 淸熱利濕하고, 肝氣鬱結型은 疏肝理氣하고, 氣滯血瘀型은 理氣活血하 고, 痰濁中阻型은 健脾化痰하고, 脾腎陽 虛型은 溫腎健脾하는 방법이 있다 1) .
蒼附導痰丸은 淸代 葉이 選한 ≪葉天士女 科≫에 記載된 處方으로, 이는 形盛多痰하여 數月行經, 形肥痰滯經閉, 肥人白帶多痰한 경우에 사용되었으며 9) , 본 연구에서는 ≪證 脈 方藥合編≫ 10) 에 수록된 蒼附導痰湯의 약재의 구성과 용량을 참조하였다. 창부도 담탕(蒼附導痰湯, Changbudodam-tang , 이하 CBDT)의 선행 연구로는 다낭성 난소 증 후군에 대한 효과 11) , 습담에 작용함으로써 진통 작용, 소장 흡수력 증가, 고지혈증의 완화에 대한 효과 12) , 배란에 대한 효과 13) 등이 밝혀졌으나, 비만에 미치는 영향에 대 한 실험 연구는 아직 진행된 바가 없었다.
이에 저자는 CBDT가 비만에 미치는
영향을 실험적으로 알아보고자 고지방
식이로 비만을 유발한 흰쥐를 대상으로
CBDT 투여에 따른 체중 및 혈액학적
변화, 지질 대사와 관련된 adiponectin,
peroxisome proliferator-activated receptor-γ
(PPAR-γ), leptin의 messenger ribonucleic
acid(mRNA) 발현 정도를 Reverse
transcription polymerase chain reaction
(RT-PCR)을 통해 관찰하여 유의성 있
는 결과를 얻었으므로 보고하는 바이다.
Ⅱ. 재료 및 방법
1. 재 료
1) 약재 및 처방 구성
본 실험에 사용된 약재는 동신대학교 목포 한방병원에서 공급받았으며, 창부
도담탕( Changbudodam-tang , 이하 CBDT) 의 구성과 용량은 ≪證脈 方藥合編 增補 方≫ 10) 에 준하였으며 처방 1첩의 내용, 분량, 학명 및 생약명은 아래 표(Table 1) 와 같다.
Herb name Scientific name Weight
(g) 蒼 朮 Atractylodis Rhizoma Atractylodes lancea, Atractylodes chinensis 7.5
香附子 Cyperi Rhizoma Cyperus rotundus 7.5
枳 殼 Aurantii Fructus Immaturus Citrus aurantum, Citrus natsudaidai 7.5 陳 皮 Citri Unshius Pericarpium Citrus unshiu, Citrus reticulata 5.625
白茯苓 Poria Sclerotium Poria cocos 5.625
膽南星 Arisaematis Rhizoma Arisaema amurense 3.75
甘 草 Glycyrrhizae Radix et Rhizoma Glycyrrhiza uralensis 3.75 神 麯 Massa Medicata Fermentata Triticum aestivum 1.875
生 薑 Zingiberis Rhizoma Zingiber officinale 3.75
總 量 46.875
Table 1. Prescription of Changbudodam-tang (CBDT)
2) 동물 및 사육조건
실험동물은 생후 6주령의 Spraque-Dawley 계 수컷 흰쥐로서 동신대학교 동물실험 윤리위원회의 동물실험계획 승인(2020-08 -25)을 거쳐 샘타코(주)에서 공급받았으 며 고형사료와 물을 충분히 공급하며 1주 일 동안 사육실 환경에서 적응시킨 후 실험에 사용하였다.
2. 방 법 1) 시료 추출
CBDT 2첩 분량인 93.75 g을 증류수 1,500 ml에 넣고 100℃에서 2시간 동안 전탕하여 얻은 추출액을 3,000 rpm 하에서 10분 동안 원심분리하여 상층액을 얻었다.
이 상층액을 rotary vacuum evaporator로 감압 농축한 다음, 이를 동결건조기(Ilshin,
Korea)로 동결건조하여 16.92 g(수득률 18.05%)의 분말을 획득하였다.
2) 비만 유도 흰쥐에서의 항비만 및 지질 대사 개선에 미치는 영향 (1) 비만 유도
비만 유도는 Protein 20%, Fat 60%, Carbohydrate 20%로 구성된 고지방 사 료인 60% High Fat Diet(5.21 Kcal/g, Reserch-Diet, USA)를 7주 동안 흰쥐에 게 공급하여 비만을 유도하였다.
(2) 실험군 분류
비만을 유도하지 않은 정상군(Normal
군), 비만을 유도하고 약물 처치를 하지
않은 대조군(Control 군), 비만을 유도하고
식욕억제제인 디에타민정(Dietamin Ⓡ , 대
웅제약, 성분 Phentermine Hydrochloride)
을 성인 기준 투여량 37.5 mg(60 kg/day)
에 흰쥐의 body suface area를 적용하여 4 mg/kg/day씩 투여한 군을 양성대조군 (P-Con 군)으로 설정하였다. 그리고 비 만을 유발하고 CBDT 250 mg/kg/day를 구강 투여한 군을 CBDT-L 군으로, 비 만을 유발하고 CBDT 500 mg/kg/day를 투여한 군을 CBDT-H 군으로 나누었다.
각 실험군의 개체 수는 Normal 군을 8마 리, 그 외 실험군을 각각 9마리로 하여 실험을 시행하였다.
(3) 약물 투여
약물은 고지방 사료를 투여한 첫날부 터 총 7주간 식수에 타서 투여하였다.
Normal 군과 Control 군은 약물을 타지 않은 식수를 공급하였다.
(4) 체중 측정
약물 투여에 따른 체중의 변화를 알아보 기 위하여 첫날부터 매주 1회 총 7주간에 걸쳐 전자저울(HANA, KC-200, Korea)로 총 8회 측정하였으며, 최종 측정은 흰쥐 를 희생시키기 직전에 시행하였다.
(5) 식이 섭취량 측정
약물 투여에 따른 식이 섭취량의 변화 를 관찰하기 위하여 실험 개시 첫날부터 매주 1회 사료 섭취량을 계량하였다.
(6) 혈액 및 혈청학적 검사
흰쥐를 희생 전 12시간 동안 절식시킨 후 마취하고 심장천자로 혈액을 채집하고, 그 중 약 100 μl를 ethylenediaminetetraacetic acid(EDTA)-bottle에 넣고 Multispecies Hematology Analyser(Hemavet, USA)로 complete blood count(CBC)를 측정하였다.
나머지 혈액은 원심분리기(Vision, Korea) 로 3,000 rpm에서 20분간 원심분리하여 혈 청을 분리하였으며, 분리한 혈청은 검체검 사 전문기관인 (재) 씨젠 의료재단에 Total Cholesterol, Triglyceride, high density
lipoprotein(HDL)-cholesterol, low density lipoprotein(LDL)-cholesterol, Free fatty acid, Phosholipid, alanine aminotransferase(ALT), aspartate aminotransferase(AST)에 대한 검사를 의뢰하였다.
(7) RT-PCR을 활용한 adiponectin, PPAR-γ, leptin의 mRNA 발현 측정
① Total RNA 분리
실험동물을 희생시킨 후 간을 적출하 였다. Total RNA 분리는 간조직(50 mg) 을 800 μl TRIZOLreagent(Gibco-BRL, USA)로 homogenization 하여 균질화한 용액에 500 μl isopropanol(Sigma, USA) 을 첨가하고 실온에서 5분간 방치 후에 RNA 분리를 위해 4℃, 13,000 rpm에서 5분간 원심분리하여, 원심분리로 생긴 pellet에 냉장 보관한 70% ethanol과 DEPC-treated water(Biosolution, Korea) 를 넣어 4℃, 13,000 rpm에서 5분간 원심 분리한 후에 pellet만 남기고 모두 제거한 다. 남은 ethanol은 실온에서 10분간 방치 시켜 건조한 다음 Diethylpyrocarbonate (DEPC)-treated water에 녹여 Biophotometer (Eppendorf, Germany)로 260 nm에서 OD260 값을 측정해 RNA의 순도 농도를 정량 했다. total RNA는 사용 전까지 -20℃에 서 보관하였다.
② RT-PCR에 의한 측정
분리된 total RNA 5 μg를 Mastercycler gradient(Eppendorf, Germany)을 이용해 서 50 μl complementary deoxyribonucleic acid(cDNA)를 합성시켜 PCR 증폭을 위 한 template로 사용하였다.
PCR은 cDNA, sense primer, antisense
primer, DEPC-treated water를 PCR premix
(Bioneer, Korea)에 넣었고 Mastercycler
gradient(Eppendorf, Germany)에서 cDNA 를 증폭하였다. 이렇게 증폭된 RT-PCR 산물은 1.5% agarose gel을 통하여 전기 영동한 후 Gel lmaing system(Davinch-K, Korea)으로 PCR product를 확인하였다.
3. 통계 분석
실험 군 간의 효과를 분석하기 위하여 수집된 자료를 통계 프로그램인 IBM Statistical Package for the Social Sciences (SPSS) Statistics 25를 활용하여 통계적 유의성을 검증하였다. 각 군별 평균 비교 를 통한 유의성 검증은 일원 배치 분산분
석(one-way analysis of variance)을 사 용하였다. 사후 검정은 Tukey 방식을 채 택하였고 p-value가 0.05 미만인 경우에 유의한 것으로 인정하였다.
Ⅲ. 성 적
1. 흰쥐 체중의 동질성 검정
시료를 투여하기 전 총 5개군으로 분 류한 후 각 군 간의 체중이 동질하다는 검증을 실시하여 체중에 있어서 동질한 집단임을 확인하였다(Table 2).
Characteristics Normal (n=8) † Control ‡
(n=9) P-Con §
(n=9) CBDT-L ∥
(n=9) CBDT-H ¶
(n=9) F p weight (g) Body Mean SD 213.4 9.59 213.9 8.28 213.1 5.08 213.1 7.36 210.9 5.15 .178 .948
Normal†
: normal diet group, Control‡
: high-fat diet and no treatment group, P-Con§
(positive control) : high-fat diet and DietaminⓇ
treated group, CBDT-L∥
: high-fat diet and CBDT 250 mg/kg treated group, CBDT-H¶
: high-fat diet and CBDT 500 mg/kg treated group, Values are represented as mean±SD of 8 or 9 experiments.Table 2. Test of Homogeneity of Variances
2. 체중 변화
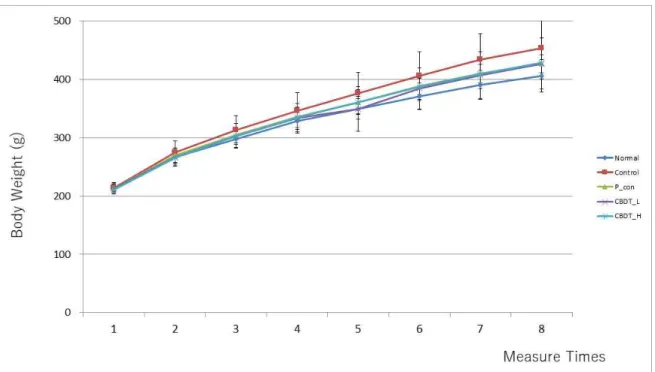
CBDT 투여가 흰쥐의 체중에 미치는 영향을 알아보기 위하여 실험 기간 동안 총 8회 흰쥐의 체중을 측정하였다. 고지 방 식이를 투여하지 않았던 Normal 군 에 비해 고지방 식이를 섭취한 다른 실
험군들의 체중이 증가하였다. P-Con 군과
CBDT-L 군, CBDT-H 군 모두 Control
군에 비해 전 구간에서 체중이 감소하였
으나 통계적인 유의성은 없었다(Table
3, Fig. 1).
Times
Group 1 2 3 4 5 6 7 8
Normal † Mean (g) 213.4 267.0 297.8 328.9 349.0 371.4 391.0 406.3 SD 9.59 13.20 14.21 18.87 17.60 22.35 24.58 28.16 Control ‡ Mean (g) 213.86 275.43 312.86 346.14 376.71 406.43 434.14 453.71
SD 8.28 19.03 24.67 31.41 35.72 40.73 44.59 47.17 P-Con § Mean (g) 213.13 270.13 304.75 335.75 360.50 388.25 409.88 426.50
SD 5.08 5.44 5.15 7.27 10.78 13.65 15.85 15.51 CBDT-L ∥ Mean (g) 213.14 267.14 303.29 333.43 349.29 384.00 407.43 427.14
SD 7.36 15.63 21.20 25.37 38.27 35.36 40.15 43.68 CBDT-H ¶ Mean (g) 210.86 265.29 303.00 335.14 361.00 387.14 409.29 428.43
SD 5.15 7.54 11.69 17.74 21.31 23.21 25.16 27.38
Normal†
: normal diet group, Control‡
: high-fat diet and no treatment group, P-Con§
(positive control) : high-fat diet and DietaminⓇ
treated group, CBDT-L∥
: high-fat diet and CBDT 250 mg/kg treated group, CBDT-H¶
: high-fat diet and CBDT 500 mg/kg treated group, Values are represented as mean±SD of 8 or 9 experiments.Table 3. The Changes of Weight on High-fat Diet And Drugs in Rats
Fig. 1. Effects of CBDT on the changes of body weight in obese rats.
Normal : normal diet group, Control : high-fat diet and no treatment group, P-Con (positive control) : high-fat diet and Dietamin
Ⓡ
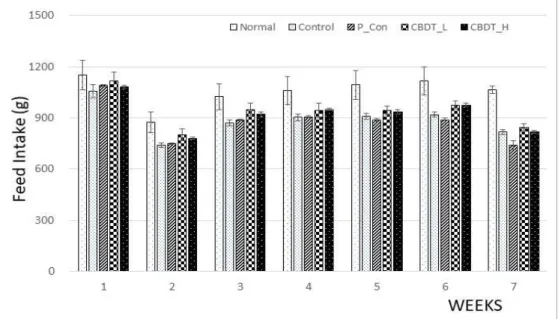
treated group, CBDT-L : high-fat diet and CBDT 250 mg/kg treated group, CBDT-H : high-fat diet and CBDT 500 mg/kg treated group, Values are represented as mean±SD of 8 or 9 experiments.3. 사료 섭취량의 변화
시료 투여 동안의 사료 섭취량을 1주 단위로 합산하여 분석한 결과, Control
군과 다른 실험군들 사이에서 통계적으
로 유의한 차이가 보이지 않았다(Table
4, Fig. 2).
Weeks
Group 1 2 3 4 5 6 7
Normal † Mean (g) 1151.0 873.0 1025.0 1062.0 1094.0 1116.0 1066.0 SD 84.89 59.92 76.40 82.53 84.72 81.71 21.55 Control ‡ Mean (g) 1057.0 741.0 869.0 903.0 909.0 919.0 816.0 SD 37.82 13.23 17.90 18.52 19.31 13.87 17.06 P-Con § Mean (g) 1089.0 748.0 887.0 905.0 888.0 886.0 740.0 SD 6.00 3.21 4.73 6.66 8.89 15.28 26.27 CBDT-L ∥ Mean (g) 1115.0 801.0 950.0 943.0 944.0 975.0 846.0 SD 55.14 33.81 35.44 44.07 24.79 24.76 20.42 CBDT-H ¶ Mean (g) 1083.0 781.0 921.0 949.0 936.0 976.0 817.0 SD 8.66 6.66 14.42 5.86 13.53 12.58 8.96
Normal†
: normal diet group, Control‡
: high-fat diet and no treatment group, P-Con§
(positive control) : high-fat diet and DietaminⓇ
treated group, CBDT-L∥
: high-fat diet and CBDT 250 mg/kg treated group, CBDT-H¶
: high-fat diet and CBDT 500 mg/kg treated group, Values are represented as mean±SD of 8 or 9 experiments.Table 4. The Changes of High-fat Feed Intake
Fig. 2. The changes of high fat feed intake.
Normal : normal diet group, Control : high-fat diet and no treatment group, P-Con (positive control) : high-fat diet and Dietamin
Ⓡ
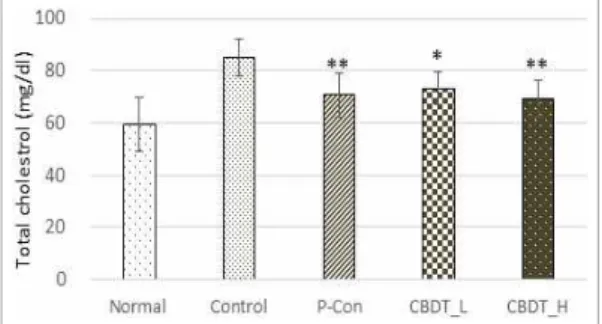
treated group, CBDT-L : high-fat diet and CBDT 250 mg/kg treated group, CBDT-H : high-fat diet and CBDT 500 mg/kg treated group, Values are represented as mean±SD of 8 or 9 experiments.4. 혈청 내 Total Cholesterol에 미치 는 영향
흰쥐의 Total cholesterol 함량을 측정한 결과, P-Con 군과 CBDT 투여군 모두 Control 군에 비해 감소하였으며, P-Con
군(p=0.008)과 CBDT-L 군(p=0.041),
CBDT-H 군(p=0.003) 모두 Control 군
에 비해 통계적으로 유의한 감소를 보였
다(Table 5, Fig. 3).
Characteristics Normal † Control ‡ P-Con § CBDT-L ∥ CBDT-H ¶ Total cholesterol
(mg/dl) Mean 59.3 85.0 70.6** 73.3* 69.3**
SD 10.36 6.99 8.42 6.27 6.92
Normal
†
: normal diet group, Control‡
: high-fat diet and no treatment group, P-Con§
(positive control) : high-fat diet and DietaminⓇ
treated group, CBDT-L∥
: high-fat diet and CBDT 250 mg/kg treated group, CBDT-H¶
: high-fat diet and CBDT 500 mg/kg treated group, Values are represented as mean±SD of 8 or 9 experiments.* : Statistically significant compared with control group (* ; p<0.05).
** : Statistically significant compared with control group (** ; p<0.01).
Table 5. The Change of Total Serum Cholesterol Level in Obese Rats
Fig. 3. The change of total serum cholesterol level in obese rats.
Normal : normal diet group, Control : high-fat diet and no treatment group, P-Con (positive control) : high-fat diet and Dietamin
Ⓡ
treated group, CBDT-L : high-fat diet and CBDT 250 mg/kg treated group, CBDT-H : high-fat diet and CBDT 500 mg/kg treated group,Values are represented as mean±SD of 8 or 9 experiments.
* : Statistically significant compared with control group (* ; p<0.05).
** : Statistically significant compared with control group (** ; p<0.01).
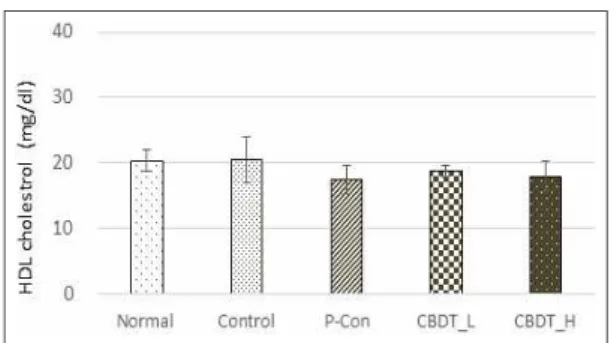
5. 혈청 내 HDL-Cholesterol에 미치는 영향
흰쥐의 HDL-cholesterol 함량을 측정 한 결과, Control 군에 비해서 P-Con 군 과 CBDT 투여군의 수치가 감소하는 경 향을 보였지만 통계적으로 유의하지는 않았다(Table 6, Fig. 4).
Characteristics Normal † Control ‡ P-Con § CBDT-L ∥ CBDT-H ¶ HDL-cholesterol
(mg/dl) Mean 20.4 20.6 17.6 18.8 18.0
SD 1.69 3.43 2.19 0.97 2.24
Normal
†
: normal diet group, Control‡
: high-fat diet and no treatment group, P-Con§
(positive control) : high-fat diet and DietaminⓇ
treated group, CBDT-L∥
: high-fat diet and CBDT 250 mg/kg treated group, CBDT-H¶
: high-fat diet and CBDT 500 mg/kg treated group, Values are represented as mean±SD of 8 or 9 experiments.Table 6. The Change of Serum HDL-cholesterol Level in Obese Rats
Fig. 4. The change of serum HDL-cholesterol level in obese rats.
Normal : normal diet group, Control : high-fat diet and no treatment group, P-Con (positive control) : high-fat diet and Dietamin
Ⓡ
treated group, CBDT-L : high-fat diet and CBDT 250 mg/kg treated group, CBDT-H : high-fatdiet and CBDT 500 mg/kg treated group, Values are represented as mean±SD of 8 or 9 experiments.
6. 혈청 내 LDL-Cholesterol에 미치는 영향
흰쥐의 LDL-cholesterol 함량을 측정 한 결과, P-Con 군과 CBDT 투여군 모 두 Control 군에 비해 감소하였으며, 그 중 CBDT-H(p=0.001) 군이 Control 군 에 비해 통계적으로 유의한 감소를 보였 다(Table 7, Fig. 5).
Characteristics Normal † Control ‡ P-Con § CBDT-L ∥ CBDT-H ¶ LDL-cholesterol
(mg/dl) Mean 6.4 11.6 10.4 9.8 8.6**
SD 1.19 1.77 1.41 0.89 1.19
Normal
†
: normal diet group, Control‡
: high-fat diet and no treatment group, P-Con§
(positive control) : high-fat diet and DietaminⓇ
treated group, CBDT-L∥
: high-fat diet and CBDT 250 mg/kg treated group, CBDT-H¶
: high-fat diet and CBDT 500 mg/kg treated group, Values are represented as mean±SD of 8 or 9 experiments.** : Statistically significant compared with control group (** ; p<0.01).
Table 7. The Change of Serum LDL-cholesterol Level in Obese Rats
Fig. 5. The change of serum LDL-cholesterol level in obese rats.
Normal : normal diet group, Control : high-fat diet and no treatment group, P-Con (positive control) : high-fat diet and Dietamin
Ⓡ
treated group, CBDT-L : high-fat diet and CBDT 250 mg/kg treated group, CBDT-H : high-fat diet and CBDT 500 mg/kg treated group,Values are represented as mean±SD of 8 or 9 experiments.
** : Statistically significant compared with control group (** ; p<0.01).
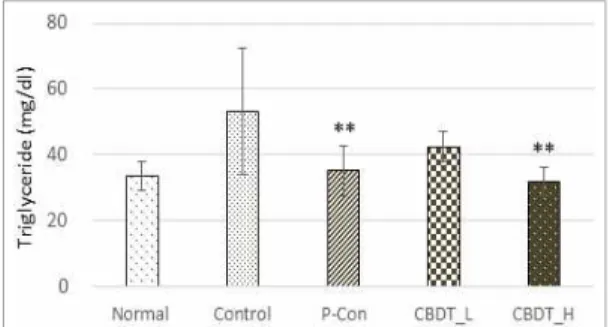
7. 혈청 내 중성지방에 미치는 영향
흰쥐 혈청의 Triglyceride(TG) 함량을
측정한 결과, P-Con 군과 CBDT 투여군
모두 Control 군에 비해 감소하였으며, 그
중 P-Con 군(p=0.006)과 CBDT-H 군
(p=0.002)에서 Control 군에 비해 통계
적으로 유의한 감소를 보였다(Table 8,
Fig. 6).
Characteristics Normal † Control ‡ P-Con § CBDT-L ∥ CBDT-H ¶ TG (mg/dl) Mean 33.5 53.1 35.2** 42.4 31.9**
SD 4.31 19.06 7.60 4.60 4.49
Normal
†
: normal diet group, Control‡
: high-fat diet and no treatment group, P-Con§
(positive control) : high-fat diet and DietaminⓇ
treated group, CBDT-L∥
: high-fat diet and CBDT 250 mg/kg treated group, CBDT-H¶
: high-fat diet and CBDT 500 mg/kg treated group, Values are represented as mean±SD of 8 or 9 experiments.** : Statistically significant compared with control group (** ; p<0.01).
Table 8. The Change of Serum Triglyceride Level in Obese Rats
Fig. 6. The change of serum Triglyceride level in obese rats.
Normal : normal diet group, Control : high-fat diet and no treatment group, P-Con (positive control) : high-fat diet and Dietamin
Ⓡ
treated group, CBDT-L : high-fat diet and CBDT 250 mg/kg treated group, CBDT-H : high-fat diet and CBDT 500 mg/kg treated group,Values are represented as mean±SD of 8 or 9 experiments.
** : Statistically significant compared with control group (** ; p<0.01).
8. 혈청 내 Free fatty acid에 미치는 영향
흰쥐의 혈청 내 free fatty acid 함량을 측정한 결과, P-Con 군과 CBDT 투여군 모두 Control 군에 비해 감소하였으며, P-Con 군(p=0.000)과 CBDT-H 군(p=0.000)에 서 Control 군에 비해 통계적으로 유의한 감소를 보였다(Table 9, Fig. 7).
Characteristics Normal † Control ‡ P-Con § CBDT-L ∥ CBDT-H ¶ Free fatty acid
(µM/ℓ) Mean 423.9 738.3 450.9** 675.0 490.4**
SD 100.72 101.60 78.08 49.43 101.63
Normal†
: normal diet group, Control‡
: high-fat diet and no treatment group, P-Con§
(positive control) : high-fat diet and DietaminⓇ
treated group, CBDT-L∥
: high-fat diet and CBDT 250 mg/kg treated group, CBDT-H¶
: high-fat diet and CBDT 500 mg/kg treated group, Values are represented as mean±SD of 8 or 9 experiments.** : Statistically significant compared with control group (** ; p<0.01).
Table 9. The Change of Serum Free Fatty Acid Level in Obese Rats
Fig. 7. The change of serum free fatty acid level in obese rats.
Normal : normal diet group, Control : high-fat diet and no treatment group, P-Con (positive control) : high-fat diet and Dietamin
Ⓡ
treated group, CBDT-L : high-fat diet and CBDT250 mg/kg treated group, CBDT-H : high-fat diet and CBDT 500 mg/kg treated group, Values are represented as mean±SD of 8 or 9 experiments.
** : Statistically significant compared with control group (** ; p<0.01).
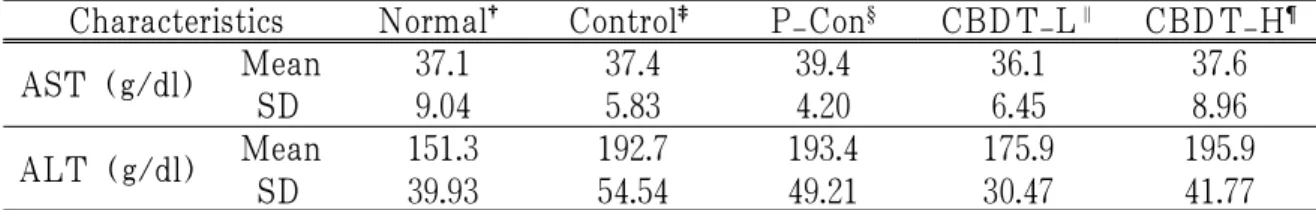
9. 혈청 내 AST, ALT에 미치는 영향 흰쥐의 혈청 내 AST, ALT를 측정한 결과, Normal 군을 포함한 모든 군에서 군 간의 유의한 차이가 없음을 관찰할 수 있었다(Table 10).
Characteristics Normal † Control ‡ P-Con § CBDT-L ∥ CBDT-H ¶ AST (g/dl) Mean 37.1 37.4 39.4 36.1 37.6
SD 9.04 5.83 4.20 6.45 8.96
ALT (g/dl) Mean 151.3 192.7 193.4 175.9 195.9 SD 39.93 54.54 49.21 30.47 41.77
Normal†
: normal diet group, Control‡
: high-fat diet and no treatment group, P-Con§
(positive control) : high-fat diet and DietaminⓇ
treated group, CBDT-L∥
: high-fat diet and CBDT 250 mg/kg treated group, CBDT-H¶
: high-fat diet and CBDT 500 mg/kg treated group, Values are represented as mean±SD of 8 or 9 experiments.Table 10. The Change of Serum AST & ALT Level in Obese Rats
10. CBC에 미치는 영향
흰쥐의 white blood cell(WBC), red blood cell(RBC), hemoglobin(Hb), platelet(PLT)
에 미치는 영향을 측정한 결과 Normal 군 을 포함한 모든 군에서 군 간의 유의한 차 이가 없음을 관찰할 수 있었다(Table 11).
Characteristics Normal † Control ‡ P-Con § CBDT-L ∥ CBDT-H ¶ WBC (×10 3 /μl) Mean 4.6 5.1 4.7 4.5 5.1
SD 1.85 1.59 1.55 0.83 1.23
RBC (×10 6 /μl) Mean 9.7 9.5 9.9 9.3 9.3
SD 0.44 0.28 0.41 0.49 0.50
Hb (g/dl) Mean 17.2 17.3 18.5 17.1 17.0
SD 0.81 0.89 0.62 0.68 0.64
PLT (×10 3 /μl) Mean 1101.7 1293.7 1150.2 1126.4 1140.6 SD 177.33 150.47 92.90 72.75 76.58
Normal†
: normal diet group, Control‡
: high-fat diet and no treatment group, P-Con§
(positive control) : high-fat diet and DietaminⓇ
treated group, CBDT-L∥
: high-fat diet and CBDT 250 mg/kg treated group, CBDT-H¶
: high-fat diet and CBDT 500 mg/kg treated group, Values are represented as mean±SD of 8 or 9 experiments.Table 11. The Change of CBC in Obese Rats
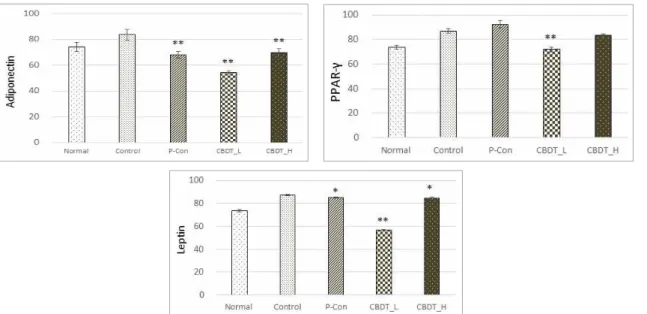
11. 흰쥐 간세포에서 adiponectin, PPAR-γ, leptin의 mRNA 발현에 미치는 영향
흰쥐의 간세포를 통해 CBDT투여가 지방세포 분화 과정에서 발현되는 인자인 adiponectin, PPAR-γ, leptin의 mRNA 발현에 미치는 영향을 RT-PCR을 이용
하여 관찰한 결과, adiponectin과 leptin에 서는 P-Con 군과 CBDT 투여군 모두에서 유의한 감소가 보였다. PPAR-γ에서는 Control 군에 비해 모두 감소하는 경향이 보였고, 그중 CBDT-L 투여군에서 통계적인 유의 성이 관찰되었다(Table 12, Fig. 8).
Characteristics Normal † Control ‡ P-Con § CBDT-L ∥ CBDT-H ¶ Adiponectin Mean 74.0 83.6 68.0* 54.4** 69.9**
SD 3.42 4.32 2.51 1.24 3.03
PPAR-γ Mean 73.6 86.9 92.2 71.7** 83.5
SD 1.87 2.01 3.12 1.96 0.99
Leptin Mean 73.6 87.2 85.0* 56.8* 84.6*
SD 0.98 0.69 0.45 0.22 1.12
Normal
†
: normal diet group, Control‡
: high-fat diet and no treatment group, P-Con§
(positive control) : high-fat diet and DietaminⓇ
treated group, CBDT-L∥
: high-fat diet and CBDT 250 mg/kg treated group, CBDT-H¶
: high-fat diet and CBDT 500 mg/kg treated group, Values are represented as mean±SD of 3 experiments.* : Statistically significant compared with control group (* ; p<0.05).
** : Statistically significant compared with control group (** ; p<0.01).
Table 12. The Effect of CBDT on the Degree of mRNA Expression of Adiponectin, PPAR-γ, Leptin in the Liver Cell
Fig. 8. The effect of CBDT on the degree of mRNA expression of adiponectin, PPAR-γ, leptin in the liver cell.
Top : Adiponectin, middle : PPAR-γ, Bottle : Leptin, Normal : normal diet group, Control : high-fat diet and no treatment group, P-Con (positive control) : high-fat diet and Dietamin
Ⓡ
treated group, CBDT-L : high-fat diet and CBDT 250 mg/kg treated group, CBDT-H : high-fat diet and CBDT 500 mg/kg treated group, Values are represented as mean±SD 3 experiments.* : Statistically significant compared with control group (* ; p<0.05).
** : Statistically significant compared with control group (** ; p<0.01).