© 2018 Korean Breast Cancer Society. All rights reserved. http://ejbc.kr | pISSN 1738-6756
INTRODUCTION
Breast cancer, a malignancy that originates from breast tis- sue, is the most common type of cancer in females [1]. It is es- timated that more than 10% of women will be affected by breast cancer during their lifetime [2,3]. Due to intrinsic resis- tance mechanisms, breast cancer is usually quite resistant to currently available antitumor drugs [4], and the development of drug resistance during long-term chemical treatment is a major cause of unsatisfactory treatment outcomes, and poor prognosis, in breast cancer patients [5,6]. In spite of the efforts that have been made to improve breast cancer treatment, the 5-year survival rate is 27%, if the cancer has spread to other body part [1]. At present, early diagnosis and treatment still
play key roles in improving the survival of patients with breast cancer.
Hypoxia-inducible factor 1α (HIF-1α) is a subunit of the heterodimeric transcription factor hypoxia-inducible factor 1, which plays pivotal roles in various pathological processes in- cluding the development of different types of human malig- nancies [7]. Because HIF-1α promotes the development of different types of tumors by promoting cancer cell survival and inhibiting cell apoptosis [8], it has become a target for the treatment of a variety of cancer types. The involvement of HIF-1α in breast cancer has been reported by several previous studies [9,10]. However, HIF-1α signaling transduction and the mechanism of its function have not been fully elucidated.
Therefore, our study aimed to investigate the involvement of HIF-1α in breast cancer and to explore the molecular mecha- nism of its action.
METHODS
Patients
A total of 102 patients with breast cancer were selected in
Hypoxia-Inducible Factor 1α Regulates the Transforming Growth Factor β1/
SMAD Family Member 3 Pathway to Promote Breast Cancer Progression
Jianheng Peng, Xiaolin Wang, Liang Ran, Junlong Song1, Rong Luo, Yonghong Wang
Department of Physical Examination, The First Affiliated Hospital of Chongqing Medical University, Chongqing; 1Department of Breast and Thyroid Surgery, Renmin Hospital of Wuhan University, Wuhan, China
ORIGINAL ARTICLE
Purpose: The transforming growth factor β1 (TGF-β1)/SMAD family member 3 (SMAD3) pathway, and hypoxia-inducible factor 1α (HIF-1α) are two key players in various types of malignancies including breast cancer. The TGF-β1/SMAD3 pathway can inter- act with HIF-1α in some diseases; however, their interaction in breast cancer is still unknown. Therefore, our study aimed to in- vestigate the interactions between the TGF-β1/SMAD3 pathway and HIF-1α in breast cancer. Methods: Expression of HIF-1α in serum of breast cancer patients and healthy controls was de- tected by quantitative reverse transcription polymerase chain re- action, and the diagnostic value of HIF-1α for breast cancer was evaluated by receiver operating characteristic curve analysis.
Breast cancer cell lines overexpressing SMAD3 and HIF-1α were established. Cell apoptosis and proliferation following different treatments were detected by 3-(4,5-dimethylthiazol-2-yl)-2,5-
diphenyltetrazolium bromide, and cell counting kit-8, respec- tively. Expression of related proteins was detected by western blot. Results: Serum levels of HIF-1α were higher in breast can- cer patients than in normal controls. Both SMAD3 and HIF-1α overexpression inhibited cell apoptosis and promoted cell pro- liferation. Treatment with inhibitors of HIF-1α and SMAD3 pro- moted apoptosis in breast cancer cells and inhibited their prolif- eration. Overexpression of HIF-1α promoted the expression of TGF-β1 and SMAD3, while SMAD3 overexpression did not sig- nificantly affect expression of HIF-1α or TGF-β1. Conclusion:
HIF-1α serves as an upstream regulator of the TGF-β1/SMAD3 pathway and promotes the growth of breast cancer.
Key Words: Breast neoplasms, Hypoxia-inducible factor 1, Smad3 protein, Transforming growth factor beta1
Correspondence to: Liang Ran
Department of Physical Examination, The First Affiliated Hospital of Chongqing Medical University, No.1 Youyi Road, Yuzhong District, Chongqing 400016, China
Tel: +86-23-89011001; Fax: +86-23-89011973 E-mail: [email protected]
Received: March 31, 2018 Accepted: June 28, 2018
Cancer
the First Affiliated Hospital of Chongqing Medical University from January 2011 to January 2012. Their ages ranged from 22 to 71 years with an average age of 46±6.7 years. All pa- tients were diagnosed by pathological and imaging examina- tions, and primary tumors were divided into four stages, namely T1, T2, T3, and T4. Diagnostic criteria were as fol- lows: greatest dimension of tumor ≤20 mm, T1; greatest di- mension of tumor >20 mm, ≤50 mm, T2; greatest dimen- sion of tumor >50 mm, T3; tumor of any size with direct in- vasion of the skin (ulceration or skin nodules) or chest wall, T4. There were 22 patients in T1, 28 in T2, 26 in T3, and 26 in T4. At the same time, 32 healthy females with similar age dis- tribution were enrolled to serve as the control group. The Ethics Committee of the First Affiliated Hospital of Chongqing Medical University approved this study (number: FAHCMU 101020), and all participants signed informed consent forms.
Cell lines and cell culture
Human breast cancer cell lines BT-483 and MCF-7 were purchased from ATCC (Manassas, USA). BT-483 cells were cultured with ATCC-formulated RPMI-1640 medium (cat.
no. 30-2001; ATCC) containing 0.01 mg/mL bovine insulin and 20% fetal bovine serum (FBS). MCF-7 cells were cultured in ATCC-formulated Eagle’s minimum essential medium (cat.
no. 30-2003; ATCC) containing 0.01 mg/mL human recombi- nant insulin and 10% FBS. Cells were cultured at 37°C and harvested during logarithmic growth phase for subsequent experiments.
Construction of SMAD family member 3- and HIF-1α- overexpressing cell lines
SMAD family member 3 (SMAD3) and HIF-1α expression vectors were constructed by inserting full-length SMAD3 (T1951; GeneCopoeia, Rockville, USA) and HIF-1α cDNA (T0096; GeneCopoeia) into pIRSE2-EGFP vector (Clontech, Palo Alto, USA). Cells were cultured overnight in Eagle’s min- imum essential medium (ATCC) containing 10% FBS (FBS was not added in case of chemical treatment) in an incubator (37°C, 5% CO2) to reach 80%–90% confluence. Empty vector without any insertion was used as a negative control. Lipo- fectamine 2000 reagent (cat. no. 11668-019; Thermo Fisher Scientific Inc., Waltham, USA) was used to transfect 10 nM vector into 4×10⁵ cells. After transfection, cells were cultured in RPMI-1640 medium (Hyclone; GE Healthcare Life Scienc- es, Logan, USA) at 37°C for 48 hours before subsequent ex- periments.
Preparation of serum samples
Fasting blood (15 mL) was extracted from both patients
and healthy controls in the morning on the day of admission.
Serum was separated from blood by keeping the blood at room temperature for 3 hours followed by centrifugation at 2,000 rpm for 20 minutes.
Cell proliferation assay
Cells were collected during logarithmic growth phase and cell suspension was made. Then, 100 μL of diluted cell suspen- sion containing 4×10⁴ cells was added to each well of a 96-well plate. Cells were cultured and 10 µL cell counting kit-8 (CCK-8) solution (Sigma-Aldrich, St. Louis, USA) was added to each well 24, 48, 72, and 96 hours later. Cells were then cultured at 37°C for another 4 hours. A FisherbrandTM accuSkanTM GO UV/Vis Microplate Spectrophotometer (Fisher Scientific Co., Pittsburgh, USA) was used to measure optical density (OD) values at 450 nm. All experiments were performed three times, and three wells were set for each treatment to calculate mean values.
MTT assay
Cells were collected during the logarithmic growth phase and cell suspension was prepared by diluting cells with culture medium containing 10 mM tetraethylammonium (Sigma- Aldrich) to make a final cell density of 5×10⁴ cells/mL. One hundred microliters of cell suspension (6×10³ cells) was then added to each well of a 96-well plate. Cells were cultured at 37°C for 6 hours, and 10 μL of 3-(4,5-dimethylthiazol-2-yl)-2,5- diphenyltetrazolium bromide (MTT) was then added to each well. Following that, cells were cultured for another 4 hours, OD values were measured at 570 nm using a FisherbrandTM accuSkanTM GO UV/Vis Microplate Spectrophotometer. Relative cell apoptosis rate was normalized to control cells.
Quantitative reverse transcription polymerase chain reaction Total RNA was extracted from serum and in vitro cultured cells using Trizol reagent (Thermo Fisher Scientific Inc.). A NanoDropTM 2000 Spectrophotometer (Thermo Fisher Scientific Inc.) was used to test RNA quality, and RNA samples with an A260/A280 ratio between 1.8 and 2.0 were used to synthesize cDNA through reverse transcription. Polymerase chain reaction (PCR) reactions were prepared using SYBR® Green Real-Time PCR Master Mixes (Thermo Fisher Scientific Inc.). The follow- ing primers were used: 5´-TTCACCTGAGCCTAATAGTCC-3´
(forward) and 5´-CAAGTCTAAATCTGTGTCCTG-3´ (re- verse) for HIF-1α; 5´-GCCTGTGCTGGAACATCATC-3´
(forward) and 5´-TTGCCCTCATGTGTGCTCTT-3´ (reverse) for SMAD3; 5´-GACCTCTATGCCAACACAGT-3´ (forward) and 5´-AGTACTTGCGCTCAGGAGGA-3´ (reverse) for β-actin. PCR reaction conditions were: 95°C for 1 minute, fol- lowed by 40 cycles of 95°C for 12 seconds and 62°C or 58°C
for 38 seconds. The 2−ΔΔCT method was used to process Ct values, and relative expression levels of HIF-1α and SMAD3 were normalized to endogenous control β-actin.
Western blot
Total protein was extracted from in vitro cultured cells using radioimmunoprecipitation assay buffer (RIPA) solution (Thermo Fisher Scientific Inc.), and protein samples were quantified by bicinchoninic acid assay. Following that, 12%
sodium dodecyl sulfate polyacrylamide gel electrophoresis was performed using 30 μg protein from each of the samples.
After transfer to polyvinylidene difluoride membrane (Thermo Fisher Scientific Inc.), blocking was performed by incubating membranes with 5% skimmed milk at room temperature for 1 hour. This was followed by incubation with primary anti- bodies, including rabbit anti-TGF-β1 (1:2,000, ab92486; Abcam, Cambridge, UK), anti-HIF-1α (1:2,000, ab51608; Abcam), anti-SMAD3 (1:2,000, ab40854; Abcam), and anti-glyceralde- hyde 3-phosphate dehydrogenase (GAPDH) (1:1,000, ab8245;
Abcam) overnight at 4°C. After washing with phosphate buff- ered saline (PBS) for 15 minutes, membranes were incubated with anti-rabbit immunoglobulin G-horseradish peroxidase secondary antibody (1:1,000, MBS435036; MyBioSource, San Diego, USA) at room temperature for 4 hours. Enhanced chemiluminescence (Sigma-Aldrich) was then added and sig- nal was detected using a MYECLTM Imager (Thermo Fisher Scientific Inc.). Relative expression level of each protein was normalized to endogenous control GAPDH using Image J software.
Mouse transplantation
A total of 24 BALB/c-nu mice (20±2 g) were provided by Guangdong Medical Laboratory Animal Center (Guangzhou, China). Mice were randomly divided into three groups with eight mice in each group. One hundred microliters of matrigel (Sigma-Aldrich)/PBS mixture containing 106 MCF-7 cells, HIF-1α-overexpressing MCF-7 cells, or MCF-7 cells trans- fected with empty vector were subcutaneously injected into the left intercostal space of each mouse. Tumor growth was monitored from day 7 until the end of the 6th week. Slide cali- pers were used to measure the long diameter (L) and short di- ameter (W) of tumors. Tumor volume (TV) was calculated every 7 days using the following formula: TV=L×W×0.5.
Mice were sacrificed 6 weeks after transplantation and tumor weight was measured.
Statistical analysis
Statistical analyses were conducted using SPSS version 19.0 (IBM Corp., Armonk, USA). The chi-square test was used to
process count data. Measurement data were expressed as mean±standard deviation, and Student t-test was used for comparisons between two groups. Analysis of variance and least significant difference tests were used to compare data among multiple groups. Statistical significance was inferred where p<0.05.
RESULTS
Expression of HIF-1α messenger RNA in serum of healthy controls and patients with different stages of breast cancer
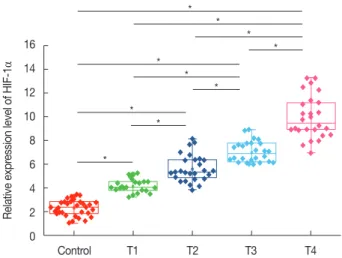
Expression of HIF-1α messenger RNA (mRNA) in serum of healthy controls and patients with different stages of breast cancer was detected by quantitative real-time PCR (qRT- PCR). As shown in Figure 1, expression level of HIF-1α mRNA in serum was upregulated in patients with different stages of breast cancer compared with that in healthy controls.
In addition, the expression level of HIF-1α mRNA significant- ly increased with increasing primary tumor stage (T1–T4).
These results suggest that upregulation of HIF-1α expression is very likely to be involved in the progression of breast cancer.
Potential of HIF-1α mRNA in the diagnosis and prognosis of breast cancer
Receiver operating characteristic (ROC) curve analysis showed that the area under the curve (AUC) of HIF-1α mRNA in distinguishing breast cancer patients from healthy controls was 0.9407, with a 95% confidence interval of 0.9041–0.9774 (p<0.0001) (Figure 2A). Based on the median serum level of HIF-1α mRNA, patients were divided into high and low HIF-1α mRNA expression groups. Survival curves
Figure 1. Expression of hypoxia-inducible factor 1α (HIF-1α) mRNA in serum of healthy controls and patients with different stages of breast cancer.
*p<0.05.
16 14 12 10 8 6 4 2 0
Control T1 T2 T3 T4
Relative expression level of HIF-1α
*
* *
* *
*
* *
* *
Figure 2. Potentials of hypoxia-inducible factor 1α (HIF-1α) mRNA in the diagnosis and prognosis of breast cancer. (A) Diagnostic values of serum HIF-1α mRNA for breast cancer was analyzed by receiver operating characteristic curve analysis. (B) Comparison of survival curves of patients with high and low serum level of HIF-1α mRNA was shown.
100
80
60
40
20
0
100
50
0
20 40 60 80 100 20 40 60
100%-Specificity% Months elapsed
Log-rank t-test p=0.0001
100% Sensitivity Overall survival
A B
Low expression High expression
Figure 3. Effects of hypoxia-inducible factor 1α (HIF-1α) and SMAD family member 3 (SMAD3) on cell proliferation and apoptosis of breast cancer cells. (A, B) Cell proliferation of different cell lines was influenced with different treatment. (C, D) Cell apoptosis of different cell lines was influenced with different treatment.
SIS3=SMAD3 inhibitor; C=control; NC=negative control; over=overexpression. *p<0.05.
120
100
80
60
40
20
0
120
100
80
60
40
20
0
120
100
80
60
40
20
0 120
100
80
60
40
20
0 20 40 60 80 100
Chrysin SIS3 C NC SMAD3 HIF-1α
over over Chrysin SIS3 C NC SMAD3 HIF-1α
over over
20 40 60 80 100
Hours Hours
BT-483
BT-483
MCF-7
MCF-7
Relative cell proliferationRelative cell apoptosis Relative cell apoptosisRelative cell proliferation
A
C D
B Chrysin
SIS3 C NC SMAD3 over HIF-1α over
Chrysin SIS3 C NC SMAD3 over HIF-1α over
* *
* *
*
*
*
*
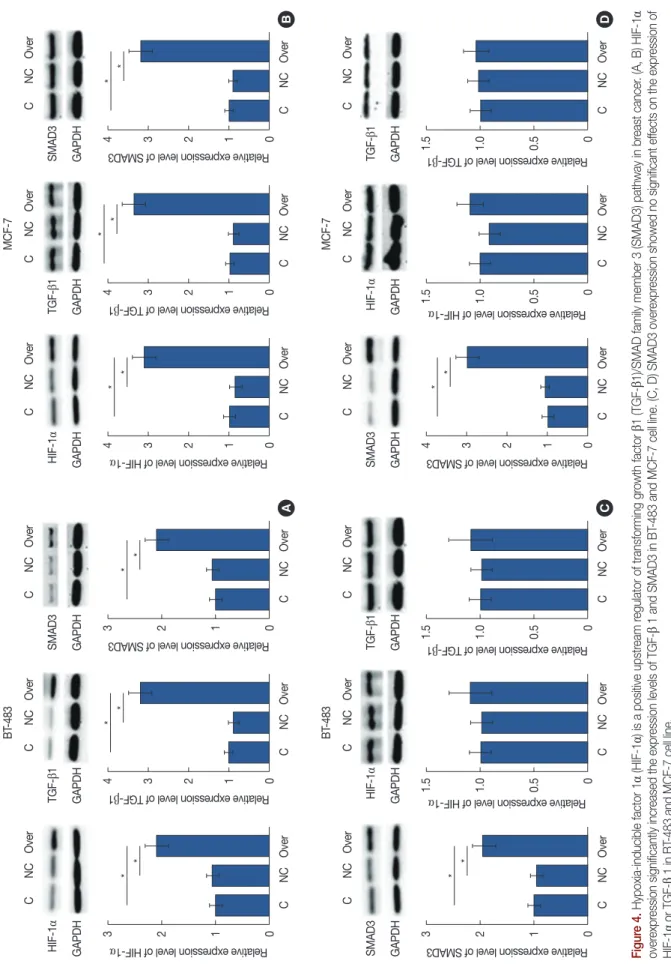
Figure 4. Hypoxia-inducible factor 1α (HIF-1α) is a positive upstream regulator of transforming growth factor β1 (TGF-β1)/SMAD family member 3 (SMAD3) pathway in breast cancer. (A, B) HIF-1α overexpression significantly increased the expression levels of TGF-β 1 and SMAD3 in BT-483 and MCF-7 cell line. (C, D) SMAD3 overexpression showed no significant effects on the expression of HIF-1α or TGF-β 1 in BT-483 and MCF-7 cell line. C=control; NC=negative control; over=overexpression; GAPDH=glyceraldehyde-3-phosphate dehydrogenase. *p<0.05.
3 2 1 0 3 2 1 0
4 3 2 1 0 4 3 2 1 0
4 3 2 1 0 1.5 1.0 0.5 0
4 3 2 1 0 1.5 1.0 0.5 0
3 2 1 0 1.5 1.0 0.5 0
4 3 2 1 0 1.5 1.0 0.5 0
CNCOver CNCOver
CNCOver CNCOver
CNCOver CNCOver
CNCOver CNCOver
CNCOver CNCOver
CNCOver CNCOver
CNCOver CNCOver
CNCOver CNCOver
CNCOver CNCOver
CNCOver CNCOver
CNCOver CNCOver
CNCOver CNCOver
BT-483 BT-483
MCF-7 MCF-7
Relative expression level of HIF-1
α AD3 f SM el o lev sion res e exp ativ Rel
Relative expression level of HIF-1
α AD3 f SM el o lev sion res e exp ativ Rel
Relative expression level of TGF-
β1 α Relative expression level of HIF-1
Relative expression level of TGF-
β1 α Relative expression level of HIF-1
Rel ativ e exp res sion lev el of SM
AD3 β1 Relative expression level of TGF-
Rel ativ e exp res sion lev el of SM
AD3 β1 Relative expression level of TGF-
A C
B D
* *
* *
** *** *
* *
** **
HIF-1α SMAD3
HIF-1α SMAD3
TGF-β1 HIF-1α
TGF-β1 HIF-1α
SMAD3 TGF-β1
SMAD3 TGF-β1
GAPDH GAPDH
GAPDH GAPDH
GAPDH GAPDH
GAPDH GAPDH
GAPDH GAPDH
GAPDH GAPDH
were plotted using the Kaplan-Meier method based on data collected during 5-years’ follow-up, which was analyzed by log-rank t-test. As shown in Figure 2B, overall survival rate of patients with a high expression level of HIF-1α mRNA in se- rum was significantly lower than that of patients with lower serum level of HIF-1α mRNA. These data suggest that HIF-1α mRNA expression level may provide a biomarker for the di- agnosis and prognosis of breast cancer.
Effects of HIF-1α and SMAD3 on cell proliferation and apoptosis of breast cancer cells
Overexpression of HIF-1α and SMAD3 in cell lines was validated by qRT-PCR (data not shown). Overexpression of HIF-1α and SMAD3 promoted cell proliferation in two breast cancer cell lines (Figure 3A and 3B), and the HIF-1α inhibitor chrysin (5 µM; Santa Cruz Biotechnology, Dallas, USA) also promoted cell proliferation. Treatment with the SMAD3 in- hibitor (SIS3) (6 µM; Santa Cruz Biotechnology) reduced cell proliferation. In addition, HIF-1α and SMAD3 overexpres- sion significantly inhibited cell apoptosis in two breast cancer cell lines (p<0.05) (Figure 3C and 3D). Apoptosis was also significantly promoted by the HIF-1α inhibitor chrysin and by SIS3 treatment (p<0.05) (Figure 3C and 3D).
HIF-1α is a positive upstream regulator of the TGF-β1/SMAD3 pathway in breast cancer
As shown in Figure 4A and 4B, HIF-1α overexpression sig- nificantly increased the expression levels of TGF-β1 and SMAD3 in two breast cancer cell lines (p<0.05). However, SMAD3 overexpression showed no significant effects on the
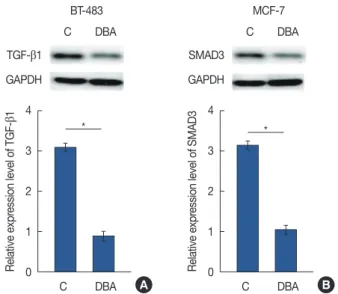
expression of HIF-1α or TGF-β1 in these two cell lines (p<0.05) (Figure 4C and 4D). Dimethyl-bisphenol A (DBA) is an HIF inhibitor that promotes HIF-1α degradation. In our study, DBA (0.05 mM, sc-205650; Santa Cruz Biotechnology) significantly reduced the accumulation levels of HIF-1α in two cell lines (data not shown). In addition, DBA treatment significantly decreased the expression levels of TGF-β1 and SMAD3 in two cell lines (p<0.05) (Figure 5). These data sug- gest that HIF-1α is a positive upstream regulator of the
Figure 5. Effects of hypoxia-inducible factor inhibitor dimethyl-bisphenol A (DBA) on transforming growth factor β1 (TGF-β1) (A) and SMAD family member 3 (SMAD3) (B) expression.
C =control; GAPDH =glyceraldehyde-3-phosphate dehydrogenase.
*p<0.05.
4
3
2
1
0
4
3
2
1
0
C DBA C DBA
C DBA C DBA
BT-483 MCF-7
Relative expression level of TGF-β1 Relative expression level of SMAD3* *
TGF-β1 SMAD3
GAPDH GAPDH
B A
Figure 6. Overexpression of hypoxia-inducible factor 1α (HIF-1α) and the growth of transplanted tumor in mice. (A) Representative tumors collected at 6 week after injection was shown. (B) Tumors were derived from MCF-7 cells (control), MCF-7 cells transfected with empty vector (negative control), and HIF-1α-overexpressing MCF-7 cell lines (overexpression), and the tumor growth rate was recorded and compared. (C) Comparison of tumor weight at week 6 between tumors derived from MCF-7 cells (control), MCF-7 cells transfected with empty vector (negative control), and HIF-1α- overexpressing MCF-7 cell line (overexpression).
C=control; NC=negative control; over=overexpression. *p<0.05.
3,500 3,000 2,500 2,000 1,500 1,000 500 0
3.5 3.0 2.5 2.0 1.5 1.0 0.5 7 14 21 28 35 42 0
Days
C NC Over
Average tumor volume (mm3) Average tumor weight (g)
*
*
C B
A
C NC Over
TGF-β1/SMAD3 pathway in breast cancer.
HIF-1α overexpression promoted growth of transplanted tumors in mice
Figure 6A shows representative tumors collected 6 weeks after the injection. Tumor volume was recorded every week from week 1 to week 6. As shown in Figure 5B, the growth of tumors derived from HIF-1α-overexpressing MCF-7 breast cancer cell lines was faster than that of tumors that derived from MCF-7 cells or MCF-7 cells transfected with empty vec- tor (Figure 6B). In addition, weight of tumors derived from the HIF-1α-overexpressing MCF-7 breast cancer cell line was also significantly higher than that of tumors derived from MCF-7 cells or MCF-7 cells with empty vector transfection (Figure 6C). These data suggest that HIF-1α overexpression may promote breast tumor growth in vivo.
DISCUSSION
Previous work has shown that HIF-1 can regulate genes in- volved in a wide range of biological processes including cell survival, glucose metabolism, angiogenesis, and cell invasion, and these are all important for both the growth and the devel- opment of cancers [7]. Expression of HIF-1α, which is a sub- unit of HIF-1, is upregulated by intratumoral hypoxia and ge- netic alterations. Overexpression of HIF-1α therefore occurs during the onset, development, and progression of human malignancies [7]. In a recent study, Wang et al. [11] reported that HIF-1α is highly expressed in patients with breast cancer compared with that in healthy controls, and they showed sig- nificant correlations between HIF-1α expression and features of aggressive tumors. High expression of HIF-1α has also been seen during the development of prostate cancer, in which it is involved in regulating cancer cell invasion [12]. Other relevant work on elevated HIF-1α expression in cancer includes a study linking it with the development and progression of breast cancer in Africa [13]. Furthermore, inhibition of HIF- 1α shows promise as an anticancer strategy, for example tan- shinone IIA, an active ingredient of Salvia miltiorrhiza bunge, has been proved to achieve anticancer activity through inhibi- tion of HIF-1α expression [14]. In our study, HIF-1α was found to be significantly upregulated in patients with different stages of breast cancer compared with that in healthy controls.
In addition, the expression level of HIF-1α mRNA signifi- cantly increased with increasing primary tumor stage. These data provide an advance on previous work by demonstrating a correlation between HIF-1α expression level and disease progression in patients with breast cancer, since previous studies have not included tumor staging [11,12]. Our study
therefore provides substantial support to the hypothesis that upregulation of HIF-1α expression is involved in the patho- genesis of breast cancer.
At present, the key to survival for patients with breast can- cer is early diagnosis and treatment, which require highly sen- sitive and accurate biomarkers. Level of HIF-1α mRNA has been used previously in the diagnosis of certain types of ma- lignancies including prostate cancer [15], and has achieved satisfactory diagnostic specificity as well as sensitivity. In addi- tion, overexpression of HIF-1α has long been considered a marker of unfavorable prognosis in different types of malig- nant tumors including early-stage invasive cervical cancer [16]. In our study, ROC curve analysis showed that serum HIF-1α mRNA level can be used to accurately and effectively distinguish breast cancer patients from normal healthy con- trols. In addition, overall survival rate of patients with high expression levels of HIF-1α mRNA in serum was significantly lower than that of patients with lower serum level of HIF-1α mRNA. These data suggest that measurement of HIF-1α mRNA expression levels in serum may provide a reference for the diagnosis and prognosis of breast cancer. However, it is worth noting that overexpression of HIF-1α is observed in various other of human diseases, including lung cancer [17], and liver cancer [18], so, multiple biomarkers are required for diagnostic specificity.
Understanding the mechanism of HIF-1α activity remains incomplete. It can affect multiple pathways, including glucose metabolism, to promote tumor growth and inhibit apoptosis [19]. In our study, HIF-1α overexpression promoted cell pro- liferation and inhibited apoptosis in two breast cancer cells lines, while HIF-1α inhibitors produced the opposite effects.
We also showed that HIF-1α overexpression promoted the growth of transplanted tumors in nude mice. Involvement of the TGF-β/SMAD3 axis in the regulation of proliferation and apoptosis in breast cancer cells has been demonstrated previ- ously [20]. In this study, SMAD3 overexpression showed simi- lar effects on breast cancer cell proliferation and apoptosis to those of HIF-1α overexpression. It has been reported that HIF-1α activates the participation of the TGF-β/SMAD3 pathway in certain physiological processes [21]. In the present study, HIF-1α overexpression significantly increased the ex- pression levels of TGF-β1 and SMAD3 in breast cancer cells, while SMAD3 overexpression showed no significant effects on the expression of HIF-1α or TGF-β1. These data suggest that HIF-1α is a positive upstream regulator of the TGF-β1/
SMAD3 pathway in breast cancer.
In conclusion, increased serum levels of HIF-1α effectively distinguish breast cancer patients from healthy controls. HIF- 1α may serve as an upstream regulator of the TGF-β1/
SMAD3 pathway to promote the growth of breast cancer.
CONFLICT OF INTEREST
The authors declare that they have no competing interests.
REFERENCES
1. DeSantis CE, Ma J, Goding Sauer A, Newman LA, Jemal A. Breast cancer statistics, 2017, racial disparity in mortality by state. CA Cancer J Clin 2017;67:439-48.
2. Ward EM, DeSantis CE, Lin CC, Kramer JL, Jemal A, Kohler B, et al.
Cancer statistics: breast cancer in situ. CA Cancer J Clin 2015;65:481- 95.
3. Daly B, Olopade OI. A perfect storm: how tumor biology, genomics, and health care delivery patterns collide to create a racial survival disparity in breast cancer and proposed interventions for change. CA Cancer J Clin 2015;65:221-38.
4. Carroll JS, Hickey TE, Tarulli GA, Williams M, Tilley WD. Deciphering the divergent roles of progestogens in breast cancer. Nat Rev Cancer 2017;17:54-64.
5. O’Driscoll L, Clynes M. Biomarkers and multiple drug resistance in breast cancer. Curr Cancer Drug Targets 2006;6:365-84.
6. Ellis LM, Hicklin DJ. Resistance to targeted therapies: refining antican- cer therapy in the era of molecular oncology. Clin Cancer Res 2009;15:
7471-8.
7. Semenza GL. Targeting HIF-1 for cancer therapy. Nat Rev Cancer 2003;3:721-32.
8. Bensaad K, Favaro E, Lewis CA, Peck B, Lord S, Collins JM, et al. Fatty acid uptake and lipid storage induced by HIF-1alpha contribute to cell growth and survival after hypoxia-reoxygenation. Cell Rep 2014;9:349- 65.
9. Blancher C, Moore JW, Talks KL, Houlbrook S, Harris AL. Relationship of hypoxia-inducible factor (HIF)-1alpha and HIF-2alpha expression to vascular endothelial growth factor induction and hypoxia survival in human breast cancer cell lines. Cancer Res 2000;60:7106-13.
10. Xiang L, Gilkes DM, Hu H, Luo W, Bullen JW, Liang H, et al. HIF-1al- pha and TAZ serve as reciprocal co-activators in human breast cancer
cells. Oncotarget 2015;6:11768-78.
11. Wang J, Ni Z, Duan Z, Wang G, Li F. Altered expression of hypoxia-in- ducible factor-1alpha (HIF-1alpha) and its regulatory genes in gastric cancer tissues. PLoS One 2014;9:e99835.
12. Cho KH, Choi MJ, Jeong KJ, Kim JJ, Hwang MH, Shin SC, et al. A ROS/
STAT3/HIF-1 alpha signaling cascade mediates EGF-induced TWIST1 expression and prostate cancer cell invasion. Prostate 2014;74:528-36.
13. Nalwoga H, Ahmed L, Arnes JB, Wabinga H, Akslen LA. Strong ex- pression of hypoxia-inducible factor-1alpha (HIF-1alpha) is associated with axl expression and features of aggressive tumors in African breast cancer. PLoS One 2016;11:e0146823.
14. Li G, Shan C, Liu L, Zhou T, Zhou J, Hu X, et al. Tanshinone IIA inhibits HIF-1alpha and VEGF expression in breast cancer cells via mTOR/
p70S6K/RPS6/4E-BP1 signaling pathway. PLoS One 2015;10:
e0117440.
15. Pipinikas CP, Carter ND, Corbishley CM, Fenske CD. HIF-1alpha mRNA gene expression levels in improved diagnosis of early stages of prostate cancer. Biomarkers 2008;13:680-91.
16. Birner P, Schindl M, Obermair A, Plank C, Breitenecker G, Oberhuber G. Overexpression of hypoxia-inducible factor 1alpha is a marker for an unfavorable prognosis in early-stage invasive cervical cancer. Cancer Res 2000;60:4693-6.
17. Kim SJ, Rabbani ZN, Dewhirst MW, Vujaskovic Z, Vollmer RT, Schreiber EG, et al. Expression of HIF-1alpha, CA IX, VEGF, and MMP-9 in surgically resected non-small cell lung cancer. Lung Cancer 2005;49:325-35.
18. Jia ZZ, Jiang GM, Feng YL. Serum HIF-1alpha and VEGF levels pre- and post-TACE in patients with primary liver cancer. Chin Med Sci J 2011;26:158-62.
19. He G, Jiang Y, Zhang B, Wu G. The effect of HIF-1alpha on glucose metabolism, growth and apoptosis of pancreatic cancerous cells. Asia Pac J Clin Nutr 2014;23:174-80.
20. Chen HS, Bai MH, Zhang T, Li GD, Liu M. Ellagic acid induces cell cycle arrest and apoptosis through TGF-beta/Smad3 signaling pathway in human breast cancer MCF-7 cells. Int J Oncol 2015;46:1730-8.
21. Kushida N, Nomura S, Mimura I, Fujita T, Yamamoto S, Nangaku M, et al. Hypoxia-inducible factor-1alpha activates the transforming growth factor-beta/smad3 pathway in kidney tubular epithelial cells. Am J Nephrol 2016;44:276-85.