ABSTRACT
Purpose: Guidelines in Western countries recommend retrieving ≥15 lymph nodes (LNs) during gastric cancer resection. This study sought to determine whether the number of examined lymph nodes (eLNs), a proxy for lymphadenectomy, effects survival in node- negative disease.
Materials and Methods: The US National Cancer Database (2003–2011) was reviewed for node-negative gastric adenocarcinoma. Treatment was categorized by neoadjuvant therapy (NAT) vs. initial resection, and further stratified by eLN. Kaplan-Meier and Weibull models were used to analyze overall survival.
Results: Of the 1,036 patients who received NAT, 40.5% had ≤10 eLN, and most underwent proximal gastrectomy (67.8%). In multivariate analysis, greater eLN was associated with improved survival (eLN 16–20: HR, 0.71; P=0.039, eLN 21–30: HR, 0.55; P=0.001). Of the 2,795 patients who underwent initial surgery, 42.5% had ≤10 eLN, and the majority underwent proximal gastrectomy (57.2%). In multivariate analysis, greater eLN was associated with improved survival (eLN 11–15: HR, 0.81; P=0.021, eLN 16–20: HR, 0.73;
P=0.004, eLN 21–30: HR, 0.62; P<0.001, and eLN >30: HR, 0.58; P<0.001).
Conclusions: In the United States, the majority of node-negative gastrectomies include suboptimal eLN. In node-negative gastric cancer, greater LN retrieval appears to have therapeutic and prognostic value, irrespective of initial treatment, suggesting a survival benefit to meticulous lymphadenectomy.
Keywords: Stomach neoplasms; Lymph node excision; Gastric cancer; Survival
INTRODUCTION
In the United States, gastric cancer is a devastating disease, with a 5-year overall survival of only 30.6% [1]. Surgical resection with adequate oncologic margins and removal of regional lymph nodes (LNs) offers the best hope for long-term survival. LN status is an important prognostic indicator in gastric cancer, with positive LNs suggesting a poor prognosis [2,3].
However, patients with node-negative disease still have a 17% chance of disease recurrence, and a 5-year overall survival of only 53% [4].
Original Article
Received: Jul 19, 2017 Revised: Sep 25, 2017 Accepted: Nov 11, 2017 Correspondence to Joyce Wong
Department of Surgery, The Pennsylvania State University, College of Medicine, 500 University Drive, MC H070, Hershey, PA 17033, USA.
E-mail: [email protected] Copyright © 2017. Korean Gastric Cancer Association
This is an Open Access article distributed under the terms of the Creative Commons Attribution Non-Commercial License (https://
creativecommons.org/licenses/by-nc/4.0) which permits unrestricted noncommercial use, distribution, and reproduction in any medium, provided the original work is properly cited.
ORCID iDs Katelin A. Mirkin
https://orcid.org/0000-0002-0697-2316 Christopher S. Hollenbeak
https://orcid.org/0000-0002-3362-814X Joyce Wong
https://orcid.org/0000-0003-0806-3551 Author Contributions
Conceptualization: W.J.; Data curation: H.S.C.;
Formal analysis: M.K.A.; Investigation: W.J., H.C.S., M.K.A.; Methodology: W.J., H.C.S., M.K.A.; Project administration: W.J., H.C.S.;
Resources: W.J., H.C.S.; Software: H.C.S.;
Supervision: W.J., H.C.S.; Validation: H.D.S.;
Visualization: W.J., H.C.S., M.K.A.; Writing - original draft: M.K.A.; Writing - review &
editing: W.J., H.C.S.
Katelin A. Mirkin 1, Christopher S. Hollenbeak 1,2, Joyce Wong 1
1Department of Surgery, The Pennsylvania State University, College of Medicine, Hershey, PA, USA
2 Department of Public Health Sciences, The Pennsylvania State University, College of Medicine, Hershey, PA, USA
Greater Lymph Node Retrieval
Improves Survival in Node-Negative
Resected Gastric Cancer in the United
States
Conflict of Interest
The National Cancer Data Base (NCDB) is a joint project of the Commission on Cancer (CoC) of the American College of Surgeons and the American Cancer Society. The CoC's NCDB and the hospitals participating in the CoC's NCDB are the source of the de-identified data used herein; they have not verified and are not responsible for the statistical validity of the data analysis or the conclusions derived by the authors.
This study was selected and presented as a poster presentation at the Society for Surgery of the Alimentary Tract's Annual Meeting at Digestive Disease Week in Chicago, IL, May 6–9, 2017.
Extent of lymphadenectomy remains a controversial topic in surgical management of gastric cancer. In Japan, extended lymphadenectomy, referring to a D2 LN dissection, is standard of care [5]. However, initial data from randomized controlled trials in British and Dutch populations failed to find a significant survival benefit for D2 dissections over D1 dissections [6,7]. Long-term follow-up in the Dutch study found improved disease specific survival with D2 dissections [8]. In the United States, the National Comprehensive Cancer Network (NCCN) guidelines currently recommend gastrectomy with D1 or modified D2 LN dissection, with preservation of the distal pancreas and spleen; the surgeon should examine at least LNs [9]. Recent evidence from Asian populations demonstrates a survival benefit to increasing the number of examined lymph nodes (eLNs), even in node-negative disease [10-13]. However, this has not been explored in African, European, or North and South American populations. Given differences in gastric cancer between Asian and other populations, the results of these studies are not necessarily applicable to African, European, or North and South American populations. This study sought to determine whether number of eLN, a proxy for lymphadenectomy, effects survival in US patients with node-negative gastric cancer.
MATERIALS AND METHODS
Data
This was a retrospective cohort study using data from the National Cancer Data Base (NCDB).
This clinical oncology database, jointly sponsored by the American College of Surgeons and the American Cancer Society, is sourced from hospital registry data collected from over 1,500 Commission on Cancer (CoC) accredited facilities. The NCDB captures over 70% of newly diagnosed cancer cases in the United States. The NCDB contains readily available de-identified data, and therefore this study was not subject to institutional review board approval or oversight.
Patient selection
The NCDB (2003–2011) was reviewed for patients diagnosed with clinical stages I–III gastric cancer, who underwent surgical resection, with or without systemic therapy. Patients with clinical stage IV disease or unknown stage were excluded. Clinical stage is coded in the NCDB according to standard practice at each individual institution. Patients who did not undergo surgical resection were excluded. Patients were categorized by receipt of neoadjuvant therapy (NAT) vs. initial resection, and further stratified by number of eLN: ≤10, 11–15, 16–20, 21–30, and >30.
Outcomes and covariates
The primary variable assessed was overall survival. Analyses controlled for patient and disease characteristics including age, sex, race, insurance type (private, Medicare, Medicaid and other government programs, unknown, and not insured), and the Charlson/Deyo comorbidity index (CCI), an index of 15 comorbidities (myocardial infarction, congestive heart failure, peripheral vascular disease, cerebrovascular disease, dementia, chronic pulmonary disease, rheumatologic disease, peptic ulcer disease, mild liver disease, diabetes, diabetes with chronic complications, hemiplegia or paraplegia, renal disease, moderate or severe liver disease, and acquired immunodeficiency syndrome) [14,15]. Median income of the patient's zip code was used as a proxy for socioeconomic status. Treatment facilities were characterized by type (community, comprehensive community, academic or research
institution, other) and US geographic region (northeast, south, mid-west, west). Disease was characterized by the American Joint Committee on Cancer (AJCC) clinical stage, surgery type (proximal gastrectomy, total gastrectomy, distal gastrectomy, and surgery not otherwise specified), number of regional LNs removed, number of positive regional LNs, surgical margins (no residual tumor, residual tumor not otherwise specified, microscopic residual tumor, macroscopic residual tumor, and indeterminate and unknown margins), pathologic stage, and adjuvant therapy. The main covariate of interest was eLN, which was subdivided into 5 groups: ≤10, 11–15, 16–20, 21–30, and >30 LNs.
Statistical analysis
Statistical analyses were performed with Stata software (version 12.1; StataCorp., College Station, TX, USA). Patient, disease, and facility characteristics were compared within each cohort with analysis of variance for continuous variables and χ2 tests for categorical variables.
Kaplan-Meier analyses were performed for each clinical stage and treatment, and stratified by eLN. The proportional hazards assumption was violated, and thus multivariable survival analyses were performed for each initial treatment using a Weibull model, controlling for covariates described above.
RESULTS
From 2003 to 2011, the median number of eLN in node negative resected gastric cancer has steadily risen from 8 to 14 (Fig. 1).
Patient characteristics of NAT cohort
Of the 1,036 (27%) who received NAT, 40.5% (n=420) had ≤10, 21.8% (n=226) had 11–15, 16.8% (n=174) had 16–20, 13.4% (n=139) had 21–30, and 7.4% (n=77) had >30 eLN (Fig. 2).
Of those who received NAT, 58.0% underwent a suboptimal lymphadenectomy as defined according to NCCN guidelines (<15 eLN).
Time (yr)
10
8
2002 2006 2010 2012
Median eLN
12 14
2004 2008
Fig. 1. Trends in median number of LN examined from 2003 to 2011.
LN = lymph node; eLN = examined lymph node.
Patient, disease, and treatment characteristics of patients who received NAT, stratified by eLN, are presented in Table 1. Patients who received a suboptimal lymphadenectomy (eLN ≤10) tended to be male (P<0.001), were more likely to be treated at a comprehensive community center (P<0.001), and were more likely to undergo a proximal gastrectomy (P<0.001). Age (P=0.915),
eLN
100 200 400 600
0
11–15 21–30 >30
Patients 300
700
<10 16–20
500
Fig. 2. Distribution of eLNs in NAT cohort.
eLN = examined lymph node; NAT = neoadjuvant therapy.
Table 1. Patient, disease, and treatment characteristics of NAT cohort
Variable ≤10 (n=420, %) 11–15 (n=226, %) 16–20 (n=174, %) 21–30 (n=139, %) >30 (n=77, %) P-value
Age 61.5 61.4 60.9 62.0 61.0 0.915
18–59 41.2 39.4 38.5 38.8 45.5
60–69 35.7 39.4 42.5 34.5 27.3
70–79 20.7 19.5 18.4 23.7 24.7
80–90 2.4 1.8 0.6 2.9 2.6
Sex <0.001
Male 82.1 85.8 83.3 68.3 68.8
Female 17.9 14.2 16.7 31.7 31.2
Race 0.395
White (non-Hispanic) 84.8 86.7 85.6 81.3 75.3
Black (non-Hispanic) 4.0 3.5 2.9 7.9 6.5
Other (non-Hispanic) 2.1 2.2 1.1 2.9 3.9
Hispanic 9.0 7.5 10.3 7.9 14.3
Insurance 0.260
Private 52.6 52.7 58.0 54.0 50.6
Medicare 38.3 38.9 33.9 38.1 35.1
Medicaid & other government 6.9 4.9 6.3 5.0 9.1
Unknown 0.5 1.8 1.7 2.2 0.0
Not insured 1.7 1.8 0.0 0.7 5.2
Median income 0.561
<58,000 12.1 8.8 12.1 11.5 15.6
58,000–74,000 21.4 25.7 27.6 20.9 19.5
74,000–93,000 26.7 28.8 27.0 29.5 19.5
>93,000 36.7 34.5 31.0 34.5 42.9
Comorbidities 0.785
CCI score 0 73.3 75.7 76.4 75.5 79.2
CCI score 1 22.1 20.4 21.8 20.9 19.5
CCI score 2 4.5 4.0 1.7 3.6 1.3
race (P=0.395), comorbidities (P=0.785), surgical margins (P=0.225), and clinical and pathological stages (P=0.901 and P=0.124, respectively) did not significantly differ among eLN groups.
Survival of NAT Cohort
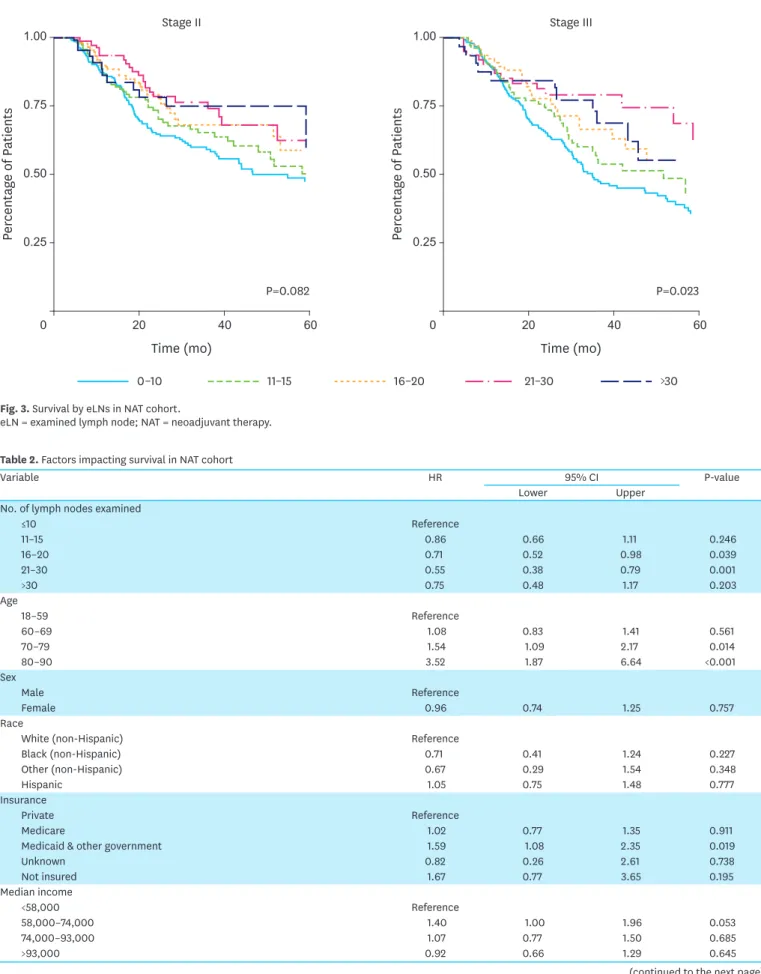
Kaplan-Meier analyses of patients who received NAT are stratified by eLN and presented in Fig. 3.
Inadequate lymphadenectomy (eLN ≤10) was associated with worse survival in clinical stage II and III disease; however, this association was only significant in stage III disease (P=0.020).
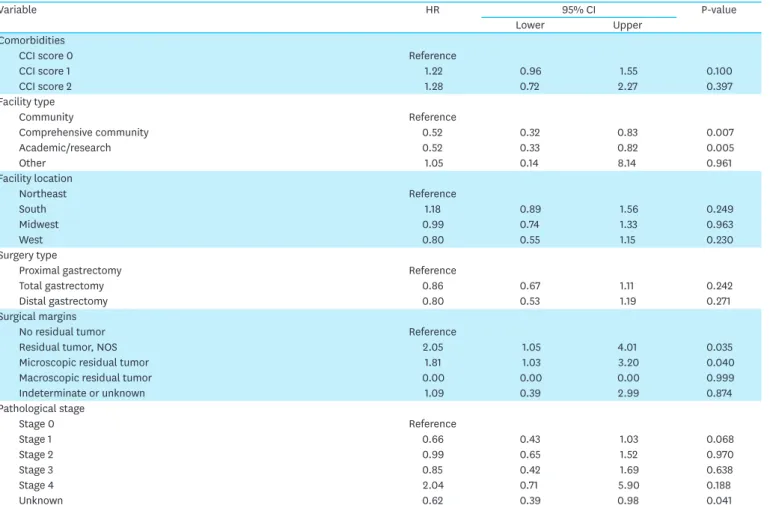
Results of a Weibull survival model of patients who received NAT are presented in Table 2.
A greater number of eLN was associated with improved hazards of mortality (eLN 16–20:
HR, 0.71; P=0.039, eLN 21–30: HR, 0.55; P=0.001). Treatment at an academic center was also associated with a reduction in mortality (HR, 0.52, P=0.005). Greater age (80–90: HR, 3.52; P<0.001) and coverage by Medicaid (HR, 1.59, P=0.019) were associated with increased hazards of mortality.
Patient characteristics of initial surgery cohort
Of the 2,795 patients who underwent initial surgery, 42.5% (n=1,187) had ≤10, 19.8% (n=553) had 11–15, 14.5% (n=404) had 16–20, 15.5% (n=432) had 21–30, and 7.8% (n=219) had >30 eLN (Fig. 4). Of those who underwent initial surgery, 58.6% underwent a suboptimal lymphadenectomy (<15 eLN).
Variable ≤10 (n=420, %) 11–15 (n=226, %) 16–20 (n=174, %) 21–30 (n=139, %) >30 (n=77, %) P-value
Facility type <0.001
Community 3.1 5.8 3.4 2.9 1.3
Comprehensive community 42.4 32.3 26.4 22.3 31.2
Academic/research 54.0 61.9 70.1 74.8 67.5
Other 0.5 0.0 0.0 0.0 0.0
Facility location 0.033
Northeast 18.8 22.1 25.9 30.2 29.9
South 36.9 35.4 32.2 27.3 33.8
Midwest 33.1 28.3 27.0 30.2 16.9
West 11.2 14.2 14.9 12.2 19.5
Clinical stage 0.901
Stage II 51.4 52.2 52.9 55.4 57.1
Stage III 48.3 47.8 46.6 44.6 42.9
Surgery type <0.001
Proximal gastrectomy 74.0 69.9 67.8 54.7 50.6
Total gastrectomy 19.0 23.0 24.7 40.3 40.3
Distal gastrectomy 6.9 7.1 7.5 5.0 9.1
Regional lymph nodes examined 6.2 13.0 17.7 24.5 39.0 <0.001
Surgical margins 0.225
No residual tumor 96.0 95.6 94.3 95.0 96.1
Residual tumor, NOS 1.2 1.3 1.1 2.9 0.0
Microscopic residual tumor 2.1 2.2 2.3 1.4 1.3
Macroscopic residual tumor 0.0 0.0 0.0 0.0 1.3
Indeterminate or unknown 0.7 0.9 2.3 0.7 1.3
Pathological stage 0.124
Stage 0 3.3 3.5 7.5 2.9 2.6
Stage 1 29.0 32.7 24.7 31.7 41.6
Stage 2 36.9 36.7 37.4 34.5 32.5
Stage 3 3.1 1.3 4.0 2.9 2.6
Stage 4 0.5 0.4 0.0 0.0 2.6
Unknown 23.6 23.9 22.4 23.7 13.0
NAT = neoadjuvant therapy; CCI = Charlson/Deyo comorbidity index; NOS = not otherwise specified.
Table 1. (Continued) Patient, disease, and treatment characteristics of NAT cohort
Time (mo)
0.75
0 40 60
Percentage of Patients
1.00
0.50
0.25
20
Stage II
Time (mo)
Percentage of Patients
P=0.082
Stage III
0.75
0 40 60
1.00
0.50
0.25
20
P=0.023
>30 21–30
16–20 11–15
0–10 Fig. 3. Survival by eLNs in NAT cohort.
eLN = examined lymph node; NAT = neoadjuvant therapy.
Table 2. Factors impacting survival in NAT cohort
Variable HR 95% CI P-value
Lower Upper
No. of lymph nodes examined
≤10 Reference
11–15 0.86 0.66 1.11 0.246
16–20 0.71 0.52 0.98 0.039
21–30 0.55 0.38 0.79 0.001
>30 0.75 0.48 1.17 0.203
Age
18–59 Reference
60–69 1.08 0.83 1.41 0.561
70–79 1.54 1.09 2.17 0.014
80–90 3.52 1.87 6.64 <0.001
Sex
Male Reference
Female 0.96 0.74 1.25 0.757
Race
White (non-Hispanic) Reference
Black (non-Hispanic) 0.71 0.41 1.24 0.227
Other (non-Hispanic) 0.67 0.29 1.54 0.348
Hispanic 1.05 0.75 1.48 0.777
Insurance
Private Reference
Medicare 1.02 0.77 1.35 0.911
Medicaid & other government 1.59 1.08 2.35 0.019
Unknown 0.82 0.26 2.61 0.738
Not insured 1.67 0.77 3.65 0.195
Median income
<58,000 Reference
58,000–74,000 1.40 1.00 1.96 0.053
74,000–93,000 1.07 0.77 1.50 0.685
>93,000 0.92 0.66 1.29 0.645
Variable HR 95% CI P-value
Lower Upper
Comorbidities
CCI score 0 Reference
CCI score 1 1.22 0.96 1.55 0.100
CCI score 2 1.28 0.72 2.27 0.397
Facility type
Community Reference
Comprehensive community 0.52 0.32 0.83 0.007
Academic/research 0.52 0.33 0.82 0.005
Other 1.05 0.14 8.14 0.961
Facility location
Northeast Reference
South 1.18 0.89 1.56 0.249
Midwest 0.99 0.74 1.33 0.963
West 0.80 0.55 1.15 0.230
Surgery type
Proximal gastrectomy Reference
Total gastrectomy 0.86 0.67 1.11 0.242
Distal gastrectomy 0.80 0.53 1.19 0.271
Surgical margins
No residual tumor Reference
Residual tumor, NOS 2.05 1.05 4.01 0.035
Microscopic residual tumor 1.81 1.03 3.20 0.040
Macroscopic residual tumor 0.00 0.00 0.00 0.999
Indeterminate or unknown 1.09 0.39 2.99 0.874
Pathological stage
Stage 0 Reference
Stage 1 0.66 0.43 1.03 0.068
Stage 2 0.99 0.65 1.52 0.970
Stage 3 0.85 0.42 1.69 0.638
Stage 4 2.04 0.71 5.90 0.188
Unknown 0.62 0.39 0.98 0.041
NAT = neoadjuvant therapy; HR = hazard ratio; CI = confidence interval; CCI = Charlson/Deyo comorbidity index; NOS = not otherwise specified.
Table 2. (Continued) Factors impacting survival in NAT cohort
eLN
0
11–15 21–30 >30
Patients
1,200
800
400 1,000
600
200
<10 16–20
Fig. 4. Distribution of eLNs in initial surgery cohort.
eLN = examined lymph node.
Patient, disease, and treatment characteristics of patients who underwent initial surgery are stratified by eLN and presented in Table 3. Patients who received a suboptimal lymphadenectomy (eLN ≤10) tended to be older (P<0.001), white (P<0.001), and treated at a comprehensive community center (P<0.001). They tended to undergo a proximal
Table 3. Patient, disease, and treatment characteristics of initial surgery cohort
Variable ≤10 (n=1,187, %) 11–15 (n=553, %) 16–20 (n=404, %) 21–30 (n=432, %) >30 (n=219, %) P-value
Age 67.8 66.8 66.3 64.9 65.1 <0.001
18–59 23.8 25.5 28.2 32.2 26.5
60–69 27.0 32.0 28.7 28.2 35.2
70–79 32.4 28.8 30.0 27.5 29.7
80–90 16.8 13.7 13.1 12.0 8.7
Sex 0.075
Male 68.0 72.7 68.6 67.4 62.6
Female 32.0 27.3 31.4 32.6 37.4
Race <0.001
White (non-Hispanic) 73.3 68.4 70.3 68.3 59.4
Black (non-Hispanic) 9.0 9.2 6.7 6.9 7.8
Other (non-Hispanic) 5.1 7.8 7.2 10.6 12.3
Hispanic 12.6 14.6 15.8 14.1 20.5
Insurance 0.396
Private 33.6 35.4 39.6 39.8 39.3
Medicare 58.0 54.4 52.2 50.5 48.9
Medicaid & other government 5.4 6.1 5.7 5.8 8.2
Unknown 1.0 1.1 0.7 1.4 1.4
Not insured 2.0 2.9 1.7 2.5 2.3
Median income 0.202
<58,000 15.5 15.9 14.1 13.7 13.7
58,000–74,000 25.3 21.9 20.0 20.6 21.0
74,000–93,000 23.5 26.0 26.2 29.2 25.1
>93,000 32.8 33.3 38.4 35.0 38.8
Comorbidities 0.076
CCI score 0 62.0 65.1 65.8 69.2 70.8
CCI score 1 28.1 25.9 25.5 24.8 23.3
CCI score 2 9.9 9.0 8.7 6.0 5.9
Facility type <0.001
Community 6.6 5.2 7.2 4.2 4.6
Comprehensive community 48.8 38.3 35.4 31.5 25.1
Academic/research 44.4 56.2 56.9 64.4 70.3
Other 0.3 0.2 0.5 0.0 0.0
Facility location <0.001
Northeast 20.8 23.5 27.5 29.9 37.4
South 39.9 33.3 30.2 23.4 22.4
Midwest 23.0 25.5 27.0 27.5 19.2
West 16.3 17.7 15.3 19.2 21.0
Clinical stage 0.192
Stage I 71.7 74.1 70.3 71.1 73.5
Stage II 15.2 13.7 19.8 16.9 17.4
Stage III 6.4 6.7 5.7 8.6 5.5
Surgery type <0.001
Proximal gastrectomy 63.4 57.1 54.2 51.4 41.1
Total gastrectomy 26.9 32.9 36.1 40.7 50.7
Distal gastrectomy 9.8 9.9 9.7 7.9 8.2
Regional lymph nodes examined 5.6 12.9 17.9 24.7 38.7 <0.001
Surgical margins 0.161
No residual tumor 93.7 95.8 96.0 96.5 96.3
Residual tumor, NOS 1.1 1.1 0.7 0.9 0.5
Microscopic residual tumor 4.2 2.2 1.5 1.6 2.3
Macroscopic residual tumor 0.3 0.0 0.7 0.2 0.0
Indeterminate or unknown 0.8 0.9 1.0 0.7 0.9
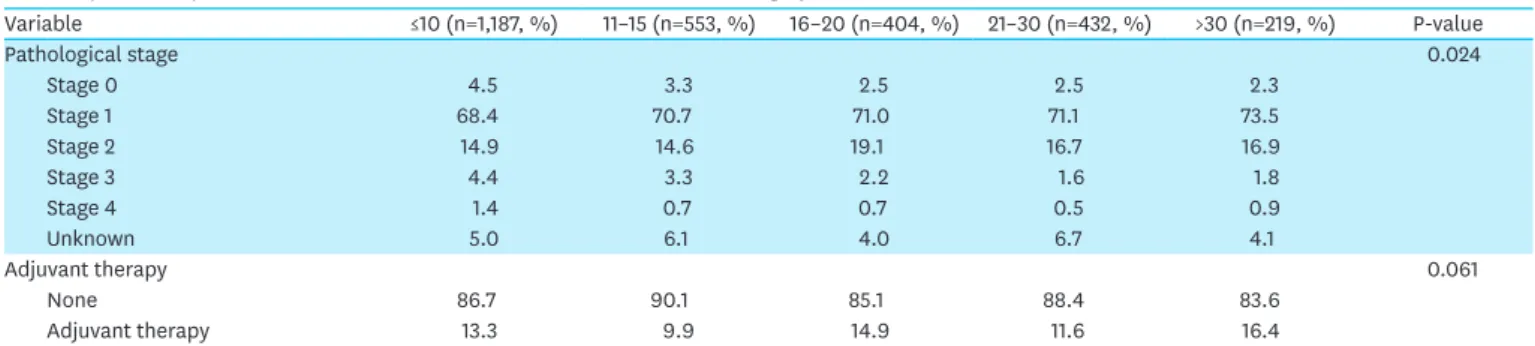
gastrectomy (P<0.001), and have a more advanced pathological stage (P=0.024). Clinical stage (P=0.192), surgical margins (P=0.161), and adjuvant therapy (P=0.061) did not significantly differ among eLN groups.
Survival of initial surgery cohort
Kaplan-Meier analyses of patients who underwent initial surgery are stratified by eLN and presented in Fig. 5. Inadequate lymphadenectomy with eLN ≤10 was associated with worse survival in clinical stage I–III diseases; however, this association was only significant in stages I and II (P<0.001 and P=0.002, respectively).
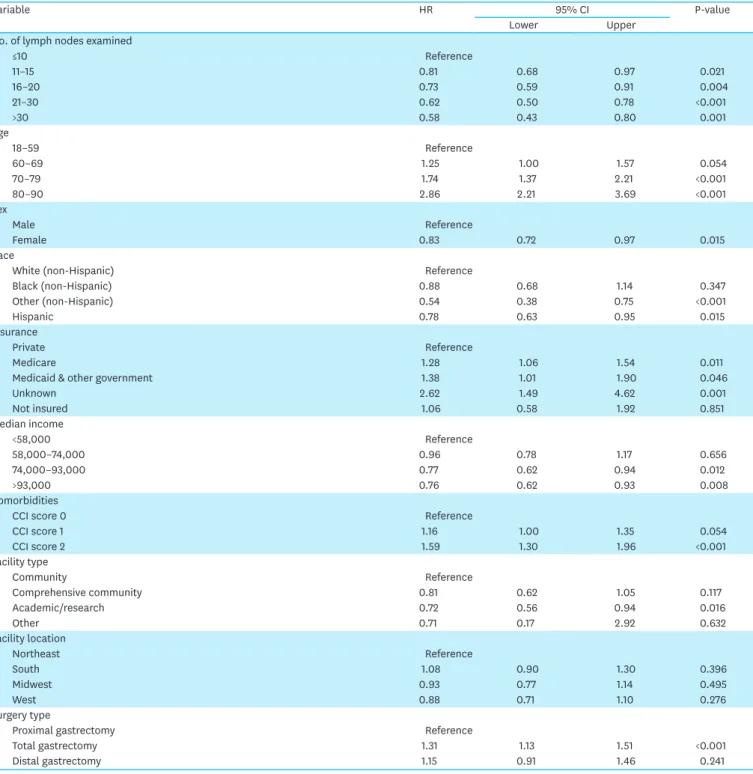
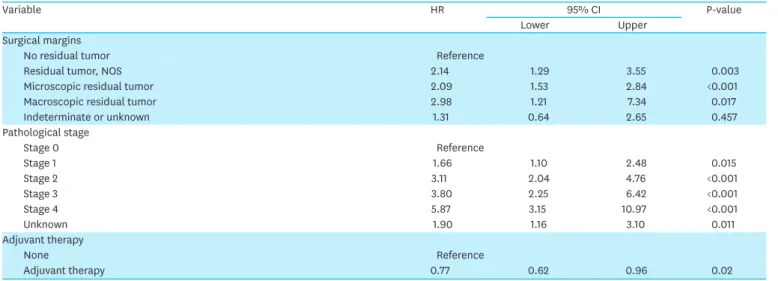
Results of a Weibull survival model of patients who underwent initial surgery are presented in Table 4. A greater number of eLN was associated with improved hazards of mortality (eLN 11–15: HR, 0.81; P=0.021, eLN 16–20: HR, 0.73; P=0.004, eLN 21–30: HR, 0.62; P<0.001, and eLN >30: HR, 0.58; P=0.001). Female sex, Hispanic or other race, greater median income, Variable ≤10 (n=1,187, %) 11–15 (n=553, %) 16–20 (n=404, %) 21–30 (n=432, %) >30 (n=219, %) P-value
Pathological stage 0.024
Stage 0 4.5 3.3 2.5 2.5 2.3
Stage 1 68.4 70.7 71.0 71.1 73.5
Stage 2 14.9 14.6 19.1 16.7 16.9
Stage 3 4.4 3.3 2.2 1.6 1.8
Stage 4 1.4 0.7 0.7 0.5 0.9
Unknown 5.0 6.1 4.0 6.7 4.1
Adjuvant therapy 0.061
None 86.7 90.1 85.1 88.4 83.6
Adjuvant therapy 13.3 9.9 14.9 11.6 16.4
CCI = Charlson/Deyo comorbidity index; NOS = not otherwise specified.
Table 3. (Continued) Patient, disease, and treatment characteristics of initial surgery cohort
Time (mo)
0.75
0 20 60
Percentage of Patients
1.00
0.50
0.25
40 Stage I
P<0.001
Stage II
Time (mo)
0.75
0 20 60
Percentage of Patients
1.00
0.50
0.25
40 P=0.002
Stage III
Time (mo)
0.75
0 20 60
Percentage of Patients
1.00
0.50
0.25
40 P=0.185
>30 21–30
16–20 11–15
0–10
Fig. 5. Survival by eLNs in initial surgery cohort.
eLN = examined lymph node.
Table 4. Factors impacting survival in initial surgery cohort
Variable HR 95% CI P-value
Lower Upper
No. of lymph nodes examined
≤10 Reference
11–15 0.81 0.68 0.97 0.021
16–20 0.73 0.59 0.91 0.004
21–30 0.62 0.50 0.78 <0.001
>30 0.58 0.43 0.80 0.001
Age
18–59 Reference
60–69 1.25 1.00 1.57 0.054
70–79 1.74 1.37 2.21 <0.001
80–90 2.86 2.21 3.69 <0.001
Sex
Male Reference
Female 0.83 0.72 0.97 0.015
Race
White (non-Hispanic) Reference
Black (non-Hispanic) 0.88 0.68 1.14 0.347
Other (non-Hispanic) 0.54 0.38 0.75 <0.001
Hispanic 0.78 0.63 0.95 0.015
Insurance
Private Reference
Medicare 1.28 1.06 1.54 0.011
Medicaid & other government 1.38 1.01 1.90 0.046
Unknown 2.62 1.49 4.62 0.001
Not insured 1.06 0.58 1.92 0.851
Median income
<58,000 Reference
58,000–74,000 0.96 0.78 1.17 0.656
74,000–93,000 0.77 0.62 0.94 0.012
>93,000 0.76 0.62 0.93 0.008
Comorbidities
CCI score 0 Reference
CCI score 1 1.16 1.00 1.35 0.054
CCI score 2 1.59 1.30 1.96 <0.001
Facility type
Community Reference
Comprehensive community 0.81 0.62 1.05 0.117
Academic/research 0.72 0.56 0.94 0.016
Other 0.71 0.17 2.92 0.632
Facility location
Northeast Reference
South 1.08 0.90 1.30 0.396
Midwest 0.93 0.77 1.14 0.495
West 0.88 0.71 1.10 0.276
Surgery type
Proximal gastrectomy Reference
Total gastrectomy 1.31 1.13 1.51 <0.001
Distal gastrectomy 1.15 0.91 1.46 0.241
(continued to the next page)
treatment at an academic or research center, and receipt of adjuvant therapy were also associated with a reduction in mortality. Greater age, coverage by Medicaid or Medicare, receipt of total gastrectomy, positive surgical margins, and advanced pathological stage were associated with increased hazards of mortality.
DISCUSSION
Despite a near linear improvement in median eLN from gastrectomy over the past decade, most US patients with node-negative gastric cancer received operations that failed to meet NCCN guidelines of retrieving ≥15 LNs. This concerning statistic suggests that surgeons nationwide may not understand the correlation between the systemic potential of gastric cancer and clearance of regional LNs, thus failing to perform the meticulous LN dissection necessary to achieve an optimal LN yield. University facilities may adhere more strictly to NCCN guidelines, as a study on 7 US universities reported a mean of 16 eLN, and our current study found that academic centers were more frequently associated with adequate oncologic lymphadenectomy [4].
The effect of eLN on western patients was explored by Smith et al. [16] with a retrospective analysis of the Surveillance, Epidemiology, and End Results (SEER) database from 1973 to 1999. They reported an association between increased number of eLN and improved survival in patients with T1-3, N0-1 gastric cancer [16]. However, given the increased utilization of NAT, as well as improvement in lymphadenectomy techniques, this analysis also includes antiquated treatment protocols [17]. Jin et al. [4] evaluated factors associated with recurrence and survival in 317 patients with node-negative gastric cancer from 2000–2012, and reported that eLN ≥15 was associated with improvements in overall survival, but not disease recurrence. However, given the small sample size and inclusion of exclusively university facilities, the authors conceded that the analysis may have been insufficiently powered [4]. To our knowledge, this is the first study to evaluate national treatment patterns and outcomes of node-negative gastric cancer after the formation of the Meta-Analysis Group in Cancer (MAGIC) though it did include data from years prior to the publication of the trial by Cunningham et al. [17] in 2006 which established NAT as standard of care. It also includes the largest number of Western patients to undergo NAT or surgery for node-negative gastric cancer.
Variable HR 95% CI P-value
Lower Upper
Surgical margins
No residual tumor Reference
Residual tumor, NOS 2.14 1.29 3.55 0.003
Microscopic residual tumor 2.09 1.53 2.84 <0.001
Macroscopic residual tumor 2.98 1.21 7.34 0.017
Indeterminate or unknown 1.31 0.64 2.65 0.457
Pathological stage
Stage 0 Reference
Stage 1 1.66 1.10 2.48 0.015
Stage 2 3.11 2.04 4.76 <0.001
Stage 3 3.80 2.25 6.42 <0.001
Stage 4 5.87 3.15 10.97 <0.001
Unknown 1.90 1.16 3.10 0.011
Adjuvant therapy
None Reference
Adjuvant therapy 0.77 0.62 0.96 0.02
HR = hazard ratio; CI = confidence interval; CCI = Charlson/Deyo comorbidity index; NOS = not otherwise specified.
Table 4. (Continued) Factors impacting survival in initial surgery cohort
In our study, both in patients who received NAT and in those who underwent initial surgery, a greater number of eLN was associated with improved survival. A study by Deng et al. [18] of 112 Chinese patients with node-negative gastric cancer reported that eLN >20 was associated with improved survival. Another study on 600 Chinese patients with node negative gastric cancer recently reported that eLN was the strongest independent prognostic predictor and urged eLN to be considered a mandatory requirement for improving prognostic evaluations [10]. An Italian study, pre-dating the MAGIC trial, of 301 node-negative patients from 1992–
2002 reported an association between eLN >25 and improved survival [19]. These studies all advocate for meticulous LN dissection and optimizing the number of harvested nodes.
To our knowledge, this is the largest and most contemporary study on western patients with node-negative gastric cancer treated at a wide spectrum of CoC-accredited facilities.
However, there are some important limitations which should be considered when interpreting the results. The NCDB is a database sourced from hospital registry data from diverse institutions across the United States, and data recording may vary slightly from facility to facility. Furthermore, though the NCDB was designed to collect oncologic data, it lacks chemotherapy regimen, disease recurrence, disease-specific death, and complications data. Given the retrospective nature of this study, there likely exists a selection bias, with patients with more severe presentations treated more aggressively. Additionally, node- negative disease was defined as patients with AJCC pathologic N0 disease. The database does not specify why patients received NAT, but it is possible that patients with clinically node positive disease converted to pathologic node negative disease following NAT and would thus be included in this study. While the NCCN recommends examination of at least 15 LNs, this study included patients with suboptimal lymphadenectomies to provide a more complete overview of US gastric cancer care. However, sub-optimal lymphadenectomy was controlled for in the multivariable Weibull survival analyses. Most patients in this study underwent proximal gastrectomy, which could include patients with gastroesophageal junction cancer, which current NCCN guidelines classify as esophageal tumors. However, this study used the NCDB gastric participant user file (PUF), not the esophagus PUF, to reduce possible misclassification. To further account for this, the multivariable Weibull analyses controlled for tumor location. Finally, it is important to consider the differences in pathologic specimen evaluation between Eastern countries and the United States [20]. While Eastern surgeons dissect out each LN station, Western surgeons typically submit specimens en bloc [21].
In conclusion, most US patients with node-negative gastric cancer receive a suboptimal lymphadenectomy. Even in node-negative disease, increasing the number of retrieved lymph nodes appears to have therapeutic and prognostic value, irrespective of initial treatment. This suggests a survival benefit to meticulous lymphadenectomy in Western patients with node- negative gastric cancer.
REFERENCES
1. Howlader N, Noone AM, Krapcho M, Garshell J, Miller D, Bishop K, et al. SEER Cancer Statistics Review, 1975–2012. Bethesda (MD): National Cancer Institute, 2014.
2. Kim JP, Hur YS, Yang HK. Lymph node metastasis as a significant prognostic factor in early gastric cancer: analysis of 1,136 early gastric cancers. Ann Surg Oncol 1995;2:308-313.
PUBMED | CROSSREF
3. Seto Y, Nagawa H, Muto T. Impact of lymph node metastasis on survival with early gastric cancer. World J Surg 1997;21:186-189.
4. Jin LX, Moses LE, Squires MH 3rd, Poultsides GA, Votanopoulos K, Weber SM, et al. Factors associated with recurrence and survival in lymph node-negative gastric adenocarcinoma: a 7-institution study of the US Gastric Cancer Collaborative. Ann Surg 2015;262:999-1005.
PUBMED | CROSSREF
5. Japanese Gastric Cancer Association. Japanese gastric cancer treatment guidelines 2014 (ver. 4). Gastric Cancer 2017;20:1-19.
PUBMED | CROSSREF
6. Cuschieri A, Weeden S, Fielding J, Bancewicz J, Craven J, Joypaul V, et al. Patient survival after D1 and D2 resections for gastric cancer: long-term results of the MRC randomized surgical trial. Surgical Co- operative Group. Br J Cancer 1999;79:1522-1530.
PUBMED | CROSSREF
7. Hartgrink HH, van de Velde CJ, Putter H, Bonenkamp JJ, Klein Kranenbarg E, Songun I, et al. Extended lymph node dissection for gastric cancer: who may benefit? Final results of the randomized Dutch gastric cancer group trial. J Clin Oncol 2004;22:2069-2077.
PUBMED | CROSSREF
8. Songun I, Putter H, Kranenbarg EM, Sasako M, van de Velde CJ. Surgical treatment of gastric cancer: 15- year follow-up results of the randomised nationwide Dutch D1D2 trial. Lancet Oncol 2010;11:439-449.
PUBMED | CROSSREF
9. National Comprehensive Cancer Network (US). NCCN Clinical Practice Guidelines in Oncology Version Gastric Cancer. Fort Washington (PA): National Comprehensive Cancer Network, 2017.
10. Deng J, Yamashita H, Seto Y, Liang H. Increasing the number of examined lymph nodes is a prerequisite for improvement in the accurate evaluation of overall survival of node-negative gastric cancer patients.
Ann Surg Oncol 2017;24:745-753.
PUBMED | CROSSREF
11. Hsu JT, Yeh TS, Jan YY. Survival impact of the number of lymph node dissection on stage I-III node- negative gastric cancer. Transl Gastroenterol Hepatol 2016;1:9.
PUBMED | CROSSREF
12. He H, Shen Z, Wang X, Qin J, Sun Y, Qin X. Survival benefit of greater number of lymph nodes dissection for advanced node-negative gastric cancer patients following radical gastrectomy. Jpn J Clin Oncol 2016;46:63-70.
PUBMED | CROSSREF
13. Zheng WF, Ji TT, Lin Y, Li RZ. The prognostic value of lymph nodes count on survival of patients with node-negative gastric cancer. Oncotarget 2016;7:43680-43688.
PUBMED | CROSSREF
14. Charlson ME, Pompei P, Ales KL, MacKenzie CR. A new method of classifying prognostic comorbidity in longitudinal studies: development and validation. J Chronic Dis 1987;40:373-383.
PUBMED | CROSSREF
15. Deyo RA, Cherkin DC, Ciol MA. Adapting a clinical comorbidity index for use with ICD-9-CM administrative databases. J Clin Epidemiol 1992;45:613-619.
PUBMED | CROSSREF
16. Smith DD, Schwarz RR, Schwarz RE. Impact of total lymph node count on staging and survival after gastrectomy for gastric cancer: data from a large US-population database. J Clin Oncol 2005;23:7114-7124.
PUBMED | CROSSREF
17. Cunningham D, Allum WH, Stenning SP, Thompson JN, Van de Velde CJ, Nicolson M, et al. Perioperative chemotherapy versus surgery alone for resectable gastroesophageal cancer. N Engl J Med 2006;355:11-20.
PUBMED | CROSSREF
18. Deng J, Liang H, Sun D, Zhang R, Zhan H, Wang X. Prognosis of gastric cancer patients with node- negative metastasis following curative resection: outcomes of the survival and recurrence. Can J Gastroenterol 2008;22:835-839.
PUBMED | CROSSREF
19. Baiocchi GL, Tiberio GA, Minicozzi AM, Morgagni P, Marrelli D, Bruno L, et al. A multicentric Western analysis of prognostic factors in advanced, node-negative gastric cancer patients. Ann Surg 2010;252:70-73.
PUBMED | CROSSREF
20. Lauwers GY, Shimizu M, Correa P, Riddell RH, Kato Y, Lewin KJ, et al. Evaluation of gastric biopsies for neoplasia: differences between Japanese and Western pathologists. Am J Surg Pathol 1999;23:511-518.
PUBMED | CROSSREF
21. Yamamoto M, Rashid OM, Wong J. Surgical management of gastric cancer: the East vs. West perspective.
J Gastrointest Oncol 2015;6:79-88.
PUBMED | CROSSREF