Optimized M9 Minimal Salts Medium for Enhanced
Growth Rate and Glycogen Accumulation of Escherichia coli DH5α
Liang Wang1,2*, Qinghua Liu2, Yangguang Du3, Daoquan Tang2,4, and Michael J. Wise5,6*
1Department of Bioinformatics, School of Medical Informatics, 2Jiangsu Key Laboratory of New Drug Research and Clinical Pharmacy, School of Pharmacy, Xuzhou Medical University, Xuzhou 221000, China
3Xuzhou Center for Disease Control and Prevention, Xuzhou 221000, China
4Center for Experimental Animals, Xuzhou Medical University, Xuzhou 221000, China
5Computer Science and Software Engineering, 6The Marshall Centre for Infectious Diseases Research and Training, University of Western Australia, Perth 6009, Australia
Received: April 5, 2018 / Revised: June 6, 2018 / Accepted: June 7, 2018
Introduction
Glycogen is a widespread carbon and energy storage molecule in prokaryotes, and consists of glucosyl resi-
dues only [1, 2]. Glucosyl units in linear chains are first linked together by α-1,4-glucosyl linkages. Linear chains are then connected together by α-1,6-glucosyl linkages to form branches [3]. Recently, glycogen was confirmed as an important compound for bacterial environmental durability and pathogenicity due to its highly branched structure and unexpected connections with a variety of metabolism pathways, such as trehalose, maltose and capsular glucan, etc. [1, 2, 4−7]. Thus, accumulation of sufficient glycogen in liquid culture is a pre-requisite for investigating glycogen physiological functions and char- Glycogen plays important roles in bacteria. Its structure and storage capability have received more atten- tion recently because of the potential correlations with environmental durability and pathogenicity. How- ever, the low level of intracellular glycogen makes extraction and structure characterization difficult, inhibiting functional studies. Bacteria grown in regular media such as lysogeny broth and tryptic soy broth do no accumulate large amounts of glycogen. Comparative analyses of bacterial media reported in literature for glycogen-related studies revealed that there was no consistency in the recipes reported.
Escherichia coli DH5α is a convenient model organism for gene manipulation studies with respect to gly- cogen. Additionally, M9 minimal salts medium is widely used to improve glycogen accumulation, although its composition varies. In this study, we optimized the M9 medium by adjusting the concentrations of itro- gen source, tryptone, carbon source, and glucose, in order to achieve a balance between the growth rate and glycogen accumulation. Our result showed that 1 × M9 minimal salts medium containing 0.4% tryp- tone and 0.8% glucose was a well-balanced nutrient source for enhancing the growth and glycogen storage in bacteria. This result will help future investigations related to bacterial physiology in terms of glycogen function.
Keywords: Glycogen accumulation, M9 minimal salts medium, tryptone, glucose
*Corresponding authors L. W.
Tel: +86-139-2175-0542 E-mail: [email protected] M. J. W.
Tel: +61-8-6488-3452
E-mail: [email protected]
© 2018, The Korean Society for Microbiology and Biotechnology
acterizing its structures through different techniques, such as transmission electron microscopy (TEM), size exclusive chromatography (SEC), and fluorophore- assisted carbohydrate electrophoresis (FACE), etc. [8].
In this short communication, we report an optimized recipe of M9 minimal salts medium for promoting E. coli DH5α growth and glycogen accumulation.
Bacterial growth requires abundant and well-bal- anced nutrients, while glycogen accumulation normally occurs under growth-limited conditions with excessive carbon source and deficiency of other nutrients like
nitrogen and phosphorus at stationary phase [4, 9, 10].
There are normally five energy storage compounds in bacteria, which are: polyphosphate (polyP), wax ester (WE), triacylglycerol (TAG), polyhydroxylbutyrate (PHB) and glycogen [2, 11]. Not all bacteria store glycogen as an energy compound, while some bacteria may accu- mulate multiple energy compounds [2]. For example, host-associated bacteria such as Buchnera aphidi- cola, Wolbachia pipientis, and Coxiella burneti do not have glycogen metabolism related enzymes, hence no glycogen storage [2]. Human pathogen Mycobacterium
Table 1. Culture media used for studying glycogen metabolism and/or accumulationin of Escherichia coli.
E. coli
strains Medium Composition Growth
rate*
Glycogen
accumulation Methodology Year Ref.
K12 M9 M9 complemented with 2.7 g/l glucose N/A N/A HPLC
GOPOD Assay
2017 [17]
BW25113 M9 48 mM Na2HPO4, 22 mM KH2PO4, 9 mM NaCl, 19 mM NH4Cl, 0.1 mM CaCl2, 2 mM MgSO4, 0.4% glucose or glycerol, 100 μg/ml amino acids
5 N/A N/A 2016 [18]
MG1665 LB 10 g/l BactoTM tryptone, 5 g/l yeast extract, 10 g/l NaCl
N/A N/A Electron micrography 2016 [19]
DH5α M9 1.5% agarose, 0.4% glucose, 0.2% thiamine, 2 mM MgSO4, and 0.1 mM CaCl2
12 80 ng/μg Iodine vapor staining GOPOD Assay
2015 [15]
K12 M9 M9 containing 95 mM Na2HPO4, 44 mM KH2PO4, 17 mM NaCl, 37 mM NH4Cl, 0.1 mM CaCl2, 2 mM MgSO4 and 50 mM glucose
7 N/A Iodine vapor staining 2014 [20]
K12 MOPS MOPS containing 0.4% glucose 9 0.15 mg/ml Theoretical calculation 2012 [21]
K12 Kornberg 1.1% K2HPO4, 0.85% KH2PO4, 0.6% yeast extract, 50 mM glucose, 1 mM MgCl2
N/A N/A Iodine vapor staining 2010 [22]
K12 Kornberg 1.1% K2HPO4, 0.85% KH2PO4, 0.6% yeast extract, 250 μM Mg2+, 50 mM glucose
10 180 nmol/mg Amyloglucosidase, hexokinase, and glucose-6-P dehydrogenase-based test kit
2009 [23]
EDL933 LB LB agar plate containing 2% glucose N/A N/A Iodine vapor staining 2008 [7]
K12 Kornberg 1.1% K2HPO4, 0.85% KH2PO4, 0.6% yeast extract, 50 mM glucose
N/A Percentage to WT
Iodine vapor staining 2007 [24]
BW2511 BWX1 BWX2 DH5α
BL21AI RR1 MS201
IK5
M9 0.4% glucose, 0.4% Casamino acids, 0.1 mM CaCl2, 0.2% MgSO4·7H2O, 0.6% Na2HPO4, 0.3% KH2PO4, 0.5% NaCl, 0.1% NH4Cl
12 Varied Iodine vapor staining GOPOD Assay
2005 [10]
BL21(DE3) M9 N/A N/A N/A N/A 2004 [25]
B LB LB medium containing 10 g/l tryptone, 5 g/l yeast extract, 5g/l NaC1, 3g/l KH2P04, 1g/l K2HPO4, and 0.2% glucose
N/A N/A Alpha-amylase and glucose measurement
1994 [26]
K12 Kornberg Kornberg medium containing 0.5% glucose N/A N/A Iodine vapor staining 1993 [27]
K12 Enriched media
N/A N/A N/A N/A 1981 [28]
*Growth rates mean time points where exponential phase ends.
tuberculosis, on the other hand, stores both wax ester and glycogen as reserves [2]. As for when glycogen is accumulated, several bacterial species such as Strepto- coccus mitis and Sulfolobus solfataricus store glycogen at the unusual exponential phase [12]. Although most bacteria grow well in broths like LB (Lysogeny broth, Sigma) and TSB (Tryptic soy broth, BD), etc., they require specific types of media for sufficient glycogen accumulation [13, 14]. So far, manipulation of glycogen structure at genome level has been widely studied in E.
coli [15]. Meanwhile, E. coli DH5α (Thermo Fisher Sci- entific) has been confirmed to be efficiently competent for plasmid transformation with high insertion stability [16]. Thus, we use E. coli DH5α as a model organism for glycogen studies.
Glycogen study requires specialized medium for suffi- cient glycogen accumulation. We searched previously reported media used in glycogen study and found out that no consistency exists (Table 1). A variety of media, including LB, Kornberg, MOPS, and M9 are used and the supplements have varied between studies. The initial purpose of our study was to investigate how N- terminus of glycogen branching enzyme (GBE) influ- ences glycogen structure. Thus, we constructed a set of E. coli DH5α mutants with progressive truncation of GBE N-terminus, which were E. coli DH5α glgBΔ90, E.
coli DH5α glgBΔ180, E. coli DH5α glgBΔ270, and E. coli DH5α glgBΔ369. A complete GBE gene knockout strain was also constructed and termed E. coli DH5α ΔglgB.
Using LB broth to culture these strains resulted in no glycogen being detected, which made our following study infeasible. Thus, it was necessary to enhance bacterial glycogen storage abilities. 1 × M9 minimal salts medium supplemented with 0.8% glucose was then used, which was also a failure due to the slow growth rate of E. coli DH5α in the medium. Thus, we then tried to optimize the tryptone to glucose ratio in order to balance growth rate and glycogen accumulation.
In summary, this study provides a clear picture about how nitrogen and carbon sources in M9 minimal salts medium influence E. coli DH5α growth and glycogen accumulation. The optimized 1 × M9 minimal salts medium (supplemented with 0.4% tryptone and 0.8%
glucose) has proved to be an effective source for facilitat- ing the structural and functional characterization of gly- cogen in E. coli DH5α.
Materials and Methods
Bacterial strains, plasmids, cultures, and growth condi- tions
Bacterial strains used in this study include E. coli BL21 (DE3), E. coli DH5α, E. coli RR1 and E. coli IK5. λ- Red homologous recombination system was used for con- structing mutants in E. coli DH5α, which consists of three plasmids, pKD4, pKD46, and pCP20. Lysogeny broth (BactoTM tryptone, BactoTM yeast extract, and NaCl) and M9 minimal salts (Sigma-Aldrich, USA) were used for culturing bacterial strains. Trace elements con- sisting of EDTA (1%), ZnSO4 (0.029%), MnCl2 (0.198%), CoCl2 (0.254%), CuCl2 (0.0134%), and CaCl2 (0.147%) were added to all M9 minimal salts media. All bacteria were cultured at 37℃ at 220 rpm shaking rate for growth rate measurement and glycogen accumulation, except where otherwise specified.
Mutant constructions
Five mutants of E. coli DH5α expressing progressively deleted GBEs in the chromosomal position of glgB were constructed, which were E. coli DH5α glgBΔ90, E. coli DH5α glgBΔ180, E. coli DH5α glgBΔ270, E. coli DH5α glgBΔ369, and E. coli DH5α ΔglgB. λ-Red recombination system (Plasmids pKD4, pKD46, and pCP20) by Datsenko and Wanner [35] was generously provided by Dr. Harry Sakellaris. Plasmid pKD46 was first trans- formed into E. coli DH5α. Then, six primers H1P1, P2H2, P2H3, P2H4, P2H5, P2H6 with 36 nucleotides in 5’ and 3’ regions that correspond to homologous regions in glgB were used to amplify linear PCR products from plasmid pKD4. All the five linear PCR products had the length of 1.5 kb and contained a kanamycin resistance gene flanked by FRT sites. These linear PCR products were electroporated into competent E. coli DH5α cells carrying pKD46. Recombination catalysed between the FRT sites and the glgB locus by the λ-Red recombinse resulted in the replacement of the wild type glgB chro- mosomal locus with the deleted variants. For details, please refer to Wang et al. [15].
Optimization of M9 minimal salt media
Sterilized 20% tryptone solution was used to supple- ment 1 × M9 minimal salts medium (0.8% glucose). By adjusting tryptone/glucose ratio (T/G), we made up six
types of 1 × M9 minimal media, which were 1 × M9 minimal media with T/G ratio as 0 (0% T), 0.0125 (0.01%
T), 0.0625 (0.05% T), 0.125 (0.1% T), 0.5 (0.4% T), and 1.0 (0.8% T). These mediawere tested for E. coli DH5α and its five mutants in terms of growth rates. Glycogen accumulation amount in E. coli DH5α were also mea- sured when cultured at different 1 × M9 minimal salts media for 22 h.
Measurement of E. coli DH5α growth curves
A single colony was picked from a selective LB agar plate and cultured in 5 ml LB broth at 37℃ overnight with 220 rpm shaking rate. 250 μl of the LB broth was used to inoculate 25 ml liquid media (LB broth and 1 × M9 minimal medium T/G = 1:2, etc.) in a 125 ml sterile flask, which was cultured at 37℃ overnight with 220 rpm shaking rate. At selected time points, the culture was taken out of the flask aseptically and aliquoted into a 96- well microtiter plate. Then, an OD600 value was mea- sured and recorded by using a spectrophotometer. OD600 readings were drawn by correlating with corresponding time points to draw growth curves.
Protein quantification
In order to quantify the protein amount in samples, a standard protein concentration curved was constructed using 0.25 mg/ml BSA (mix 125 μl 2% BSA with 875 μl dH2O) and Coomasie Plus (Bradford, Australia). All sample solutions were vortexed vigorously to mix the solutions well with Coomasie assay. The protein absor- bance of standards and samples was measured with a spectrophotometer at 595 nm wavelength at the same time. A standard curve was constructed based on OD595 readings for standards, which was then used to calculate protein concentrations in samples.
Quantification of glycogen content
10 ml of bacterial culture was centrifuged at 5,000 ×g, room temperature for 10 min. Then the cell pellet was resuspended in 0.05 M Triethanolamine (TEA) buffer, which was centrifuged again at 5,000 ×g, room tempera- ture for 10 min. The pellet was resuspended in 500 μl sodium acetate buffer followed by adding 10 μl 0.1 M Pefabloc (protease inhibitor). The suspension was soni- cated for 10 sec on ice and rested on ice for 30 sec with 25% amplitude. The sonication procedure was repeated
for two more times. 100 μl of the sonicated crude extract was aliquoted to a fresh Eppendorf tube with 10 μl amy- loglucosidase (200 unit/ml). The tube was incubated at 50℃ for 30 min. A blank control was always kept along with the test tube. No amyloglucosidase was added into the blank control tube. After incubation, tubes were cen- trifuged at 14,000 ×g for 5 min and supernatants were transferred to fresh Eppendorf tubes. 1 ml of glucose oxi- dase/peroxidase (GOPOD, Australia) was added to each of the tubes, which were incubated at 50℃ for 20 min.
Then, the reaction mixture was transferred to a 96-well plate with 150 μl solution/well and the absorbance at 510 nm wavelength (OD510) was recorded.
Computational analysis
All data obtained from experiments were analysed statistically. Excel and R packages were used for pair- wised Student’s t-test and graph illustrations. Statistical significance was defined as p-value less than 0.05.
Results and Discsussion
Most of the studies have focused on how glycogen metabolism-related genes influence E. coli growth rates and glycogen accumulation, rather than the impacts of culture medium [17, 18, 22]. Varik et al. noticed the importance of culture composition and studied how amino acid composition could change E. coli growth rate and glycogen accumulation [18]. During our study of gly- cogen structure manipulation and its impact on bacte- rial viability, we noticed that sufficient glycogen accumulation through bacterial culture is an essential factor. Thus, we initiated the culture optimization work.
At the beginning, the bacterium was cultured in LB broth at 37℃ with 220 rpm shaking rate, which turned out to be a failure due to the trace amount of glycogen stored in bacterial cells. This could be caused by abun- dant nutrients available in the broth that inhibit glyco- gen storage. We then tested the commercial M9 minimal salts (Sigma) for glycogen accumulation based on litera- ture reports [5, 29]. The main ingredients of M9 minimal salts include Na2HPO4, KH2PO4, NaCl and NH4Cl.
However, E. coli DH5α grows extremely slowly when following the manufacturer’s instructions, even after supplementing 0.8% glycogen as a carbon source. The reason for such a low growth rate might be due to ammo-
nium chloride being the single nitrogen source in the medium [30, 31], which means that all essential amino acids have to be synthesized from scratch. Thus, we pro- vided the organic nitrogen source tryptone (T), that includes free amino acids, to gradually adjust 1 × M9 minimal salts medium while glucose (G) concentration was fixed at 0.8%. By doing this, we may achieve a bal- ance between bacterial cell density and glycogen storage since low nitrogen source will limit the growth of E. coli.
1 ml of trace elements was also added into the medium for each litre in order to ensure normal growth of E. coli DH5α.
Growth curves of E. coli DH5α were measured in trip- licate for each of the six 1 × M9 minimal media. Results are shown as an average for each medium in Fig. 1.
Improvement of growth rates was observed through increased T/G ratios. Higher T/G ratio led to a reduced lag and exponential phase while stationary phase was remarkably extended. For 1 × M9 minimal salts medium (T/G = 0), E. coli DH5α grows slowly. For 1 × M9 mini- mal media (T/G = 1:80, 1:16, and 1:8), E. coli DH5α grows faster and reaches higher OD600 values at 22 h.
When T/G ratio is 1:2, the bacterium grows fastest, although the highest OD600 value that E. coli DH5α can reach drops a little bit to around 1.0. For T/G = 1:1, after E. coli DH5α enters into stationary phase, cells clustered together to form aggregates, which makes OD600 mea- surement inaccurate. Thus, after 12 h, there is no OD600
reading in this medium (T/G = 1:1). The observed bacte- rial clustering might be caused by bacterial auto-aggre- gation because of chemotaxis induced by over-nutrition [32]. However, specific mechanisms for the clustering require further investigation and are beyond the scope of this study. No similar phenomena were observed for other media. Thus, 1 × M9 minimal medium (T/G = 1:1) was not considered for further experiments and 1 × M9 minimal medium (T/G = 1:2) is considered to be optimal for enhancing bacterial growth.
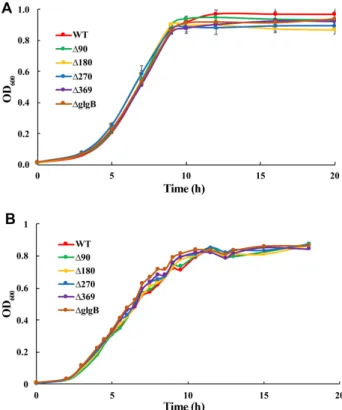
It had previously been established in vitro that N- terminal truncation of glycogen branching enzyme (GlgB) has an impact on glycogen chain length distribu- tion [33, 34]. Thus, we constructed four E. coli DH5α mutants (E. coli DH5α glgB∆90, glgB∆180, glgB∆270, glgB∆369) with in situ progressive truncation of N- terminus of GlgB and a glgB-deficient strain E. coli DH5α∆glgB for glycogen structure manipulation [15].
Growth consistency for all E. coli DH5α strains in M9
Fig. 1. Growth curves of E. coli DH5α in 1 × M9 minimal salt medium with different T/G ratios. According to the result, the higher the T/G ratio is, the faster the bacteria grow. For each time point, three replicates were used for calculating the aver- age. Significant difference was observed between T/G = 0 and T/G = 1:2 through two-tailed student-t test (*, p-value < 0.05).
Fig. 2. Growth curves of E. coli DH5α strains in (A) 1 × M9 minimal salt medium (T/G = 1:2) and (B) LB broth. For 1 × M9 minimal salts medium, three replicates were per- formed. Average value with standard error bar was presented.
For LB growth curve, four repeats of a single culture for each strain were performed and average value was presented.
minimal salt medium (T/G = 1:2) is essential for glyco- gen analysis. In addition, growth rates of E. coli DH5α strains in 1 × M9 minimal salts medium (T/G = 1:2) should be comparable to these in LB broth. Thus, wecompared the growth rates of all E. coli DH5α in the two media. The results showed that optimized 1 × M9 minimal salt medium (T/G = 1:2) is sufficient for all strains to grow quickly and consistently and no signifi- cant differences were observed between the two media in terms of growth rates (Fig. 2). E. coli RR1 and IK5 were also used for growth rate measurement and there was no significant difference observed (unpublished data).
Since the current study for glycogen structure is mainly restricted by small accumulation amount, we also exam- ined the glycogen level in E. coli DH5α at 22 h in LB broth and five 1 × M9 minimal salts media for glycogen storage optimization. Glycogen contents in bacterial strains were assayed by following the protocol specified by Wang et al. [15]. The ratio of glucose/protein (G/P) was used to represent the amount of glycogen accumu- lated inside E. coli DH5α cells. LB broth showed no detectable glycogen accumulation. Fig. 3 shows that E.
coli DH5α in 1 × M9 minimal salts medium (T/G = 1:2) had the highest amount of G/P ratio.
In sum, E. coli DH5α grows quickly with comparatively short exponential phase, extended stationary phase, and high level of glycogen accumulation amount in 1 × M9 minimal salt medium (T/G = 1:2). Thus, 1 × M9 minimal salt medium (T/G = 1:2) is optimal to culture E. coli DH5α for glycogen structure characterization and physi- ological function analyses.
Acknowledgments
We thank Dr. Harry Sakellaris for kindly providing us the λ-Red recombination system as a gift. We are also debt to Dr. Charlene M.
Kahler, Dr. Ahmed Regina, Dr. Vito M. Butardo Jr., Dr. Behjat Kosar- Hashemi, and Dr. Jixun Luo for their constructive suggestions and technical support of this study. The work was supported by UWA- China Scholarship and CSIRO Industrial Traineeship award. Part of the project was also supported by the Start-up Fund for Excellent Researchers at Xuzhou Medical University (No. D2016007), Nature and Science Fund for Colleges and Universities of Jiangsu Province (No.
16KJB180028), Innovative and Entrepreneurial Talent Scheme of Jiangsu Province (2017), and Natural Science Foundation of Jiangsu Province (BK20180997).
Conflict of Interest
The authors have no financial conflicts of interest to declare.
References
1. Wilson WA, Roach PJ, Montero M, Baroja-Fernandez E, Munoz FJ, Eydallin G. et al. 2010. Regulation of glycogen metabolism in yeast and bacteria. FEMS Microbiol. Rev. 34: 952-958.
2. Wang L, Wise MJ. 2011. Glycogen with short average chain length enhances bacterial durability. Naturwissenschaften 98:
719-729.
3. Melendez R, Melendez-Hevia E, Cascante M. 1997. How did gly- cogen structure evolve to satisfy the requirement for rapid mobi- lization of glucose? A problem of physical constraints in structure building. J. Mol. Evol. 45: 446-455.
4. Chandra G, Chater KF, Bornemann S. 2011. Unexpected and widespread connections between bacterial glycogen and treha- lose metabolism. Microbiology 157: 1565-1572.
5. Bourassa L, Camilli A. 2009. Glycogen contributes to the environ- mental persistence and transmission of Vibrio cholerae. Mol.
Microbiol. 72: 124-138.
6. Sambou T, Dinadayala P, Stadthagen G, Barilone N, Bordat Y, Con- stant P. et al. 2008. Capsular glucan and intracellular glycogen of Mycobacterium tuberculosis: biosynthesis and impact on the persistence in mice. Mol. Microbiol. 70: 762-774.
7. Jones SA, Jorgensen M, Chowdhury FZ, Rodgers R, Hartline J, Leatham MP. et al. 2008. Glycogen and maltose utilization by Fig. 3. Glycogen accumulation abilities of E. coli DH5α cul-
tured in five types of 1 × M9 minimal salt media with differ- ent T/G ratio at 22 h. Three replicates were used for each medium. Glucose/Protein ratio (G/P) was used as an equivalent unit of glycogen concentration accumulated in E. coli DH5α cells. Significant differences were observed based on two-tailed student-t test for T/G = 1:8, T/G = 1:16, and T/G = 1:80 when they were compared with T/G = 1:2, respectively (*, p-value <
0.05).
Escherichia coli O157:H7 in the mouse intestine. Infect. Immun.
76: 2531-2540.
8. Martinez-Garcia M, Stuart MC, Van Der Maarel MJ. 2016. Charac- terization of the highly branched glycogen from the thermoaci- dophilic red microalga Galdieria sulphuraria and comparison with other glycogens. Int. J. Biol. Macromol. 89: 12-18.
9. Preiss J. 1984. Bacterial glycogen synthesis and its regulation.
Annu. Rev. Microbiol. 38: 419-458.
10. Dauvillee D, Kinderf IS, Li ZY, Kosar-Hashemi B, Samuel MS, Rampling L. et al. 2005. Role of the Escherichia coli glgX gene in glycogen metabolism. J. Bacteriol. 187: 1465-1473.
11. Wang L, Liu Z, Dai S, Yan J, Wise MJ. 2017. The sit-and-wait hypothesis in bacterial pathogens: a theoretical study of durability and virulence. Front. Microbiol. 8: 2167.
12. Iglesias A, Preiss J. 1992. Bacterial glycogen and plant starch bio- synthesis. Biochem. Educ. 20: 196-203.
13. Fung T, Kwong N, Zwan TVD, Wu M. 2013. Residual glycogen metabolism in Escherichia coli is specific to the limiting macronu- trient and varies during stationary phase. J. Exp. Microbiol. Immunol.
17: 83-87.
14. Suzuki E, Umeda K, Nihei S, Moriya K, Ohkawa H, Fujiwara S. et al.
2007. Role of the GlgX protein in glycogen metabolism of the cyanobacterium, Synechococcus elongatus PCC 7942. Biochim.
Biophys. Acta 1770: 763-773.
15. Wang L, Regina A, Butardo VM, Jr., Kosar-Hashemi B, Larroque O, Kahler CM. et al. 2015. Influence of in situ progressive N-terminal is still controversial truncation of glycogen branching enzyme in Escherichia coli DH5α on glycogen structure, accumulation, and bacterial viability. BMC Microbiol. 15: 96.
16. Kostylev M, Otwell AE, Richardson RE, Suzuki Y. 2015. Cloning should be simple: Escherichia coli DH5α-mediated assembly of multiple DNA fragments with short end homologies. PLoS One 10: e0137466.
17. Morin M, Ropers D, Cinquemani E, Portais JC, Enjalbert B, Cocaign-Bousquet M. 2017. The Csr system regulates Escherichia coli fitness by controlling glycogen accumulation and energy levels. MBio 8: e01628-17.
18. Varik V, Oliveira SR, Hauryliuk V, Tenson T. 2016. Composition of the outgrowth medium modulates wake-up kinetics and ampi- cillin sensitivity of stringent and relaxed Escherichia coli. Sci. Rep.
6: 22308.
19. Boehm A, Arnoldini M, Bergmiller T, Roosli T, Bigosch C, Acker- mann M. 2016. Genetic manipulation of glycogen allocation affects replicative lifespan in E. coli. PLoS Gen. 12: e1005974.
20. Montero M, Rahimpour M, Viale AM, Almagro G, Eydallin G, Sevilla A. et al. 2014. Systematic production of inactivating and non-inactivating suppressor mutations at the relA locus that compensate the detrimental effects of complete spot loss and affect glycogen content in Escherichia coli. PLoS One 9: e106938.
21. Yamamotoya T, Dose H, Tian Z, Faure A, Toya Y, Honma M. et al.
2012. Glycogen is the primary source of glucose during the lag phase of E. coli proliferation. Biochim. Biophys. Acta 1824: 1442- 1448.
22. Eydallin G, Montero M, Almagro G, Sesma MT, Viale AM, Munoz FJ. et al. 2010. Genome-wide screening of genes whose enhanced expression affects glycogen accumulation in Esche- richia coli. DNA Res. 17: 61-71.
23. Montero M, Eydallin G, Viale AM, Almagro G, Munoz FJ, Rahim- pour M. et al. 2009. Escherichia coli glycogen metabolism is con- trolled by the PhoP-PhoQ regulatory system at submillimolar environmental Mg2+ concentrations, and is highly intercon- nected with a wide variety of cellular processes. Biochem. J. 424:
129-141.
24. Eydallin G, Viale AM, Moran-Zorzano MT, Munoz FJ, Montero M, Baroja-Fernandez E. et al. 2007. Genome-wide screening of genes affecting glycogen metabolism in Escherichia coli K-12.
FEBS Lett. 581: 2947-2953.
25. Kozlov G, Elias D, Cygler M, Gehring K. 2004. Structure of GlgS from Escherichia coli suggests a role in protein-protein interac- tions. BMC Biol. 2: 10.
26. Dedhia NN, Hottiger T, Bailey JE. 1994. Overproduction of glyco- gen in Escherichia coli blocked in the acetate pathway improves cell growth. Biotechnol. Bioeng 44: 132-139.
27. Romeo T, Gong M, Liu MY, Brun-Zinkernagel AM. 1993. Identifica- tion and molecular characterization of csrA, a pleiotropic gene from Escherichia coli that affects glycogen biosynthesis, glucone- ogenesis, cell size, and surface properties. J. Bacteriol. 175: 4744- 4755.
28. Okita TW, Rodriguez RL, Preiss J. 1981. Biosynthesis of bacterial glycogen. Cloning of the glycogen biosynthetic enzyme struc- tural genes of Escherichia coli. J. Biol. Chem. 256: 6944-6952.
29. Alonso-Casajus N, Dauvillee D, Viale AM, Munoz FJ, Baroja-Fer- nandez E, Moran-Zorzano MT. et al. 2006. Glycogen phosphory- lase, the product of the glgP gene, catalyzes glycogen breakdown by removing glucose units from the nonreducing ends in Escherichia coli. J. Bacteriol. 188: 5266-5272.
30. Chen G, Strevett KA. 2003. Impact of carbon and nitrogen condi- tions on E-coli surface thermodynamics. Colloids Surf. B Biointer- faces 28: 135-146.
31. Ariffin H, Hassan MA, Shah UKM, Abdullah N, Ghazali FM, Shirai Y.
2008. Production of bacterial endoglucanase from pretreated oil palm empty fruit bunch by Bacillus pumilus EB3. J. Biosci. Bioeng.
106: 231-236.
32. Mittal N, Budrene EO, Brenner MP, Van Oudenaarden A. 2003.
Motility of Escherichia coli cells in clusters formed by chemotactic aggregation. Proc. Natl. Acad. Sci. USA 100: 13259-13263.
33. Lo Leggio L, Ernst HA, Hilden I, Larsen S. 2002. A structural model for the N-terminal N1 module of E-coli glycogen branching enzyme. Biologia 57: 109-118.
34. Hilden I, Leggio LL, Larsen S, Poulsen P. 2000. Characterization and crystallization of an active N-terminally truncated form of the Escherichia coli glycogen branching enzyme. Eur. J. Biochem.
267: 2150-2155.
35. Datsenko KA, Wanner BL. 2000. One-step inactivation of chro- mosomal genes in Escherichia coli K-12 using PCR products. Proc.
Natl. Acad. Sci. USA 97: 6640-6645.