Received: December 16, 2019 Revised: February 4, 2021 Accepted: March 15, 2021
Address for Correspondence: Sandip Kumar, Department of Community Medicine, Uttar Pradesh University of Medical Sciences, Saifai, Etawah 206130, Uttar Pradesh, India
Tel: 91-9451268040, E-mail: [email protected], ORCID: https://orcid.org/0000-0001-6836-7907
ORIGINAL ARTICLE
INTRODUCTION
Today, with increasing life expectancy, women spend one-third of their lifetime after menopause [1]. There were about 43 million women of menopausal age group in India in the year 2011 and by 2026, it is projected to be 103 million. The average life span of Indian women has also increased to 71 years (68.7 years in rural and 73.5 years in urban areas) [2,3].
Menopause is a retrospective diagnosis, which is said to have occurred when there is absence of menstrual periods for 12 months. The average age of menopause in Indian women is 47.5 years [2]. The hypoestrogenic state heralded by the onset of menopause affects vari-
ous organ systems of the body. These effects can be classified with respect to the time since menopause as, immediate (vasomotor symptoms, mood swings, insomnia, urinary symptoms, cognitive dysfunction and sexual dysfunction), intermediate (genital atrophy, skin changes, urodynamic effects and pelvic organ pro- lapsed) and long-term (cardiovascular effects, osteopo- rosis and dementia) [4].
After menopause, there is more vulnerability to dis- ease in oestrogen-responsive tissues like bone, brain and cardiovascular system. Bone mass is lost at the rate of 2%–5% in post-menopausal women every year, thus putting these women at an augmented risk for fracture due to osteoporosis [5]. Redistribution of body
Morbidity Patterns among Menopausal Women in Rural Uttar Pradesh, India: A Cross-Sectional Study
Debora J. Mathew1, Sandip Kumar1, Pankaj Kumar Jain1, Dhiraj Kumar Srivastava1, Vaibhav Singh1, Kiran Krishnappa2
1Department of Community Medicine, Uttar Pradesh University of Medical Sciences, Saifai, Etawah, India, 2National Tuberculosis Prevalence Survey, ICMR-NIRTH (Indian Council of Medical Research-National Institute of Research in Tribal Health), Jabalpur, India
Objectives: The quality of life declines gradually as women enter menopause, owing to the various problems associated with estrogen deficiency and aging, which adds to their morbidities. This study aimed to investigate the patterns of morbidity among rural menopausal women and compare the morbidity patterns among menopausal transition group and post-menopausal women.
Methods: This community-based cross-sectional study included menopausal women aged 45–55 years from rural areas of the Etawah district, Uttar Pradesh, India. To select blocks and villages of the district, multistage random sampling was performed. According to a pretested, semistructured schedule, data were collected through interviews.
Results: A total of 315 women participated in the study. The most frequent complaints among the participants were of feeling tired and worn out (85.1%) and of muscle and joint pains (67.6%). Poor memory (P = 0.046) and diabetes (P = 0.024) were more common in women who were in the menopause transition phase than in those who were in the postmenopausal phase.
Conclusions: This study showed that majority of the menopausal women suffered from physical problems. Lifestyle modification and awareness programs will be beneficial among women in menopausal transition, to reduce the morbidity later in post-menopausal stage.
Behaviour change communication, family and community support are essential in post-menopausal women, to help them cope with various morbid conditions.
Key Words: Community, India, Menopause, Morbidity, Postmenopause
weight and weight gain occurs in most women during this time, leading to obesity and metabolic syndrome [6]. The estimates of Global Burden of Disease Study (1990–2016) show that cardiovascular deaths account for 26.7% of total deaths in Indian women, while the crude prevalence of high blood pressure was 21.2%, high total cholesterol, 24.5% and high fasting plasma glucose, 7% [7]. In a previous study, it was observed that women of rural areas experienced more of physi- cal, genitourinary and psychological problems than their urban counterparts, but less of non-communi- cable diseases (hypertension, diabetes mellitus and cardiac problem) [8]. As majority of the population of India live in rural areas (68.84%) [9] and women in ru- ral areas face more gender bias and hence seldom come out with their complaints. They are also reluctant to discuss issues on reproductive and sexual problems [2].
As only few studies were available exploring this topic, this study was conducted with the aim of studying the morbidity pattern of rural menopausal women and compare the morbidity patterns among menopausal transition group and post-menopausal women.
MATERIALS AND METHODS
This community-based cross-sectional study was conducted on menopausal women of 45–55 years of age from rural areas of Etawah district, Uttar Pradesh, India, from August 2018 to July 2019. The total popu- lation of Etawah District was 1,581,810 according to census 2011. The rural population was 1,215,511, of which there were 5,62,771 females [10]. According to Sample Registration System data, roughly 13.3% of the total women are of the age group 45–59 years [11]. The minimum sample size of 262 was calculated, consid- ering the prevalence of joint pains causing morbidity among menopausal women as estimated by Goyal et al.
[8] as 57%, at 5% level of significance and absolute al- lowable error of 6%. Multistage random sampling was done for selecting blocks and villages. Of the 8 blocks in District Etawah, the two blocks of Saifai and Jaswant Nagar were selected randomly by lottery method. All the villages of both the blocks were listed and four vil- lages were selected randomly from each block by cur- rency note method. The total female population of the eight selected villages was 8,458, of which 1,015 were expected to be of the age group of 45–64 years [10]. As the present study included only menopausal women of 45–55 years age group, and as many women of the rural
community go for work in the fields during the morn- ing hours, all menopausal women of 45–55 years who were available at the time of study in the above villages and who gave informed written consent to partici- pate in the study were included. Menopausal women included women in menopause transition and post- menopausal women. Menopause transition is defined as irregular menstrual cycles, that is, either interval be- tween cycles may be altered by 7 or more days, or two or more skipped cycles and at least one inter-menstrual interval of 60 days or more [12]. Post-menopausal pe- riod is defined as the absence of menstrual periods for the past 12 months or more. Women receiving any kind of hormone therapy or had undergone hysterectomy were excluded.
A predesigned, pretested schedule was used to inter- view the participants through house to house surveys.
The schedule contained background details of the par- ticipant, socio-demographic profile, relevant history of the participant (including gynecological history, marital and obstetric history, personal and treatment history) and morbidity profile. The whole schedule was trans- lated into the local language (Hindi), so that uniformity of the questions was maintained by the interviewer for all participants.
A pilot study was conducted prior to starting of the study on 15 participants in a village of Saifai block other than study area, after finalizing the methodology and study tools, and necessary changes were incorpo- rated in the schedule. Ethical clearance was obtained from the Ethics Committee of Uttar Pradesh University of Medical Sciences (approval No. 40/2018).
Data were entered in Microsoft Excel 2015 (Microsoft, Redmond, WA, USA) and analysis was done using the IBM SPSS Statistics software (ver. 24.0; IBM, Armonk, NY, USA) for Windows. Types of data collected were categorical as well as continuous data. Categorical vari- ables were assessed using chi-square test and Fisher ex- act test. The strength of association between variables was established by binary and multivariate logistic regression using odds ratio (OR). Level of significance was established at 5% and considered statistically sig- nificant when P < 0.05.
RESULTS
A total of 315 women who fulfilled the inclusion and exclusion criteria were included in the study. The mean age of the study population was 49.75 ± 3.41 years and
the mean age of menopause was 45.02 ± 3.51 years.
Most of the participants were post-menopausal (n = 266, 84.4%), while 49 (15.6%) belonged to menopause transition group.
The socio-demographic and other characteristics of the participants are shown in Table 1. Majority of the respondents belonged to the age group of 50–55 years (54.0%), were Hindu by religion (95.9%), illiter- ate (56.2%), housewives (58.4%) or manual laborers (37.1%), belonging to lower (36.8%) socio-economic class (Socio-economic classification was according to Modified B. G. Prasad classification, taking All India Consumer Price Index of June 2019 as 316) [13]. Most of the study subjects were married (83.8%) or living in joint families (57.8%). In the study population, 7.9%
(n = 25) were smokers; around 23.8% (n = 75) had 1–3 children, while majority (75.2%, n = 237) had parity ≥ 4 and 3 were nulliparous.
The distribution of morbidity pattern among the par- ticipants is shown in Table 2. The most frequent prob- lems among the study population were that of physical complaints of feeling tired and worn out (85.1%) and muscle and joint pains (67.6%), while poor memory was complained of by (54.3%) participants. Around 33.0% women complained of vasomotor symptoms and 32.4% had psychosocial symptoms like feeling depressed or sad. Genitourinary complaints like uri- nary incontinence and vaginal dryness were present in around 17.1% and 18.7% participants, respectively.
Table 1. Socio-demographic and other characteristics of study participants
Characteristic Value
Age group
45–50 y 145 (46.0)
50–55 y 170 (54.0)
Religion
Hindu 302 (95.9)
Muslim 13 (4.1)
Education
Illiterate 177 (56.2)
Literate 138 (43.8)
Occupation
Housewife 184 (58.4)
Manual laborer 117 (37.1)
Semiskilled/skilled worker/shopkeeper 14 (4.4) Socio-economic status
Upper 12 (3.8)
Upper middle 41 (13.0)
Middle 37 (11.7)
Lower middle 109 (34.6)
Lower 116 (36.8)
Marital status
Married 264 (83.8)
Divorced/separated 3 (1.0)
Widowed 48 (15.2)
Type of family
Nuclear 115 (36.5)
Joint 182 (57.8)
Three-generation 18 (5.7)
Exercise
Yes 172 (54.6)
No 143 (45.4)
Current menstrual status
Menopause transition 49 (15.6)
Post-menopausal 266 (84.4)
Mean age of study population (y) 49.75 ± 3.41
Mean age of menopause (y) 45.02 ± 3.51
Data are presented as number (%) or mean ± standard deviation.
Table 2. Distribution of morbidity pattern among study subjects (n = 315)
Morbidity n (%)
Hypertension 52 (16.5)
Diabetes 16 (5.1)
Bronchial asthma 27 (8.6)
Heart attack 4 (1.3)
Cataract 40 (12.7)
Decreased hearing 21 (6.7)
Difficulty in sleeping 89 (28.3)
Constipation 32 (10.2)
Poor memory 171 (54.3)
Stress urinary incontinence 54 (17.1)
Vaginal dryness 59 (18.7)
Heart burn/acidity 103 (32.7)
Muscle and joint pains 213 (67.6) Feeling tired or worn out 268 (85.1)
Low backache 157 (49.8)
Falls and fractures 15 (4.8)
Depressed or sad 102 (32.4)
Vasomotor symptoms 104 (33.0)
Non-communicable diseases like hypertension and diabetes were seen in 16.5% and 5.1% respectively. Four participants had history of heart attack. Other problems like cataract (12.7%), constipation (10.2%), and hearing difficulty (6.7%) were present in fewer participants.
Association of some morbidity patterns and par- ticipant characteristics among menopausal transition group and post-menopausal women are shown respec- tively in Tables 3 and 4. Among women in menopausal transition (n = 49), feeling of being depressed was reported more in women belonging to lower socio- economic class (58.8%, P = 0.007); women with parity
≥ 4 (64.1%) had more complaints of low backaches (P = 0.029; OR 7.14, 95% confidence interval [CI]
1.33–38.40), but significant association was not present in multivariate analysis (OR 5.82, 95% CI 0.95–35.55) (Table 5).
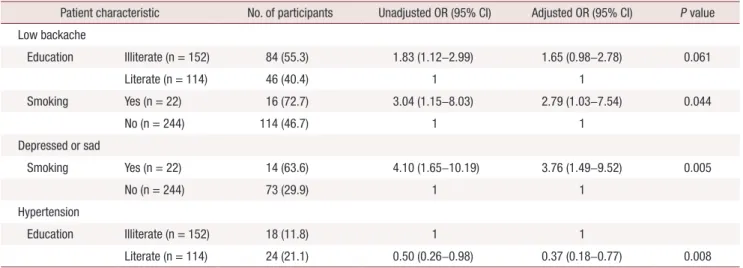
Among the post-menopausal women, low backache was reported more among those who were illiterate (55.3%, P = 0.016), and in those who smoked (72.7%, P = 0.019). In multivariate analysis, significant associa- tion with low backache was found only among those who smoked (OR 2.79, 95% CI 1.03–7.54) (Table 6).
The feeling of being depressed or sad was also seen
more among smokers (63.6%, P = 0.001), which was also significant in multivariate analysis (OR 3.76, 95%
CI 1.49–9.52). Hypertension was also reported more among those who were literate (21.1%, P = 0.041), which was significant in multivariate analysis as well (OR 0.37, 95% CI 0.18–0.77, P = 0.008).
Participants who were in the menopause transi- tion phase had higher proportion of those with poor memory (P = 0.046) and diabetes (P = 0.024) than post-menopausal women (Table 7). Participants who were in menopause transition were almost twice more likely to experience complaints of poor memory than post-menopausal women (unadjusted OR 1.91, 95% CI 1.01–3.64). Similarly, women of menopause transition were three times more likely to have diabetes mellitus as compared to post-menopausal women (unadjusted OR 3.57, 95% CI 1.24–10.34). No association was ob- served between depression or vasomotor symptoms with menstrual status.
DISCUSSION
The mean age of menopause (45.02 ± 3.51 years) was found to be lesser than that of Singh and Pradhan (46.24 Table 3. Factors affecting morbidity pattern of women in menopausal transition (n = 49)
Participant characteristic
Morbid condition Feeling tired/worn out
(n = 44)
Low back ache (n = 27)
Depressed or sad (n = 15)
Hypertension (n = 10)
Education Illiterate (n = 25) 22 (88.0) 16 (64.0) 8 (32.0) 5 (20.0)
Literate (n = 24) 22 (91.7) 11 (45.8) 7 (29.2) 5 (20.8)
P value > 0.999 0.201 0.830 > 0.999
Socio-economic status Upper (n = 2) 2 (100) 1 (50.0) 0 (0) 1 (50.0)
Middle (n = 30) 26 (86.7) 13 (43.3) 5 (16.7) 3 (10.0)
Lower (n = 17) 16 (94.1) 13 (76.5) 10 (58.8) 6 (35.3)
P value 0.639 0.089 0.007* 0.067
Exercise Yes (n = 27) 25 (92.6) 16 (59.3) 10 (37.0) 4 (14.8)
No (n = 22) 19 (86.4) 11 (50.0) 5 (22.7) 6 (27.3)
P value 0.646 0.517 0.280 0.311
Smoking Yes (n = 3) 3 (100) 2 (66.7) 0 (0) 1 (33.3)
No (n = 46) 41 (89.1) 25 (54.3) 15 (32.6) 9 (19.6)
P value > 0.999 > 0.999 0.543 0.504
Parity 1–3 (n = 10) 10 (100) 2 (20.0) 2 (20.0) 1 (10.0)
≥ 4 (n = 39) 34 (87.2) 25 (64.1) 13 (33.3) 9 (23.1)
P value 0.569 0.029* 0.702 0.663
P values by chi-square or Fisher exact test was used to test the association.
*P < 0.05.
Table 4. Factors affecting morbidity pattern of post-menopausal women (n = 266) Participant characteristic
Morbid condition Feeling tired/worn out
(n = 224) Low back ache
(n = 130) Depressed or sad
(n = 87) Hypertension
(n = 42)
Education Illiterate (n = 152) 133 (87.5) 84 (55.3) 54 (35.5) 18 (11.8)
Literate (n = 114) 91 (79.8) 46 (40.4) 33 (28.9) 24 (21.1)
P value 0.089 0.016* 0.258 0.041*
Socio-economic status Upper (n = 10) 8 (80.0) 4 (40.0) 3 (30.0) 0 (0)
Middle (n = 157) 134 (85.4) 77 (49.0) 50 (31.8) 26 (16.6)
Lower (n = 99) 82 (82.8) 49 (49.5) 34(34.3) 16 (16.2)
P value 0.807 0.847 0.902 0.376
Exercise Yes (n = 145) 119 (82.1) 64 (44.1) 49 (33.8) 22 (15.2)
No (n = 121) 105 (86.8) 66 (54.5) 38 (31.4) 20 (16.5)
P value 0.294 0.091 0.696 0.763
Smoking Yes (n = 22) 21 (95.5) 16 (72.7) 14 (63.6) 6 (27.3)
No (n = 244) 203 (83.2) 114 (46.7) 73 (29.9) 36 (14.8)
P value 0.218 0.019* 0.001* 0.131
Paritya 1–3 (n = 65) 54 (83.1) 29 (44.6) 22 (33.8) 10 (15.4)
≥ 4 (n= 198) 167 (84.3) 99 (50.0) 65 (32.8) 31 (15.7)
P value 0.809 0.451 0.880 0.958
P values by chi-square or Fisher exact test was used to test the association.
*P < 0.05.
a3 post-menopausal women were nulliparous, out of which 2 had low backache and 1 was hypertensive.
Table 5. Multivariate analysis of factor affecting low backache among women in menopausal transition (n = 49)
Patient characteristic Low backache Unadjusted OR (95% CI) Adjusted OR (95% CI) P value
Parity 1–3 (n = 10) 2 (20.0) 1 1
≥ 4 (n = 39) 25 (64.1) 7.14 (1.33–38.40) 5.82 (0.95–35.55) 0.056
OR: odds ratio, CI: confidence interval.
Table 6. Multivariate analysis of factors affecting various morbidity patterns among post-menopausal women (n = 266)
Patient characteristic No. of participants Unadjusted OR (95% CI) Adjusted OR (95% CI) P value Low backache
Education Illiterate (n = 152) 84 (55.3) 1.83 (1.12–2.99) 1.65 (0.98–2.78) 0.061
Literate (n = 114) 46 (40.4) 1 1
Smoking Yes (n = 22) 16 (72.7) 3.04 (1.15–8.03) 2.79 (1.03–7.54) 0.044
No (n = 244) 114 (46.7) 1 1
Depressed or sad
Smoking Yes (n = 22) 14 (63.6) 4.10 (1.65–10.19) 3.76 (1.49–9.52) 0.005
No (n = 244) 73 (29.9) 1 1
Hypertension
Education Illiterate (n = 152) 18 (11.8) 1 1
Literate (n = 114) 24 (21.1) 0.50 (0.26–0.98) 0.37 (0.18–0.77) 0.008
OR: odds ratio, CI: confidence interval.
± 3.38 years) [14]. Ahuja [15] reported in their PAN India study that the overall age of natural menopause was 46.2 ± 4.9 years, though the region-wise determi- nation of menopausal age of the northern India (45.5 ± 4.9 years) was comparable with the current study. The slightly lower age of menopause among the study par- ticipants might be influenced by the interplay of vari- ous factors like diet, exercise, parity, socio-economic status, though significant relation was not observed in the current study [12].
The physical problems contributing to morbidity showed a similar pattern but was of lesser magnitude than that observed by Karmakar et al. [16], who re- ported that 93% participants had felt tired or worn out, 84% had muscle and joint pains and 69% had low back ache. The prevalence of poor memory (57%) was similar, while that of feeling depressed or down (88%) was higher than the present study. The prevalence of symptoms among rural women in the study conducted by Sagdeo and Arora [17], was comparable to the pres- ent study. Vasomotor symptoms were present in 37.6%
women, while sleeping difficulties were seen in 27.2%
in their study.
Goyal et al. [8] observed in their study that visual problems were the most common of all symptoms in rural area (93.5%), which was much higher than that of the present study; this might be due to consideration of problems other than cataract, like dry eyes, hyper- metropia, etc. The prevalence of joint pains (57%), hypertension (19%), hearing loss (7.5%), and heart attack (1%) were comparable to the current study; the occurrence of hip fractures (10.5%) was higher than the current study; this might be due to the inclusion of women with higher age groups also in their study. Rah- man et al. [18] estimated a similar prevalence in most symptoms of the menopausal quality of life, with feel-
ing of tiredness at 92.9%, joint and muscular discom- fort at 76.2%, and sleeplessness at 54.4%. Nath et al. [19]
reported a slightly higher prevalence of vaginal dryness (26.5%) and urinary incontinence (21.5%) than the current study, which might be due to higher mean age of the subjects and regional differences in their study.
Poor memory associated with menopause transition might be due to the hypoestrogenic state on estrogen receptors of central nervous system [4]. Mohamed et al.
[20] recorded that poor memory was associated with the post-menopausal group, which was contrary to the current study, which might be due to the higher age group of participants involved. The higher prevalence of diabetes among menopause transition group might be due to sedentary lifestyle, stress, lack of exercise and gain in weight, though significant relation was not found between any of these.
In the present study, women in menopausal transition who experienced being depressed or sad were mostly of lower socio-economic status, while those in post- menopausal group were smokers. Similar association were reported by Ahlawat et al. [21] and Wang et al.
[22].
The current study showed that low backache in meno- pausal transition group was associated with higher par- ity and in post-menopausal group was associated with low education and history of smoking, which was simi- lar to the observations of Ahdhi et al. [23]. The present study showed that hypertension was more common in those who were better educated, probably due to less physical activity among them.
The strength of this study was that it helped better un- derstand the problems of menopausal women of a rural part of India, where these problems are often neglected and they seldom approach health care for these com- plaints. So, this can help in making better informed de- Table 7. Association of various morbid conditions with current menstrual status
Presence of morbid condition
Current menstrual status
Total
(n = 315) χ2 P value OR (95% CI) P value
Menopause transition
(n = 49) Post-menopause (n = 266)
Poor memory 33 (67.3) 138 (51.9) 171 (54.3) 3.99 0.046 1.91 (1.01–3.64) 0.048
Diabetes 6 (12.2) 10 (3.8) 16 (5.1) 0.024a 3.57 (1.24–10.34) 0.019
Depressed or sad 15 (30.6) 87 (32.7) 102 (32.4) 0.08 0.773 0.91 (0.47–1.76) 0.773
Vasomotor symptoms 15 (30.6) 89 (33.5) 104 (33.0) 0.15 0.697 0.88 (0.45–1.70) 0.697
Data are presented as number (%).
OR: odds ratio, CI: confidence interval.
aFisher exact test used.
cisions to increase their quality of life and thus decrease the burden of disease in the community. The weak- nesses of this study were that as it was a cross-sectional study, the participants were seen only at a point of time, which could have underestimated or overestimated their true problem. The participants could have exag- gerated their problem in order to get the attention or help from the health care worker interviewing them, thus could introduce bias in the study.
In conclusion, this study showed that majority of the menopausal women suffered from physical problems.
Lifestyle modification and awareness programs will be beneficial among women in menopausal transition, to reduce the morbidity later in post-menopausal stage.
Behaviour change communication, family and commu- nity support are essential in post-menopausal women, to help them cope with various morbid conditions.
Proper attention to these problems can ensure healthy ageing and thus reduce the burden of disease in the community.
Limitation of the study
As women were asked to recall symptoms within the past one month, it could have led to a possibility of re- call bias.
ACKNOWLEDGMENTS
The authors sincerely thank all the participants for their co-operation and responses.
CONFLICT OF INTEREST
No potential conflict of interest relevant to this article was reported.
REFERENCES
1. Gibbs RS, Danforth DN. Danforth’s obstetrics and gynecology.
10th ed. Philadelphia: Lippincott Williams & Wilkins; 2008. pp.
396-400.
2. Unni J. Third consensus meeting of Indian Menopause Society (2008): a summary. J Midlife Health 2010; 1: 43-7.
3. Ministry of Health & Family Welfare. National Health Profile (NHP) of India- 2017. 13th issue. New Delhi: Ministry of Health
& Family Welfare; 2017.
4. Seshadri L. Essentials of gynaecology. New Delhi: Lippincott Wil- liams & Wilkins; 2011. pp. 262-6.
5. Meeta, Digumarti L, Agarwal N, Vaze N, Shah R, Malik S. Clini-
cal practice guidelines on menopause: an executive summary and recommendations. J Midlife Health 2013; 4: 77-106.
6. Patni R, Mahajan A. The metabolic syndrome and menopause. J Midlife Health 2018; 9: 111-2.
7. India State-Level Disease Burden Initiative CVD Collaborators.
The changing patterns of cardiovascular diseases and their risk factors in the states of India: the Global Burden of Disease Study 1990-2016. Lancet Glob Health 2018; 6: e1339-51.
8. Goyal A, Mishra N, Dwivedi S. A comparative study of morbidity pattern among rural and urban postmenopausal women of Alla- habad, Uttar Pradesh, India. Int J Res Med Sci 2017; 5: 670-7.
9. Ministry of Home Affairs. Census of India 2011. Rural urban dis- tribution of population (provisional population totals). New Delhi:
Ministry of Home Affairs; 2011.
10. Directorate of Census Operations. Census of India 2011. District census handbook Etawah. Lucknow: Directorate of Census Op- erations; 2011. p. 17.
11. Ministry of Statistics and Programme Implementation. Women men in India-2017. New Delhi: Ministry of Statistics and Pro- gramme Implementation; 2017.
12. Hoffman BL, Schorge JO, Bradshaw KD, Halvorson LM, Schaffer JI, Corton MM. Williams gynecology. 3rd ed. New York: McGraw- Hill Education; 2016. p. 471.
13. Labour Bureau. Press release. Labour Bureau, 2019 [cited 2019 Oct 30]. Available from: http://labourbureau.gov.in/LBO_Press_
Release.htm.
14. Singh A, Pradhan SK. Menopausal symptoms of postmenopausal women in a rural community of Delhi, India: a cross-sectional study. J Midlife Health 2014; 5: 62-7.
15. Ahuja M. Age of menopause and determinants of menopause age:
a PAN India survey by IMS. J Midlife Health 2016; 7: 126-31.
16. Karmakar N, Majumdar S, Dasgupta A, Das S. Quality of life among menopausal women: a community-based study in a rural area of West Bengal. J Midlife Health 2017; 8: 21-7.
17. Sagdeo MM, Arora D. Menopausal symptoms: a comparative study in rural and urban women. JK Science 2011; 13: 23-6.
18. Rahman S, Salehin F, Iqbal A. Menopausal symptoms assessment among middle age women in Kushtia, Bangladesh. BMC Res Notes 2011; 4: 188.
19. Nath A, Ahmed SJ, Saikia H, Sharma UK. Urogenital problems of postmenopausal women: a community based study in slums of Dibrugarh town. Int J Contemp Med Res 2016; 3: 2953-6.
20. Mohamed HAE, Lamadah SM, Zamil LGA. Quality of life among menopausal women. Int J Reprod Contracept Obstet Gynecol 2014; 3: 552-61.
21. Ahlawat P, Singh MM, Garg S, Mala YM. Prevalence of depression and its association with sociodemographic factors in postmeno- pausal women in an urban resettlement colony of Delhi. J Midlife Health 2019; 10: 33-6.
22. Wang HL, Booth-LaForce C, Tang SM, Wu WR, Chen CH. De- pressive symptoms in Taiwanese women during the peri- and post-menopause years: associations with demographic, health, and psychosocial characteristics. Maturitas 2013; 75: 355-60.
23. Ahdhi GS, Subramanian R, Saya GK, Yamuna TV. Prevalence of low back pain and its relation to quality of life and disability among women in rural area of Puducherry, India. Indian J Pain 2016; 30: 111-5.