INTRODUCTION
Scoring systems have been continuously developed to pre- dict outcomes in patients with severe illness, to improve re- source allocation and to assist in clinical decision-making particularly for intensive care unit (ICU) patients (1-3). Acute physiology and chronic health evaluation II (APACHE II) (4) and simplified acute physiology score II (SAPS II) (5) are two representative systems currently in wide use for measur- ing the condition of individual ICU patients (6, 7).
In these systems, the reliability of an outcome prediction in a given population depends on the case mix of that popu- lation because the underlying disease category has an indepen- dent role in hospital stay outcomes in critically ill patients (4, 7). However, these systems have not always proven valid in specific patient populations such as those with septicemia (7), HIV positive serum (8, 9), Pneumocystis carinii pneumo- nia (10), cardiac diseases (11) or neoplastic diseases (12, 13).
Patients who are admitted to the neurosurgical ICU (NICU) are likely in many instances to have higher mortality despite multimodal intensive management, regardless of their neu- rosurgical diagnosis. There have been some reports on the effi-
cacy of SAPS II in predicting the outcome for patients with subarachnoid hemorrhage (SAH) and on APACHE II in trau- matic brain injury (TBI) (14-16).
The purpose of this study is therefore twofold: first, to com- pare the discriminating capability of APACHE II and SAPS II score to predict mortality in a group of NICU patients; and second, to assess the applicability of APACHE II and SAPS II scores in two specific disease categories, SAH and TBI. In doing so, the impact of systemic or extracerebral organ dys- function on the outcome of acutely ill NICU patients will be better defined and future direction identified.
MATERIALS AND METHODS Study population
Records of 705 consecutive patients who were admitted to NICU from July 2003 through June 2005 were retrospective- ly examined, and 672 of these were included in this study.
Thirty-three patients were excluded because of a chronic mori- bund state at admission (n=9) or incomplete data gathering
420
Sang-Kyu Park1, Hyoung-Joon Chun2, Dong-Won Kim3, Tai-Ho Im4,
Hyun-Jong Hong2, and Hyeong-Joong Yi2
Department of Neurosurgery1, Ajou University Hospital, Suwon; Departments of Neurosurgery2, Anesthesia and Pain Medicine3, and Emergency Medicine4, Hanyang University Medical Center, Seoul, Korea
Address for correspondence Hyeong-Joong Yi, M.D.
Department of Neurosurgery, Hanyang University Medical Center, 17 Haengdang-dong, Seongdong-gu, Seoul 133-792, Korea Tel : +82.2-2290-8499, Fax : +82.2-2281-0954 E-mail : [email protected]
DOI: 10.3346/jkms.2009.24.3.420
Acute Physiology and Chronic Health Evaluation II and Simplified Acute Physiology Score II in Predicting Hospital Mortality of Neurosurgical Intensive Care Unit Patients
We study the predictive power of Acute Physiology and Chronic Health Evaluation II (APACHE II) and Simplified Acute Physiology Score II (SAPS II) in neurosurgical intensive care unit (ICU) patients. Retrospective investigation was conducted on 672 consecutive ICU patients during the last 2 yr. Data were collected during the first 24 hours of admission and analyzed to calculate predicted mortality. Mortality predicted by two systems was compared and, multivariate analyses were then per- formed for subarachnoid hemorrhage (SAH) and traumatic brain injury (TBI) patients.
Observed mortality was 24.8% whereas predicted mortalities were 37.7% and 38.4%, according to APACHE II and SAPS II. Calibration curve was close to the line of per- fect prediction. SAPS II was not statistically significant according to a Lemeshow- Hosmer test, but slightly favored by area under the curve (AUC). In SAH patients, SAPS II was an independent predictor for mortality. In TBI patients, both systems had independent prognostic implications. Scoring systems are useful in predicting mortality and measuring performance in neurosurgical ICU setting. TBI patients are more affected by systemic insults than SAH patients, and this discrepancy of pre- dicting mortality in each neurosurgical disease prompts us to develop a more spe- cific scoring system targeted to cerebral dysfunction.
Key Words : APACHE; Intensive Care Units; Mortality; Simplified Acute Physiologic Score; Subarachnoid Hemorrhage; Brain Injuries
Received : 13 April 2008 Accepted : 25 July 2008
(n=24). According to the International Classification of Dis- ease, 10th ed. (ICD-10), the main reason for admission was diagnosis of neurosurgical disease at the time of hospital dis- charge. For patients admitted to the ICU more than once dur- ing a hospitalization episode, only data from the first admis- sion were used.
Data collection
This retrospective study involved a careful review of all med- ical charts including laboratory results. Patient data observed during the first 24 hr of the hospital stay was collected to obtain following variables: neurosurgical diagnosis, temper- ature (℃), systolic and mean arterial blood pressure (mmHg), heart rate, respiratory rate, PaO2or FiO2(mmHg), arterial pH and bicarbonate, serum sodium, potassium, urea and cre- atinine, urine output, serum white blood cell count, hemat- ocrit, platelet count and bilirubin, age, type of admission, Glas- gow Coma Scale (GCS) score, presence of chronic diseases (chronic organ insufficiency) or immuno-compromised state.
When a patient died within the first 24 hr of admission, we selected the most perturbed value of each variable during the period between admission and death (4, 5).
For all patients, APACHE II and SAPS II scores were cal- culated as described in the original literatures, as was the risk of death according to the published logistic equations (4, 5).
The associated risks of hospital mortality were derived using data from each patient’s ICU stay and predictive equations of the respective scoring system. Severe chronic illnesses in- cluded cirrhosis, New York Heart Association class IV heart failure, chronic respiratory failure, end-stage renal disease, and immuno-suppression. Hospital mortality was defined as the number of patients who died during hospital stay, in- cluding deaths in ICU.
Statistical analysis
Continuous variables were expressed as mean±standard deviation (SD) and were compared using Standard t-test. Cat- egorical values were expressed in absolute and relative fre- quencies, and were analyzed using chi-square test with com- mercially available statistical software (SPSS Ver. 10, Chica- go, IL, U.S.A.). All variables with a P value >0.05 were ex- cluded from the final models. Predicted mortality was cal- culated using logistic regression formulae described in the original articles (4, 5). Standardized mortality ratio (SMR) was obtained by dividing observed mortality by predicted mortality. The 95% confidence interval (CI) for SMR was calculated using observed mortality as a Poisson variable, and dividing its 95% CI by the predicted mortality (17).
Comparison of the two scoring systems for goodness-of-fit and prediction ability was performed by various methods.
Calibration (the ability to provide a risk estimate correspond- ing to observed mortality) was assessed using calibration
curves (2) and chi-square statistics as proposed by Lemeshow- Hosmer to test the goodness of fit of the model (18). A receiv- er operating characteristic (ROC) curve was built for each severity index, and area under the ROC curve (AUC) (19) was used to test the ability of the models to discriminate bet- ween patients who survived or patients who did not.
For patients with SAH and TBI, we related hospital death to baseline characteristics and SAPS II and APACHE II scores during the first 24 hr after admission using a logistic re- gression model that yielded a crude odds ratio (OR). Multi- variate analyses were then calculated using a forward selec- tion method. By using AUC of the corresponding ROC, dis- criminating power was also evaluated. Finally, analyses of in- dividual elements of SAPS II and APACHE II values were entered in a multivariate logistic regression model with a forward selection method. Variables with a P value >0.10 were excluded.
RESULTS
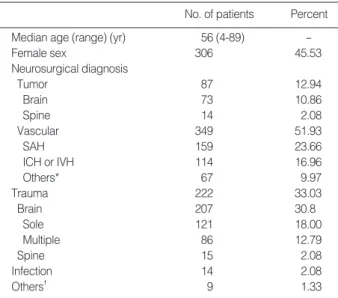
The main features of the study population are shown in Table 1. There were 207 patients with TBI and 159 patients with SAH.
Predicted mortality
Observed mortality during hospital stay was 24.8% (167/
672) and that during ICU stay was 21.4% (144/672). Mean APACHE II and SAPS II values were 37.74% (range: 2-39)
*Includes ischemia or infarction (n=41), vascular malformation (n=17), and otherwise unspecified intracranial bleeding (n=9). �Includes congeni- tal anomaly (n=6), and demyelinating or degenerative disease (n=3).
SAH, subarachnoid hemorrhage; ICH, intracerebral hemorrhage; IVH, intraventricular hemorrhage.
No. of patients Percent
Median age (range) (yr) 56 (4-89) -
Female sex 306 45.53
Neurosurgical diagnosis
Tumor 87 12.94
Brain 73 10.86
Spine 14 2.08
Vascular 349 51.93
SAH 159 23.66
ICH or IVH 114 16.96
Others* 67 9.97
Trauma 222 33.03
Brain 207 30.8
Sole 121 18.00
Multiple 86 12.79
Spine 15 2.08
Infection 14 2.08
Others� 9 1.33
Table 1.Characteristics of 672 patients enrolled
and 38.39% (range: 15-90), respectively. Both systems were highly correlated (Bravais-Pearson correlation coefficient, 0.86, P<0.01). The mean predicted risk of death for the over- all patient population, survivors and non-survivors are listed in Table 2. There was no significant difference of SMR bet- ween the two predictive scoring systems (0.66 for APACHE II and 0.65 for SAPS II). Fig. 1 depicts the distributions of predicted risks for the two systems, both of were skewed to- ward low scores.
Calibration and discrimination
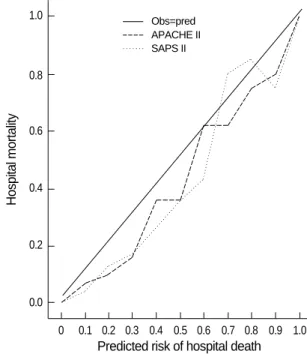
The calibration curves for APACHE II and SAPS II scores show that both were close to the line of perfect prediction (Fig. 2). Table 3 shows the number of predicted deaths in each scale and the number of observed deaths over probabil- ity intervals of 10%. Comparison (as proposed by Lemeshow- Hosmer) between the contingency tables using a homogene- ity chi-square test provides a very significant P value for the
APACHE II scoring systems (P<0.01) but not for SAPS II (P=0.07) (Table 4).
Discrimination was assessed by ROC curves. Comparison of the AUC revealed a slightly better fit in favor of SAPS II (area, 0.81 vs. 0.79 for APACHE II) (Fig. 3).
APACHE II, Acute physiology and chronic health evaluation II; SAPS II, simplified acute physiology score II.
All Survivors Non-survivors P value
Number 672 528 144
Age (yr) 56.12±15.42 51.56±13.40 58.22±15.87 0.26
Male/ 366/306 288/240 78/66 0.51
Female
APACHE II 34.74±21.74 20.12±14.59 41.48±21.20 <0.001 mortality (%)
SAPS II 38.39±29.73 16.36±16.44 48.56±29.00 <0.001 mortality (%)
Table 2.The mean predicted risk of death for all patients, for the survivors and for the non-survivors
No. of patients
250 200
150
100
50
5
0
<0.1 <0.2 <0.3 <0.4 <0.5 <0.6 <0.7 <0.8 <0.9 <1.0 Predicted risk of hospital death
Fig. 1.Grouped distributions of predicted risk of hospital death for APACHE II and SAPS II scores
APACHE II SAPS II
0 0.1 0.2 0.3 0.4 0.5 0.6 0.7 0.8 0.9 1.0 Predicted risk of hospital death
Fig. 2.Comparison of the calibration curves for APACHE II and SA- PS II scores for hospital mortality prediction.
Obs=pred APACHE II SAPS II
Hospital mortality
1.0
0.8
0.6
0.4
0.2
0.0
Lemeshow-Hosmer chi-square statistics were 46.16, P<0.01 for APACHE II and 13.09, P=0.07 for SAPS II.
APACHE II, Acute physiology and chronic health evaluation II; SAPS II, simplified acute physiology score II.
APACHE II SAPS II
Estimated probability
of death No. Expected Observed
No. Expected Observed
deaths death deaths death
0-0.1 174 13.3 6 241 15.1 17
0.1-0.2 156 21.8 20 221 29.8 22
0.2-0.3 164 40.5 28 38 9.7 6
0.3-0.4 71 22.9 18 37 13.1 13
0.4-0.5 64 29.3 23 25 11.3 9
0.5-0.6 28 15.4 13 26 14.6 18
0.6-0.7 15 9.3 12 29 18.3 16
0.7-0.8 20 14.7 17 20 15.0 15
0.8-0.9 8 6.7 6 25 21.6 20
0.9-1.0 1 0.9 1 8 7.5 8
Table 3.Evaluation of the goodness-of-fit of APACHE II and SAPS II models of hospital mortality*
Univariate and multivariate predictors for death in SAH patients
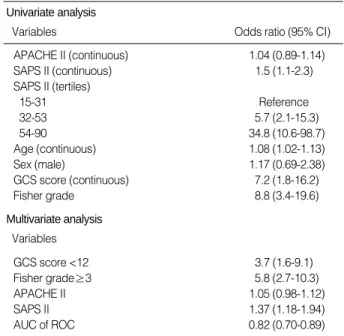
In univariate analysis, SAPS II, patients’ age, GCS score and Fisher grade showed predictive implications for hospital death, while APACHE II did not. Moreover, SAPS II had a
“dose-dependent” relationship to death such that higher scores suggested increased mortality. In APACHE II, only those of the above tertiles showed such relation with death. Multivari- ate analysis showed similar results, and the AUC was 0.82.
Although detailed analysis is not shown, systolic blood pres- sure, heart rate, PaO2/FiO2, serum potassium, age, and GCS scores were individual factors contributing to the univariate predictors for mortality in SAPS II. In multivariate analysis, systolic blood pressure, PaO2/FiO2, age, and GCS scores were independent predictors of mortality (Table 5).
Univariate and multivariate predictors for death in TBI patients
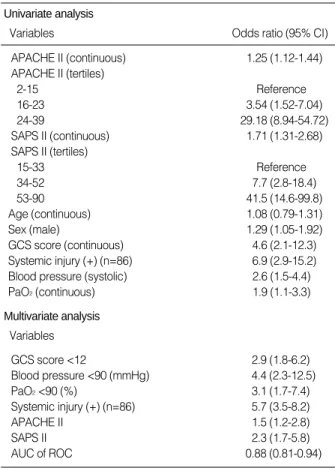
Univariate analysis showed that APACHE II, SAPS II, sex, GCS score, presence of systemic injury, systolic blood pressure, and PaO2were predictors for hospital mortality in TBI pa- tients. The main differences from SAH patients were a greater contribution of systemic factors and exclusion of patients’ ages.
Both SAPS II and APACHE II also showed a “dose-depen- dent” relationship to death, with higher scores indicating in- creasing mortality. Multivariate analysis showed similar results, and the AUC of 0.88 was more discriminating than for pati- ents with SAH. Systolic and mean arterial blood pressure, heart rate, PaO2or FiO2, arterial pH and bicarbonate, serum urea and creatinine, urine output, and GCS score were con- tributing factors for SAPS II and APAVHE II in univariate analysis. In multivariate analysis, independent prognostic fac-
*Using calibration curves, the ability to provide a risk estimate correspond- ing to observed mortality was assessed between two systems and it showed equal result. Using Lemeshow-Hosmer method, 2statistics was calculated to test the goodness of fit of the model between the con- tingency tables and it provided a very significant p-value for the APACHE II scoring system (P<0.01) but not for SAPS II (P=0.07). �Using AUC, the ability to discriminate between patients who survived and patients who did not was assessed. Comparison of the AUC revealed a slightly better fit in favor of SAPS II (area, 0.81 vs. 0.79 for APACHE II).
ICU, intensive care unit; APACHE II, Acute physiology and chronic health evaluation II; SAPS II, simplified acute physiology score II; ROC, receiver operating characteristic curve.
ICU mortality Mortality
APACHE II predicted, 34.74% Observed, 21.4%
SAPS II predicted, 38.39%
Goodness-of-fit*
Calibration curves APACHE II≒SAPS II Lemeshow-Hosmer method APACHE II (P<0.01) > SAPS II
(P=0.07) Discrimination�
Area under the ROC curve APACHE II (0.79) < SAPS II (0.81)
Prognostic factor analysis APACHE II = SAPS II (P<0.01) Table 4.Comparison of the scoring systems performances to pre- dict ICU and hospital mortality
SAH, subarachnoid hemorrhage; APACHE II, acute physiology and chro- nic health evaluation II; SAPS II, simplified acute physiology score II; GCS, Glasgow coma scale; AUC, area under the curve; ROC, receiver oper- ating characteristic curve.
Univariate analysis
Variables Odds ratio (95% CI)
Multivariate analysis Variables
APACHE II (continuous) 1.04 (0.89-1.14)
SAPS II (continuous) 1.5 (1.1-2.3)
SAPS II (tertiles)
15-31 Reference
32-53 5.7 (2.1-15.3)
54-90 34.8 (10.6-98.7)
Age (continuous) 1.08 (1.02-1.13)
Sex (male) 1.17 (0.69-2.38)
GCS score (continuous) 7.2 (1.8-16.2)
Fisher grade 8.8 (3.4-19.6)
GCS score <12 3.7 (1.6-9.1)
Fisher grade≥3 5.8 (2.7-10.3)
APACHE II 1.05 (0.98-1.12)
SAPS II 1.37 (1.18-1.94)
AUC of ROC 0.82 (0.70-0.89)
Table 5.Univariate and multivariate analyses of predictors for hos- pital death in SAH patients (n=159)
0 20 40 60 80 100
1-Specificity (%)
Fig. 3.Discriminative ability of clinical prediction rules (outcome=
death) derived from APACHE II and SAPS II scoring systems
APACHE II
ROC curves
SAPS II
Sensitivity
100
80
60
40
20
0
tors were the same as for the univariate results except for the exclusion of heart rate, serum creatinine level, and urine out- put (Table 6).
DISCUSSION
General perspectives of APACHE II and SAPS II
Illness severity scoring systems are becoming more impor- tant tools for measuring ICU performance and outcome, allo- cating resources, triage of patients, and quality assurance. In the future, such scoring systems will play a larger role in finan- cial reimbursement or even accreditation for individual crit- ical care units (20). As stated previously, the APACHE II and SAPS II systems are based on multiple logistic regres- sion equations that describe abnormalities in multiple phys- iologic variables during the first 24 hr in the ICU, because many deaths occur soon after admission (4, 5). These scores are used to categorize patients in clinical trials and to com- pare units with a calculation of the probability for hospital
death and SMR. This has been assumed to be an indicator of ICU performance where unity implies that observed per- formance matches expected performance.
These scores have been tested in a wide range of patient populations with different results (21-23). Owing to pre-exist- ing or accompanying cerebral insult, patients admitted to NICU tended to show more unfavorable outcomes compared with non-NICU patients, and this is verified in our previ- ous report (24). In this paper, however, we did not assess the relationship between such scoring systems and individual patient outcomes. This fact prompted us to investigate the discriminative power of SAPS II and APACHE II in predict- ing the hospital mortality of NICU patients. In both systems, predicted mortality was much higher than actual mortality.
This might be attributed to surgical intervention, resuscita- tion in the emergency room, or altered physiologic factors observed more than 24 hr after admission that were unfore- seen, or inherent to the cerebral pathophysiologic process.
Scoring systems in patients with SAH and TBI
In this study, the amount of extravasated blood clot on CT scan (Fisher grade) and the level of consciousness at admis- sion (GCS) are still the most important determinants predict- ing mortality of SAH patients. However, GCS assessment only accounts for 15/71 (21.1%) in APACHE II score and 15/163 (9.2%) in SAPS II score. Moreover, Fisher grade is not included in the APACHE II and SAPS II scoring systems.
Therefore, a separate or complementary measurement scale must be added or prepared when considering this specific condition. Instead, these systems have systemic, extra-cere- bral indices of organ dysfunction, which was tailored to aver- age physiologic variables. Age and cardio-pulmonary param- eters (systolic blood pressure, PaO2/FiO2) are proven inde- pendent predictors for mortality. Myocardial stunning and neurogenic pulmonary edema mediated by systemic cate- cholamine surge are well-known systemic manifestations following SAH. They present as ischemic heart disease show- ing ST segment depression, T wave inversion on electrocar- diography, or ventilatory dysfunction showing effusion or inflammatory infiltration into the alveoli (25, 26).
According to Claassen et al. (27), hypoxemia, metabolic acidosis, hyperglycemia and cardiovascular instability within 24 hr of admission were independent prognosticators of death or severe disability in SAH patients. It is interesting that physiologic derangements besides the above-mentioned fac- tors and the presence of systemic inflammatory response syn- drome (SIRS) have been continuously suggested to have prog- nostic implications (25). APACHE II and SAPS II scores have all theses factors in their automated calculation tables. We cannot determine exactly why the APACHE II score did not reach statistical significance while the SAPS II score did. Inclu- sion or exclusion of co-morbidity is deemed a main differen- tial point between two systems.
TBI, traumatic brain injury; APACHE II, acute physiology and chronic health evaluation II; SAPS II, simplified acute physiology score II; GCS, Glasgow coma scale; AUC, area under the curve; ROC, receiver oper- ating characteristic curve.
Univariate analysis
Variables Odds ratio (95% CI)
Multivariate analysis Variables
APACHE II (continuous) 1.25 (1.12-1.44)
APACHE II (tertiles)
2-15 Reference
16-23 3.54 (1.52-7.04)
24-39 29.18 (8.94-54.72)
SAPS II (continuous) 1.71 (1.31-2.68)
SAPS II (tertiles)
15-33 Reference
34-52 7.7 (2.8-18.4)
53-90 41.5 (14.6-99.8)
Age (continuous) 1.08 (0.79-1.31)
Sex (male) 1.29 (1.05-1.92)
GCS score (continuous) 4.6 (2.1-12.3)
Systemic injury (+) (n=86) 6.9 (2.9-15.2) Blood pressure (systolic) 2.6 (1.5-4.4)
PaO2(continuous) 1.9 (1.1-3.3)
GCS score <12 2.9 (1.8-6.2)
Blood pressure <90 (mmHg) 4.4 (2.3-12.5)
PaO2<90 (%) 3.1 (1.7-7.4)
Systemic injury (+) (n=86) 5.7 (3.5-8.2)
APACHE II 1.5 (1.2-2.8)
SAPS II 2.3 (1.7-5.8)
AUC of ROC 0.88 (0.81-0.94)
Table 6.Univariate and multivariate analyses of predictors for hos- pital death in TBI patients (n=207)
The ideal ICU scoring system should provide a predictive basis for decision-making in individual patients as well as a comparative assessment of ICU performance. Most scoring systems have been constructed in general ICU populations and were therefore not validated for specific patients or groups.
This has been especially true for TBI patients, who are younger and do not have chronic health problems frequently seen in an older patients, resulting in underestimated predicted mor- tality (28). The main finding in the present study is that patient age was not related to hospital death, whereas TBI patients were more likely to die as the severity of accompa- nying systemic injury increased. Both APACHE II and SAPS II systems had statistical significance with mortality in a dose-dependent fashion. The impact of GCS score and cardiopulmonary dysfunctions (low blood pressure, low oxy- gen saturation) were similar to those of SAH patients.
Limitation and future direction
Although these scoring systems have certain advantages, limitations still exist in routine use. First, although these scores were prospectively recorded by medical personnel, a bias due to differences in calculating scores and validating patient-derived parameters cannot be completely excluded.
Post-hoc verification on all processes of data interpretation will be necessary. Second, this study was conducted at only one center. The results therefore, reflect the outcome of spe- cific patients in a tertiary care center and may not be gener- ally applicable to all hospitals in all cases. However, the study gives some insight into this issue, at least from a tertiary care perspective. Third, data collection and compilation have been identified as problems with the APACHE II and SAPS II sys- tems (29). Lead time bias, the question of where the patients came from and how long they were in the hospital prior to ICU admission may influence outcome (30). Fourth, the scor- ing systems are not adequate to make decisions for the man- agement of individual patients due to the relatively high mor- tality rate predicted in survivors and the low one predicted in non-survivors. APACHE II and SAPS II scores differed significantly in individual patient populations, and these sever- ity scores are not accurate enough to be used in the routine management of these patients. The appropriate allocation of limited resources available must be addressed. However, the decision to withdraw life support must not rely entirely on these scoring systems. Instead, alterations of management planning such as instituting surgical treatment, reinforcing pharmacological or medical intervention or transferring pat- ients to non-NICU, should be considered (14).
In spite of these limitations, we were able to obtain some helpful findings when assessing hospital mortality using APACHE II and SAPS II in NICU patients. First, there was a significant increase in observed mortality when APACHE II or SAPS II scores increased. Both systems, however, over- estimated mortality. The SMR was significantly below 1.0
in both scoring groups. An SMR below 1.0 may have at least three different explanations: selection of less severe patients, good clinical performance, or error of the system itself. Sec- ond, calibration and discrimination was good for both sys- tems. Correlation between the APACHE II and SAPS II was excellent, but this is not surprising, given the overlap in the variables considered. Score prediction was tested using crite- ria suitable to evaluate the calibration and discrimination properties of an outcome prediction score. The calibration curves, comparing observed proportions with predicted pro- portions of hospital death, were virtually identical. The dis- tribution of the calculated probability of hospital death in both APACHE II and SAPS II were both skewed toward the low score values. Third, there was no major difference in pre- dicting hospital mortality according to goodness-of-fit of the model, as shown by the calibration curves. However, when assessed by the Lemeshow-Hosmer method, APACHE II was statistically significant whereas SAPS II was not. Discrimi- nation between survivors and non-survivors appeared to be slightly superior with SAPS II according to the AUC (Fig. 3).
To obtain a better discrimination, more research is needed to define new variables based not on expert opinion but rather on statistical models (6, 31). Finally, if a certain variable were included in this system and consecutively checked, evaluation of new therapies, surveillance of resource utilization, and qual- ity assessment of each ICU would be possible, in addition to outcome prediction.
In summary, we conclude that both APACHE II and SAPS II score systems can be used to approximately predict in-hos- pital mortality of neurosurgical ICU patients, but not to mea- sure performance or to help in definite clinical decision-mak- ing. Neither can be relied on to provide prognostic informa- tion for an individual patient. There was some discordance between predictive implications in both systems, particular- ly in the two different disease categories of SAH and TBI patients. Although the ideal scoring system has yet to be devel- oped and no system has ever been demonstrated to be com- pletely reliable, the ongoing improvement of existing systems should no doubt continue.
REFERENCES
1. Rapoport J, Teres D, Lemeshow S, Gehlbach S. A method for assess- ing the clinical performance and cost-effectiveness of intensive care units: a multicenter inception cohort study. Crit Care Med 1994; 22:
1385-91.
2. Rowan KM, Kerr JH, Major E, McPherson K, Short A, Vessey MP.
Intensive Care Society’s Acute Physiology and Chronic Health Eval- uation (APACHE II) study in Britain and Ireland: a prospective, mul- ticenter, cohort study comparing two methods for predicting outcome for adult intensive care patients. Crit Care Med 1994; 22: 1392-401.
3. Zimmerman JE, Shortell SM, Knaus WA, Rousseau DM, Wagner DP, Gillies RR, Draper EA, Devers K. Value and cost of teaching
hospitals: a prospective, multicenter, inception cohort study. Crit Care Med 1993; 21: 1432-42.
4. Knaus WA, Draper EA, Wagner DP, Zimmerman JE. APACHE II:
a severity of disease classification system. Crit Care Med 1985; 13:
818-29.
5. Le Gall JR, Lemeshow S, Saulnier F. A new Simplified Acute Physi- ology Score (SAPS II) based on a European/North American multi- center study. JAMA 1993; 270: 2957-63.
6. Lemeshow S, Teres D, Pastides H, Avrunin JS, Steingrub JS. A method for predicting survival and mortality of ICU patients using objective- ly derived weights. Crit Care Med 1985; 13: 519-25.
7. Pittet D, Thievent B, Wenzel RP, Li N, Gurman G, Suter PM. Impor- tance of pre-existing co-morbidities for prognosis of septicemia in critically ill patients. Intensive Care Med 1993; 19: 265-72.
8. Brown MC, Crede WB. Predictive ability of acute physiology and chronic health evaluation II scoring applied to human immunodefi- ciency virus-positive patients. Crit Care Med 1995; 23: 848-53.
9. Smith RL, Levine SM, Lewis ML. Prognosis of patients with AIDS requiring intensive care. Chest 1989; 96: 857-61.
10. Chu DY. Predicting survival in AIDS patients with respiratory fail- ure. Application of the APACHE II scoring system. Crit Care Clin 1993; 9: 89-105.
11. Pierpont GL, Parenti CM. Physician risk assessment and APACHE scores in cardiac care units. Clin Cardiol 1999; 22: 366-8.
12. Blot F, Guiguet M, Nitenberg G, Leclercq B, Gachot B, Escudier B.
Prognostic factors for neutropenic patients in an intensive care unit:
respective roles of underlying malignancies and acute organ failures.
Eur J Cancer 1997; 33: 1031-7.
13. Headley J, Theriault R, Smith TL. Independent validation of APACHE II severity of illness score for predicting mortality in patients with breast cancer admitted to the intensive care unit. Cancer 1992; 70:
497-503.
14. Cho DY, Wang YC. Comparison of the APACHE II, APACHE III and Glasgow Coma Scale in acute head injury for prediction of mor- tality and functional outcome. Intensive Care Med 1997; 23: 77-84.
15. Murthy JM, Meena AK, Kumar SR. Severity-of-illness scoring sys- tems and models: neurological and neurosurgical intensive care units.
Neurol India 2001; 49 (Suppl 1): S91-4.
16. Schuiling WJ, de Weerd AW, Dennesen PJ, Algra A, Rinkel GJ. The simplified acute physiology score to predict outcome in patients with subarachnoid hemorrhage. Neurosurgery 2005; 57: 230-6.
17. Goldhill DR, Sumner A. Outcome of intensive care patients in a group of British intensive care units. Crit Care Med 1998; 26: 1337-45.
18. Lemeshow S, Hosmer DW Jr. A review of goodness of fit statistics for use in the development of logistic regression models. Am J Epi- demiol 1982; 115: 92-106.
19. Hanley JA, McNeil BJ. The meaning and use of the area under a re- ceiver operating characteristic (ROC) curve. Radiology 1982; 143:
29-36.
20. Zimmerman JE, Shortell SM, Rousseau DM, Duffy J, Gillies RR, Knaus WA, Devers K, Wagner DP, Draper EA. Improving intensive care: observations based on organizational case studies in nine inten- sive care units: a prospective, multicenter study. Crit Care Med 1993;
21: 1443-51.
21. el-Solh AA, Grant BJ. A comparison of severity of illness scoring sys- tems for critically ill obstetric patients. Chest 1996; 110: 1299-304.
22. Moreau R, Soupison T, Vauquelin P, Derrida S, Beaucour H, Sicot C.
Comparison of two simplified severity scores (SAPS and APACHE II) for patients with acute myocardial infarction. Crit Care Med 1989;
17: 409-13.
23. Schuster HP, Schuster FP, Ritschel P, Wilts S, Bodmann KF. The ability of the Simplified Acute Physiology Score (SAPS II) to predict outcome in coronary care patients. Intensive Care Med 1997; 23:
1056-61.
24. Yi HJ, Kim YS, Ko Y, Oh SJ, Kim KM, Oh SH. Factors associated with survival and neurological outcome after cardiopulmonary resus- citation of neurosurgical intensive care unit. Neurosurgery 2006; 59:
838-45.
25. Gruber A, Reinprecht A, Illievich UM, Fitzgerald R, Dietrich W, Czech T, Richling B. Extracerebral organ dysfunction and neurolog- ic outcome after aneurysmal subarachnoid hemorrhage. Crit Care Med 1999; 27: 504-14.
26. Solenski NJ, Haley EC, Kassell NF, Kongable G, Germanson T, Truskowski L, Torner JC. Medical complications of aneurysmal sub- arachnoid hemorrhage: a report of the multicenter, cooperative aneu- rysm study. Crit Care Med 1995; 23: 1007-17.
27. Claassen J, Vu A, Kreiter KT, Kowalski RG, Du EY, Ostapkovich N, Fitzsimmons BF, Connolly ES, Mayer SA. Effect of acute physi- ologic derangements on outcome after subarachnoid hemorrhage.
Crit Care Med 2004; 32: 832-8.
28. Vassar MJ, Wilkerson CL, Duran PJ, Perry CA, Holcroft JW. Com- parison of APACHE II, TRISS, and a proposed 24-hour ICU point system for prediction of outcome in ICU trauma patients. J Trauma 1992; 32: 490-9.
29. Cowen JS, Kelley MA. Errors and bias in using predictive scoring systems. Crit Care Clin 1994; 10: 53-72.
30. Tunnell RD, Millar BW, Smith GB. The effect of lead time bias on se- verity of illness scoring, mortality prediction and standardised mortal- ity ratio in intensive care-a pilot study. Anaesthesia 1998; 53: 1045-53.
31. Sarmiento J, Torres A, Guardiola JJ, Milla J, Nadal P, Rozman C.
Statistical modeling of prognostic indices for evaluation of critically ill patients. Crit Care Med 1991; 19: 867-70.