D I A B E T E S & M E T A B O L I S M J O U R N A L
This is an Open Access article distributed under the terms of the Creative Commons Attribution Non-Commercial License (http://creativecommons.org/licenses/by-nc/4.0/) which permits unrestricted non-commercial use, distribution, and reproduction in any medium, provided the original work is properly cited.
In Vitro Effect of Fatty Acids Identified in the Plasma of Obese Adolescents on the Function of Pancreatic
β-Cells
Claudia Velasquez1, Juan Sebastian Vasquez2, Norman Balcazar2,3
1Research Group in Food and Human Nutrition, School of Dietetics and Human Nutrition, University of Antioquia, Medellin,
2Genetics Molecular Group, University of Antioquia, Medellin,
3Department of Physiology and Biochemistry, School of Medicine, University of Antioquia, Medellin, Colombia
Background: The increase in circulating free fatty acid (FFA) levels is a major factor that induces malfunction in pancreatic β-cells. We evaluated the effect of FFAs reconstituted according to the profile of circulating fatty acids found in obese adolescents on the viability and function of the murine insulinoma cell line (mouse insulinoma [MIN6]).
Methods: From fatty acids obtained commercially, plasma-FFA profiles of three different youth populations were reconstituted:
obese with metabolic syndrome; obese without metabolic syndrome; and normal weight without metabolic syndrome. MIN6 cells were treated for 24 or 48 hours with the three FFA profiles, and glucose-stimulated insulin secretion, cell viability, mitochon- drial function and antioxidant activity were evaluated.
Results: The high FFA content and high polyunsaturated ω6/ω3 ratio, present in plasma of obese adolescents with metabolic syn- drome had a toxic effect on MIN6 cell viability and function, increasing oxidative stress and decreasing glucose-dependent insu- lin secretion.
Conclusion: These results could help to guide nutritional management of obese young individuals, encouraging the increase of ω-3-rich food consumption in order to reduce the likelihood of deterioration of β-cells and the possible development of type 2 di- abetes mellitus.
Keywords: Fatty acids, nonesterified; Insulin-secreting cells; Lipotoxicity; Metabolic syndrome; Obesity
Corresponding author: Norman Balcazar http://orcid.org/0000-0002-1860-1176 Genetics Molecular Group and Department of Physiology and Biochemistry, School of Medicine, University of Antioquia, Calle 62 #52-59, Medellin 1226, Colombia E-mail: [email protected]
INTRODUCTION
Overweight and the associated metabolic disorders affect more people in the world than any other condition [1]. Metabolic syndrome (MetS) describes the principal clinical manifesta- tions generated by obesity, and it can be more precisely re- ferred to as a chronic immune-MetS, that includes changes such as hyperglycaemia, insulin resistance (IR), atherogenic dyslipidaemia, fatty liver, hypercoagulability, arterial hyperten- sion, neurodegeneration, and autoimmunity [2].
Close to 90% of individuals with type 2 diabetes mellitus
(T2DM) are overweight and present MetS [3]. Abdominal (central) obesity principally occurs because of hypertrophy of the visceral adipocytes and is strongly associated with MetS [4]. The dysfunction of adipocyte populations that are in some way “sensitive” to cellular lesions due to over-eating is recog- nized as one of the initial factors in the development of MetS.
One of the connections between abdominal obesity and the metabolic changes of MetS could be circulating free fatty acids (FFAs) [5]. Adipocytes in adipose tissues are capable of activat- ing proinflammatory intracellular pathways during their de- velopment towards hypertrophy in the context of over-eating.
https://doi.org/10.4093/dmj.2017.41.4.303 pISSN 2233-6079 · eISSN 2233-6087
With time, a state of IR and local inflammation is established, which favours the release of excess FFAs that progress to differ- ent tissues that are not metabolically designed to store FFAs.
Some fatty acids released by inflamed visceral adipose tissue can promote an atherogenic state, altering the secretion of in- sulin or concomitantly generating IR in multiple tissues, espe- cially muscle, liver, and subcutaneous adipose tissues [6].
This inflammatory state and cytotoxic serum lipid profiles can induce chronic damage in the β-cells of the pancreas and loss of the insulin-secreting function. The effect of FFAs on β-cell function is complex and pleiotropic; it depends on the chemical nature, concentration, exposure time, and interaction with other nutrients. For example, culturing cells or islets for 24 or 48 hours with palmitic or stearic acid reduces glucose-stim- ulated insulin secretion (GSIS), induces apoptosis and reduces cell viability. However, coincubation with oleic or linoleic acid does not induce cell damage, and this treatment combined with palmitic or stearic acid also restores GSIS. These differen- tial effects of FFAs, some with protective potential and others with marked cytotoxicity, show that serum lipid levels are key factors in the progression from MetS to T2DM [7-9].
In adults, the data available on the FFA profile of obese per- sons with MetS are affected by lifestyle variables, such as alco-
hol consumption, smoking, or comorbidities. Children and adolescents present a disturbing increase in the incidence of obesity; this age range also offers advantages for the study of serum lipids due to the shorter time required to evaluate the effects of confounding lifestyle factors. For this reason, evaluat- ing the effect of FFAs in adolescents with immune-metabolic changes on the function and viability of β-cells is highly rele- vant both for clinical applications and at the basic research lev- el. We specifically study adolescents who have a very high risk of developing T2DM. It is important to determine the overall effect of each FFA mixture on the function of the pancreatic β component; this detailed information will allow us to identify early diagnostic biomarkers of progression and biomarkers for prognosis and to alter serum lipid profiles using individual or public nutritional strategies.
METHODS
Profiles of FFAs
Based on the previous study by Bermudez and Velasquez [10], the serum FFA profile of three groups of adolescents between the ages of 10 and 18 years was evaluated; these were (1) obese adolescents with MetS (OWMS), (2) obese adolescents without Table 1. Principal fatty acids in the FFAs of the adolescents in each study group
Fatty acid
NW ONMS OWMS
P valuea Concentration,
mg/dL No. (%) Concentration,
mg/dL No. (%) Concentration,
mg/dL No. (%)
Total FFA 103.25 31 (100) 106.16 32 (100) 121.90 32 (100) b,c,d
C16:0 (palmitic) 30.01 31 (28.71) 31.85 32 (30.00) 36.75 32 (30.15) b,c,d
C16:1 (palmitoleic) 1.74 8 (1.72) 1.84 19 (1.74) 2.28 27 (1.87) NS
C18:0 (stearic) 15.60 31 (15.16) 15.30 32 (14.41) 17.30 32 (14.20) b,c
C18:1 n-9c (oleic) 20.14 31 (19.01) 19.64 32 (18.50) 23.95 32 (19.65) NS
C18:2 n-6c (linoleic, LA) 21.80 31 (21.49) 22.35 32 (21.05) 25.07 32 (20.57) c,e C20:3 n-6 (cis-8,11,14-dihomo-
γ-linolenic, DGLA) 3.41 30 (3.36) 4.13 31 (3.89) 5.19 31 (4.26) b,c,d,f
C20:4 n (arachidonic, AA) 6.97 31 (7.01) 7.48 31 (7.05) 8.13 32 (6.67) b,c C22:6 n-3 (cis-4,7,10,13,16,19-
docosahexaenoic, DHA) 3.59 25 (3.54) 3.56 26 (3.36) 3.21 31 (2.63) NS
(LA+DGLA+AA)/DHA 8.96 25 9.00 26 11.96 31 NS
Data obtained from Bermudez et al. [10].
FFA, free fatty acid; NW, normal weight; ONMS, obese adolescents without metabolic syndrome (MetS); OWMS, obese adolescents with MetS;
NS, not significant.
aP<0.05, bKruskal-Wallis, cNW vs. OWMS, dONMS vs. OWMS, eAnalysis of variance followed by Tukey post hoc test for multiple comparisons,
fNW vs. ONMS.
MetS (ONMS), and (3) normal weight (NW) adolescents.
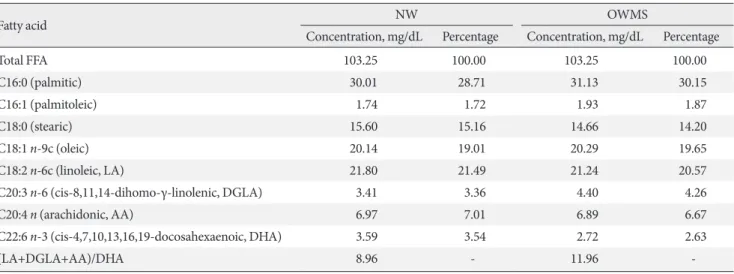
In the initial phase, the profile of each group of adolescents was evaluated using the eight fatty acids found with the highest frequencies in the three groups (Table 1). Each profile was re- constructed with the same quantity and proportion of each fatty acid found in each group. The second phase of the experi- ments was performed to determine whether the experimental- ly observed effects were due to the quantity or the ratio of FFA in each profile; the total quantity of FFAs in the mixture corre- sponding to the OWMS profile was decreased to be the same level as the total quantity corresponding to the NW profile without any change in the proportion of FFAs (Table 2). With these new profiles, that were equalized with respect to the total amount of FFAs but had the same proportions of FFAs, func- tional and viability tests in MIN6 (mouse insulinoma) cells were performed.
Preparation of the FFA profiles
The FFAs and bovine serum albumin (BSA) were obtained from Sigma (St. Louis, MO, USA). Saturated and monounsatu- rated fatty acids (MUFAs) were solubilized in distilled water.
The polyunsaturated fatty acids (PUFAs) were prepared in methanol under nitrogen atmosphere. The mixtures of eight different fatty acids in the quantity and proportion identified in the sera of the three groups were complexed to BSA with shaking for 3 hours at 37°C. A fixed FFA:BSA ratio of 6:1 was maintained. This mixture was dissolved in Dulbecco’s modi- fied Eagle medium (DMEM), with a high glucose level and no fetal bovine serum (FBS), and was added to the MIN6 cells for
the various evaluations.
Cellular culture
MIN6 cells were obtained from AddexBio Technologies (San Diego, CA, USA). The cells were maintained in DMEM, con- taining 25 mmol/L glucose, 2 mmol/L glutamine, 500 µM py- ruvate, and 15% FBS at 37°C, with 5% CO2 and 95% humidity.
The cells were seeded for the experiments in 48-well plates at 100,000 cells/well in medium without FBS for 24 hours. They were then washed in phosphate-buffered saline (PBS), and the FFA:BSA mixture with the appropriate profile was added to each group, whereas the control group received medium that was free of BSA and FFA. The cells were incubated for 24 or 48 hours, and the medium was changed after 24 hours for the 48- hour experiments. For the experiments on the adenosine tri- phosphate/adenosine diphosphate (ATP/ADP) relationship, the cells were cultured in 96-well plates at a density of 10,000 cells/well under the conditions described above.
Glucose-stimulated insulin secretion
GSIS was evaluated after incubating the cells with FFA profiles or without FFA (control). The cells were washed in PBS with 2 mmol/L glucose and maintained for 2 hours prior to collecting the supernatant (baseline secretion). Immediately thereafter, DMEM with 25 mmol/L glucose without FBS was added, the cells were incubated for 30 minutes, and the supernatant was collected (GSIS). The insulin secreted in the baseline condition and under glucose stimulation was quantified using an ultra- sensitive enzyme immunoassay (Mercodia, Uppsala, Sweden).
Table 2. Concentration of FFA in OWMS adolescents, adjusted to the concentration found for NW adolescents
Fatty acid NW OWMS
Concentration, mg/dL Percentage Concentration, mg/dL Percentage
Total FFA 103.25 100.00 103.25 100.00
C16:0 (palmitic) 30.01 28.71 31.13 30.15
C16:1 (palmitoleic) 1.74 1.72 1.93 1.87
C18:0 (stearic) 15.60 15.16 14.66 14.20
C18:1 n-9c (oleic) 20.14 19.01 20.29 19.65
C18:2 n-6c (linoleic, LA) 21.80 21.49 21.24 20.57
C20:3 n-6 (cis-8,11,14-dihomo-γ-linolenic, DGLA) 3.41 3.36 4.40 4.26
C20:4 n (arachidonic, AA) 6.97 7.01 6.89 6.67
C22:6 n-3 (cis-4,7,10,13,16,19-docosahexaenoic, DHA) 3.59 3.54 2.72 2.63
(LA+DGLA+AA)/DHA 8.96 - 11.96 -
FFA, free fatty acid; OWMS, obese adolescents with metabolic syndrome (MetS); NW, normal weight.
The results are expressed as a percentage of the change in GSIS [(stimulated concentration–baseline concentration)/baseline concentration]×100.
Cellular viability assay
The effect of the different FFA profiles on cellular viability was evaluated using the 3-(4,5-dimethylthiazol-2-yl)-2,5-diphenyl- tetrazolium bromide (MTT) colorimetric assay [11]. The ab- sorbance of each well was measured at 490 nm in a spectro- photometer (Varioskan Lux; Thermo Fisher, Waltham, MA, USA) and cell viability (percentage) was determined by nor- malizing each group to the control.
Evaluation of mitochondrial function
To evaluate the mitochondrial function in the cells treated with the FFA mixtures corresponding to the profiles of each group, GSIS was induced, and the cells were then immediately washed in PBS. After treatment with trypsin, 5 µL of the MitoTracker fluorophore (50 nM) and propidium iodide (250 nM) were added, both in PBS. Using flow cytometry (BD FACSCanto II Flow Cytometer; BD Biosciences, San Jose, CA, USA), mor- phological patterns were determined, and the mean intensity of MitoTracker fluorescence was quantified. In addition, the ATP/ADP ratio was quantified using a commercial kit (Ab- cam, Cambridge, UK).
Lipid peroxidation and antioxidant capacity
The content of intracellular lipid peroxidation products was determined using the thiobarbituric acid reactive substances (TBARS) assay [12]. Briefly, 1 mL cell extract was combined with 1 mL 0.02 M thiobarbituric acid and heated at 90°C for 45 minutes; the mixture was then cooled to room temperature, and the absorbance was determined at 532 nm (Varioskan Lux). The results are expressed as malondialdehyde (MDA) equivalents/mg of total protein.
The antioxidant capacity of the cell lysates after incubation with the FFAs was evaluated using the peroxynitrite anion (ONOO–) trapping capacity, following the protocol described by Whiteman et al. [13]. The capacity of the lysates to inhibit the peroxynitrite oxidation of the reagent was quantified relatively to ascorbic acid (AA) and normalized to the quantity of total protein. The results are shown in milligram of AA/mg of total protein.
Statistical analysis
The difference between groups was evaluated using the analy-
sis of variance with post hoc Tukey test for multiple compari- sons. The FFA concentrations were expressed as the mean±
standard error or the median±interquartile range. Differences were considered statistically significant at P<0.05. The statisti- cal analysis was performed using the program GraphPad Prism version 7.00 for Mac OS X (GraphPad Software, La Jolla, CA, USA).
RESULTS
The serum FFA mixture of OWMS adolescents reduces the secretory function and the viability of MIN6 cells
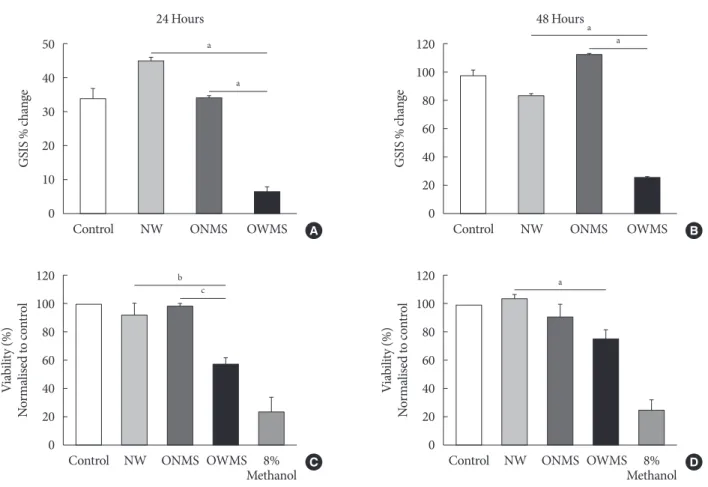
To determine the overall effect of the FFAs of each profile (NW, ONMS, and OWMS) on the function of β-cells, GSIS was quantified in MIN6 cells treated for 24 or 48 hours. After stim- ulation with the culture medium containing 25 mmol/L glu- cose without FBS, GSIS in the cells treated with the NW and ONMS FFA mixtures did not significantly differ from that of the control cells. However, GSIS at 24 hours was significantly lower in the cells treated with the OWMS FFA mixture than in the cells treated with the FFA mixtures corresponding to the NW and ONMS profiles. The reduction in GSIS was main- tained after treatment for 48 hours with the FFA mixture cor- responding to the OWMS profile (Fig. 1A and B).
To determine whether the FFA mixtures impact the viability of MIN6 cells, MTT assays were carried out for 24 and 48 hours (Fig. 1C and D). In the cells treated with the FFA mixture corre- sponding to the OWMS profile, cell viability decreased after 24 and 48 hours of treatment to 40% compared to that of the cells treated with the FFA mixture corresponding to the NW profile.
The other groups did not show significant changes.
The FFA mixture corresponding to the OWMS profile reduces the mitochondrial function of MIN6 cells
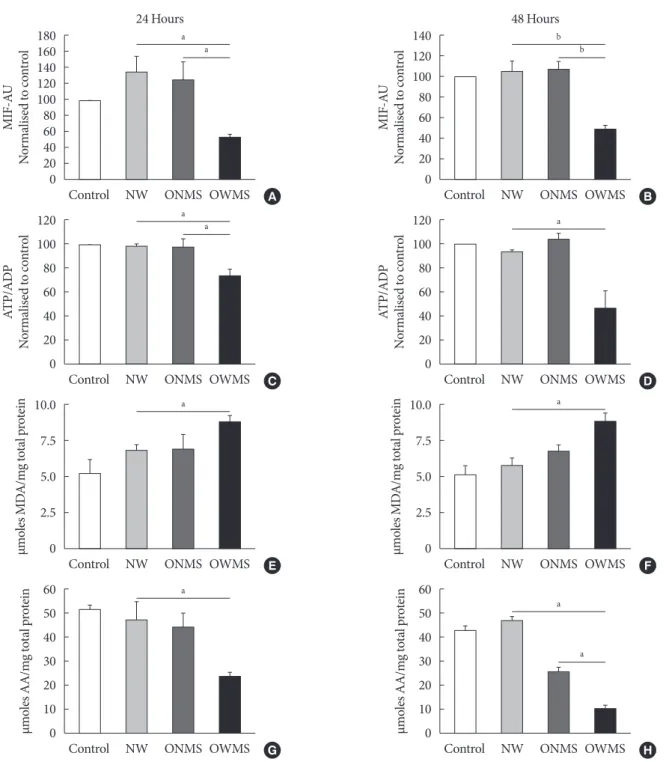
Mitochondrial function was evaluated by quantifying the po- tential of the internal mitochondrial membrane (IMM) using the MitoTracker fluorophore. Through flow cytometry, the mean intensity of fluorescence (MIF) was quantified in each cell group treated with the FFA mixtures and in the untreated control (Fig. 2). The IMM potential remained uniform in the control and in the NW and ONMS groups after both 24 and 48 hours of incubation, but the group of cells treated with the FFA mixture corresponding to the OWMS profile had a significant- ly lower potential at 24 and 48 hours (50%) compared to that of the control cells.
The ATP/ADP results demonstrated that the cells treated with the FFA mixture corresponding to the OWMS profile also reduced the ATP/ADP ratio compared to that of the control after both 24 and 48 hours of coincubation, with a cumulative effect over time (Fig. 2C and D).
The FFA mixture corresponding to the OWMS profile increases lipid peroxidation and reduces the antioxidant capacity
The results of a TBARS assay showed that treatment with the FFA mixture corresponding to the OWMS profile increased the concentration of MDA, which is the principal product of lipid peroxidation, at both 24 and 48 hours of coincubation.
Although the cells treated with the FFA mixtures correspond- ing to the NW and ONMS profiles tended to present increased lipid peroxidation at 24 hours, this increase was markedly low- er than observed in the OWMS group, and it remained the same in cells treated for 48 hours (Fig. 2E and F). β-Cells are particularly vulnerable to oxidative stress given their reduced antioxidant defence. Treatment with the FFA mixture corre- sponding to the OWMS profile reduced the capacity to capture peroxynitrite compared to that of the control or for the treat- ment with the FFA mixture corresponding to the NW profile;
in the latter two groups, the antioxidant capacity was main- tained without changes after both 24 and 48 hours of treatment (Fig. 2G and H).
Fig. 1. Glucose-stimulated insulin secretion (GSIS) and viability of MIN6 (mouse insulinoma) cells treated with the free fatty acid (FFA) mixtures corresponding to the different profiles. MIN6 cells were treated for 24 (A ,C) or 48 hours (B, D) with the FFA mix- tures corresponding to the profiles of adolescents of normal weight (NW), obese adolescents without metabolic syndrome (MetS) (ONMS) or obese adolescents with MetS (OWMS). (A, B) Control cells were grown without adding fatty acids. The percentage change in GSIS is shown. (C, D) Cell viability was determined using the MTT (3-(4,5-dimethylthiazol-2-yl)-2,5-diphenyltetrazo- lium bromide) assay, with the results normalized to the control, and expressed as a viability percentage. aIndicates P<0.05,
bP<0.01, cP<0.001 using analysis of variance followed by Tukey post hoc test for multiple comparisons. The cells were treated with methanol as negative control for viability (n=3 independent experiments).
50 40 30 20 10 0
120 100 80 60 40 20 0
120 100 80 60 40 20 0 120 100 80 60 40 20 0
GSIS % changeViability (%) Normalised to control Viability (%) Normalised to controlGSIS % change
Control NW ONMS OWMS
Control NW ONMS OWMS 8% Control NW ONMS OWMS 8%
Methanol Methanol
Control NW ONMS OWMS
24 Hours 48 Hours
A
C D
B
a
b a
a
a
c
a
Fig. 2. Mitochondrial function, lipid peroxidation, and antioxidant capacity of MIN6 (mouse insulinoma) cells treated with free fatty acids (FFAs). MIN6 cells were treated for 24 (A, C, E, G) or 48 (B, D, F, H) hours with the FFA mixtures corresponding to the profiles of adolescents with normal weight (NW), obese adolescents without metabolic syndrome (MetS) (ONMS) or obese ado- lescents with MetS (OWMS). Control cells were grown without adding fatty acids. (A, B) The potential of the internal mitochon- drial membrane was quantified as the mean intensity of fluorescence (MIF) emitted by MitoTracker using flow cytometry analy- sis. (C, D) The adenosine triphosphate/adenosine diphosphate (ATP/ADP) ratio was determined using bioluminescence. (E, F) The production of lipid peroxidation products was quantified using the thiobarbituric acid reactive substance assay and expressed as the concentration of malondialdehyde (MDA) normalized with the total mg of protein. (G, H) The capacity to trap peroxyni- trite is expressed relative to the antioxidant activity of ascorbic acid (AA) with normalization to the total protein content of each group. AU, arbitrary unit. aIndicates P<0.05, bP<0.001 using analysis of variance followed by Tukey test of multiple comparisons.
180160 140120 10080 6040 200
120 100 80 60 40 20 0
10.0 7.5 5.0 2.5 0
60 50 40 30 20 10 0
140 120 100 80 60 40 20 0
120 100 80 60 40 20 0
10.0 7.5 5.0 2.5 0
60 50 40 30 20 10 0
MIF-AU Normalised to controlATP/ADP Normalised to controlμmoles MDA/mg total proteinμmoles AA/mg total protein MIF-AU Normalised to controlATP/ADP Normalised to controlμmoles MDA/mg total proteinμmoles AA/mg total protein
Control NW ONMS OWMS
Control NW ONMS OWMS
Control NW ONMS OWMS
Control NW ONMS OWMS
Control NW ONMS OWMS
Control NW ONMS OWMS
Control NW ONMS OWMS
Control NW ONMS OWMS
24 Hours 48 Hours
A
C
E
G
B
D
F
H
a
a
a
a
b
a
a
a a
a
b
a
Effect of the proportion of FFAs on the function and viability of MIN6 cells
To determine whether the negative effects of the OWMS mix- ture of FFAs on the function and viability of the MIN6 cells observed in this study were due to the total quantity of FFAs or to their proportion in the total profile, the total quantity of FFAs in the OWMS mixture was equalized so as to be the same as that in the NW mixture while maintaining the relative pro- portion of each fatty acid (Table 2). The effect of the ONMS FFA mixture was not further studied because in all tests, it showed a pattern very similar to that of the NW profile.
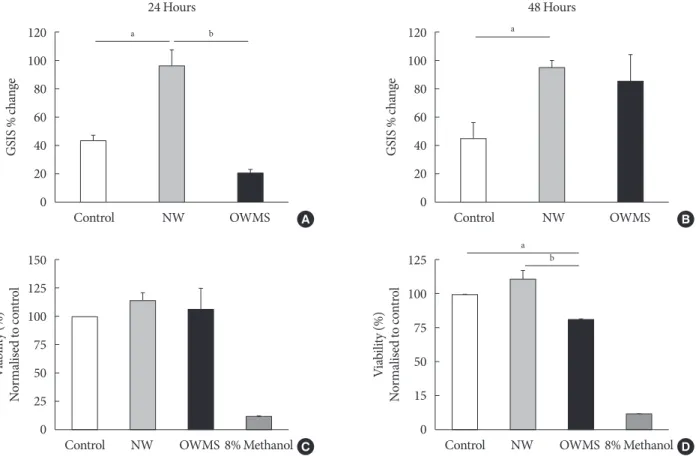
At 24 hours, the treatment with the NW FFA mixture signif- icantly increased GSIS compared to that of the control (Fig. 3A
and B). In contrast, treatment with the OWMS FFA mixture decreased insulin secretion by approximately 50%. At 48 hours, the cells treated with the NW FFA mixture maintained GSIS without changes compared to 24 hours, whereas the cells treated with the OWMS FFA mixture recovered GSIS, with an 86% increase in secretion compared to baseline secretion (Fig 3A and B). Interestingly, cell viability determined by the MTT assay did not show changes in the cells treated with the OWMS FFA mixture at 24 hours but did show a reduction of approxi- mately 20% after 48 hours of treatment (Fig. 3C and D).
The IMM potential remained uniform in the control and NW groups at both 24 and 48 hours of incubation, but the treatment with the OWMS FFA mixture caused a significant
Fig. 3. Effect of the proportion of free fatty acids (FFAs) on the function and viability of MIN6 (mouse insulinoma). The concen- tration of fatty acids corresponding to the lipid profile of obese adolescents with metabolic syndrome (OWMS) adolescents was adjusted to the total quantity of FFAs present in the serum of normal weight (NW) adolescents (103.25 mg/dL), but the original proportions were conserved (Table 2). MIN6 cells were treated for 24 (A, C) or 48 hours (B, D) with the NW or OWMS profiles.
Control cells were grown without adding fatty acids. (A, B) The cells were maintained in baseline conditions of insulin secretion (2 mmol/L glucose in phosphate-buffered saline) and then stimulated with 25 mmol/L glucose in culture medium lacking both FFAs and fetal bovine serum. The percentage change in glucose-stimulated insulin secretion (GSIS) is shown. (C, D) Cellular via- bility was determined using the MTT (3-(4,5-dimethylthiazol-2-yl)-2,5-diphenyltetrazolium bromide) assay, normalized to the control and expressed as the viability percentage. aIndicates P<0.05, bP<0.01, using analysis of variance followed by Tukey test of multiple comparisons. The cells were treated with methanol as negative control for viability.
120 100 80 60 40 20 0
150 125 100 75 50 25 0
125 100 75 50 15 0 120 100 80 60 40 20 0
GSIS % changeViability (%) Normalised to control Viability (%) Normalised to controlGSIS % change
Control NW OWMS
Control NW OWMS 8% Methanol Control NW OWMS 8% Methanol
Control NW OWMS
24 Hours 48 Hours
A
C D
B
a b
b a a
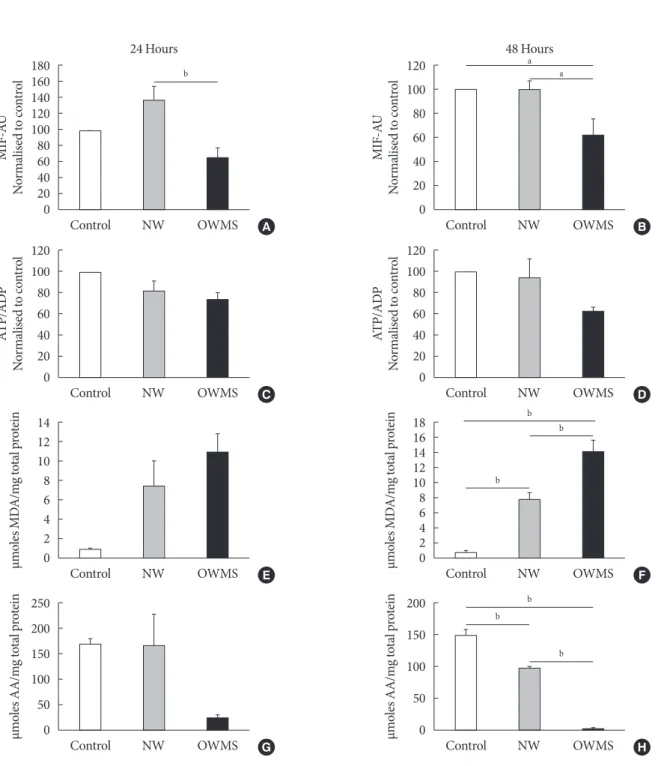
Fig. 4. Effect of the proportion of free fatty acids (FFAs) on mitochondrial function, lipid peroxidation, and antioxidant capacity of MIN6 (mouse insulinoma) cells. The concentration of fatty acids corresponding to the lipid profile of obese adolescents with metabolic syndrome (OWMS) adolescents was adjusted so as to have the same total amount of FFAs as the serum of normal weight (NW) adolescents (103.25 mg/dL), but the original proportions were conserved (Table 2). MIN6 cells were treated for 24 (A, C, E, G) or 48 hours (B, D, F, H) with the NW or OWMS profiles. Control cells were grown without adding fatty acids. (A, B) The potential of the internal mitochondrial membrane was quantified as the mean intensity of fluorescence (MIF) emitted by Mi- toTracker during flow cytometry analyses. (C, D) The adenosine triphosphate/adenosine diphosphate (ATP/ADP) ratio was de- termined using bioluminescence. (E, F) The production of lipid peroxidation products was quantified using the thiobarbituric acid reactive substance assay and is expressed as the concentration of malondialdehyde (MDA) normalized to the total milligram (mg) of protein. (G, H) The capacity to capture peroxynitrite is expressed relative to the antioxidant activity of ascorbic acid (AA) and normalized to the total protein content for each group. AU, arbitrary unit. aIndicates P<0.05, bP<0.01, using analysis of vari- ance followed by Tukey test of multiple comparisons.
180160 140120 10080 6040 200
120 100 80 60 40 20 0
14 12 10 8 6 4 2 0
250 200 150 100 50 0
120 100 80 60 40 20 0
120 100 80 60 40 20 0
1816 1412 108 64 20
200 150 100 50 0
MIF-AU Normalised to controlATP/ADP Normalised to controlμmoles MDA/mg total proteinμmoles AA/mg total protein MIF-AU Normalised to controlATP/ADP Normalised to controlμmoles MDA/mg total proteinμmoles AA/mg total protein
Control NW OWMS
Control NW OWMS
Control NW OWMS
Control NW OWMS
Control NW OWMS
Control NW OWMS
Control NW OWMS
Control NW OWMS
24 Hours 48 Hours
A
C
E
G
B
D
F
H
a
b
b a
b b b
b b
reduction in the potential at 24 and 48 hours (40%) compared to that of the control group (Fig. 4A and B). Quantifying the ATP/ADP ratio indicated no significant change between the groups, although the ratio tended to be lower in the OWMS group (Fig. 4C and D).
Compared to control cells and to cells treated with the NW FFA mixture, the cells treated with the OWMS FFA mixture presented a significantly higher MDA concentration after 48 hours of coincubation. However, cells treated with the NW FFA mixture showed a significant increase in the production of MDA compared to that produced in control cells (Fig. 4E and F). A similar effect was observed when evaluating the anti- oxidant capacity. Compared with the control cells and cells treated with the NW FFA mixture, cells treated with the OWMS FFA mixture had a lower capacity to capture peroxyni- trite after 48 hours of treatment. The antioxidant capacity of cells treated with the NW FFA mixture was also lower than that of the control cells (Fig. 4G and H).
The significant decrease in the antioxidant capacity and the increase in the reactive oxygen species (ROS) observed (Fig.
4F and H) in the cells treated with the NW FFA mixture com- pared to control cells may be explained by the high passage number in which the experiments were performed. In phase 2, cells with a much higher passage number were used than those used in phase 1, and the cells became sensitive to oxidative stress due to a decrease in antioxidant capacity.
DISCUSSION
IR in peripheral tissues and the dysfunction of pancreatic β-cells are the principal pathological characteristics of T2DM and the latter abnormality results from prolonged exposure to high concentrations of glucose and FFAs; that is, frequently as- sociated with obesity and MetS.
The increase in circulating FFA levels, particularly in satu- rated FFAs, is the principal factor inducing apoptosis and poor function of pancreatic β-cells. However, the effects vary with the length of the carbon chain and degree of saturation of cir- culating FFAs, via different mechanisms. There is significant controversy regarding the effect of fatty acids on β-cells [7-9].
For example, the presence of unsaturated FFAs rescues cells from the toxic effects of saturated FFAs [14,15]. There are no published studies that evaluate the effect of the FFA mixture in the serum of OWMS or ONMS on the function and viability of pancreatic β-cells.
The FFA composition of serum can predict the risk of diabe- tes and cardiovascular disease, and it is closely related to com- ponents of MetS. Diverse studies have reported higher concen- trations of myristic and stearic saturated fatty acids, palmitoleic (16:1 n-7) MUFA and dihomo-γ-linolenic (20:3 n-6) PUFA, and lower concentrations of linoleic acid (18:2 n-6) and doco- sahexaenoic acid (DHA; 22:6 n-3) in obese children than in non-obese children. In obese children with MetS, the concen- trations of oleic (18:1 n-9) and palmitoleic (16:1 n-7) MUFAs and γ linoleic (18:3 n-6) PUFAs were higher, and the concen- trations of linoleic (18:2 n-6) PUFAs also remained low [16,17].
The cellular defects induced by high levels of circulating FFAs and glucose (glucolipotoxicity), that may be responsible for cell death or deterioration in the secretory function of β-cells, include epigenetic changes [18], inflammation [19], changes in cellular signalling [20], oxidative stress [21], endo- plasmic reticulum (ER) stress [22], and mitochondrial dys- function [23].
The main aim of present study was to evaluate the effect the total fatty acid mixture had on adolescent’s plasma on the func- tion of MIN6 cells. We considered that a more real approach was to analyze the global effect of this FFA mixture.
In OWMS adolescents, the total amount of FFAs is higher than that of ONMS or NW adolescents (Table 1) and probably reflects the inflammatory status, IR and adrenergic hypersensi- tivity manifested by hypertrophied adipocytes. In these cir- cumstances, there is substantial mobilisation of the FFAs that reach and perfuse the pancreas; these FFAs then directly con- tact β-cells and exert a combination of effects on the secretory dynamics of these cells. In addition to the total quantity of FFAs, the population of polyunsaturated ω6 FFAs in the serum of OWMS adolescents significantly differed from that of the NW and ONMS groups. The increase in metabolic intermedi- aries in the pathway of ω6 PUFAs is accompanied by an in- crease in the production of prostaglandins and series two thromboxanes, which stimulate inflammatory processes that can be associated with the pathogenesis of T2DM [24]. For ex- ample, prostaglandin E2 (PGE2) is a negative regulator of insu- lin secretion in HIT-T15 cell lines but does not affect cell via- bility [25].
The current study demonstrates that 24 and 48 hours of treatment with the FFA mixture corresponding to the profile of OWMS adolescents, compared with that of the NW group, decreased the secretory function and viability of MIN6 cells.
The precise mechanisms through which FFAs generate func- tional damage in β-cells have yet to be clarified. Previous stud- ies reported that long-chain and saturated acyl-CoA accumu- lates in the cytoplasm and potentiates synthesis of ceramides that are implicated in apoptosis and functional damage [26].
Other mechanisms include over-activation of protein kinase C or inhibition of Akt kinase and calpain-10 [27,28]. In addition, activation of the stress kinases PKR (double-stranted RNA-de- pendent protein kinase), IKK (IκB kinase), and JNK (c-Jun N- terminal kinase) has been documented. The activation of these kinases induces intracellular proinflammatory pathways. For example, in cells treated with saturated FFAs, the expression of nuclear factor-κB increases up to 10-fold [29].
There was a limitation in this research. In the GSIS assay, the cells were incubated in PBS with 2 mmol/L glucose to re- duce basal insulin secretion levels. Afterwards, insulin secre- tion was stimulated in DMEM with 25 mmol/L glucose. PBS and DMEM are different buffers, and cells treated with PBS with 2 mmol/L glucose may not be the best control for cells treated with DMEM with 25 mmol/L glucose. However this does not affect the percentage of insulin secretion (up to 150%;
data not shown).
It is also possible that the FFAs corresponding to the OWMS profile induce acute changes in the fluidity of microsomal membranes, impairing the function of the ER and thus reduc- ing the production and processing of insulin. Saturated FFAs have been implicated as participants in the activation of the unfolded protein response (UPR) that can culminate in apop- tosis. The onset of apoptosis has been documented in INS-1 (rat insulinoma) cells, with only 16 hours of incubation with 1 mmol/L palmitate [8].
As mentioned above, either the quantity of fatty acids or the proportions of the different FFAs present in this profile may explain the effect on GSIS and cell viability observed in cells treated with the OWMS FFA mixture. For this reason, experi- ments were carried out in which the total amount of FFAs from the mixture corresponding to the OWMS profile was re- duced to the same levels as the NW profile without changes in the proportions of the FFAs (Table 2). Insulin secretion was only significantly diminished after 24 hours of treatment with the FFA mixture corresponding to the modified OWMS pro- file, but after 48 hours, the levels returned to those of cells treated with the NW profile. At 48 hours, the cells probably ad- justed to the new nutritional conditions and regained their ca- pacity to secrete insulin. Conversely, the viability of the cells
was reduced at 48 hours of treatment with the FFA mixture corresponding to the modified OWMS profile, possibly indi- cating that in addition to the amount of FFA present in the medium, the proportion of ω6 fatty acids may exert a negative effect on cell viability.
Mitochondrial function was evaluated, and the FFA mixture corresponding to the OWMS profile reduced the membrane potential and the ATP/ADP ratio in MIN6 cells. Saturated FFAs induce negative changes in the mitochondrial dynamics, such as fission, liberation of cytochrome C, an excessive load of calcium in the matrix or an increase in transitional mitochon- drial permeability with an acute decrease in membrane poten- tial [15]. ATP is the principal inducer in the depolarisation of β-cells; thus, its decrease has rapid repercussions on secretion during the first stage. Disorders in mitochondria tend to lead to an increase in reactive oxygen and nitrogen species. Due to their instability and rapid disappearance, we quantified the production of lipid peroxidation products as a direct indicator of cellular oxidative stress. The OWMS FFA mixture may in- duce structural mitochondrial damage that culminates in oxi- dative stress. The cells were cultivated in conditions of high glucose (25 mmol/L) to simulate both glucotoxic conditions and other substrates for oxidation; the fatty acids themselves impose a great oxidative demand that can facilitate the genera- tion of ROS and reactive nitrogen species if the damage is maintained in the mitochondrial membranes [23]. The antiox- idant defence of β-cells tends to be reduced, making them es- pecially vulnerable to damage by ROS and RNS. The cells treated with the OWMS FFA mixture had a significantly lower capacity to trap peroxynitrite. This change may be due to the acute load on non-enzymatic antioxidant mechanisms and the reduction in the synthesis of antioxidant enzymes in the con- text of ER stress and the activation of the UPR [22].
When the total amount of FFAs corresponding to the OWMS profile was decreased, a significant reduction was observed in the MIF, at both 24 and 48 hours of treatment; this effect was not correlated with the ATP/ADP ratio but with an increase in ROS and a decrease in the antioxidant capacity at 48 hours of treatment.
Oxidative stress has been closely related to the dysfunction and death of β-cells in the pancreas, and this can partly explain the physiopathology of T2DM [30,31]. In fact, the control of ROS improves the health of β-cells, even in conditions of glu- colipotoxicity [32,33]. The results obtained in this study could suggest that an excessive nutritional load or a greater quantity
of ω6 fatty acids could be involved in deterioration in the elec- tronic transport chain, leading to a decrease in the mitochon- drial membrane potential. If the electronic transport chain does not work properly, the electrons generated by the oxida- tion of nutrients can increase the level of ROS.
The mechanisms by which ω6 fatty acids induce cell damage are not well known. Meng et al. [25] have demonstrated that PGE2, a metabolic product of arachidonic acid, has a negative effect on insulin secretion. A probable mechanism is to reduce AKT protein activation and stimulate FoxO (Forkhead box O protein) protein activation. This will reduce these cells’ prolif- eration and survival. On the other hand, the results of the same group, confirmed by Wei et al. [34], demonstrated that PGE2 stimulates the expression of a receptor-associated Gi protein, reduces cyclic adenosine monophosphate levels, and causes a concomitant reduction of insulin secretion [25].
Previous studies conducted on rodents and large-scale pop- ulation studies have demonstrated that ω6 eicosanoids are more powerful mediators of inflammation than ω3. An in- crease in the ω6/ω3 ratio greatly favors proinflammatory pro- cesses, and this contributes significantly to establishing IR and diabetes-related complications. These facts suggest that in- flammation control, by reducing ω6 can have a beneficial effect on a beta cell’s secretory function [35].
Several studies have demonstrated that ω3-generated lipid mediators, including eicosapentaenoic acid (20:5 n-3) and DHA (22:6 n-3) have anti-inflammatory and protective activi- ties in different pathologies including T2DM [36]. ω3 Produc- tion in transgenic mice that overexpress the fat-1 gene (an ω3 desaturase, that catalyzes the ω6 to ω3 conversion) favors GSIS and protects β-cells from cytokine-mediated destruction [34].
Studies conducted on streptozotocin-induced diabetic rats demonstrated that a ω3-enriched diet reduces hyperglycemia [37]. On the other hand, ω3 reduces IR and obesity-induced hepatic steatosis through the stimulation of insulin-sensitivity- related gene expression such as type 2 and type 4 glucose trans- porters, and type 1 and type 2 insulin receptor substrates [38].
In conclusion, modern diets have an elevated content of ω6 PUFAs and very low levels of ω3, leading to very unhealthy ω6/ω3 ratios in the blood, with a level of 20:1 instead of the ideal proportion of 1:1 [39]. Adolescents with obesity and MetS have a very elevated risk of developing T2DM. These re- sults may contribute in part to an improvement in the nutri- tional management of OWMS adolescents by suggesting an increase in the consumption of foods rich in ω3 fatty acids and
thereby reducing the probability of developing T2DM.
In a future study, we shall examine the individual effect of each one of the FFAs in the proportion found in the plasma of each experimentation group.
CONFLICTS OF INTEREST
No potential conflict of interest relevant to this article was re- ported.
ACKNOWLEDGMENTS
We thank Anne-Lise Haenni for her critical review. This study was supported by COLCIENCIAS (Colombia) grant No. 1115- 569-33200.
REFERENCES
1. NCD Risk Factor Collaboration (NCD-RisC). Trends in adult body-mass index in 200 countries from 1975 to 2014: a pooled analysis of 1698 population-based measurement studies with 19.2 million participants. Lancet 2016;387:1377-96.
2. Must A, Spadano J, Coakley EH, Field AE, Colditz G, Dietz WH. The disease burden associated with overweight and obe- sity. JAMA 1999;282:1523-9.
3. Mokdad AH, Ford ES, Bowman BA, Dietz WH, Vinicor F, Bales VS, Marks JS. Prevalence of obesity, diabetes, and obesi- ty-related health risk factors, 2001. JAMA 2003;289:76-9.
4. Despres JP, Lemieux I. Abdominal obesity and metabolic syn- drome. Nature 2006;444:881-7.
5. Hotamisligil GS. Inflammation and metabolic disorders. Na- ture 2006;444:860-7.
6. Kloting N, Bluher M. Adipocyte dysfunction, inflammation and metabolic syndrome. Rev Endocr Metab Disord 2014;15:
277-87.
7. Furstova V, Kopska T, James RF, Kovar J. Comparison of the ef- fect of individual saturated and unsaturated fatty acids on cell growth and death induction in the human pancreatic beta-cell line NES2Y. Life Sci 2008;82:684-91.
8. Karaskov E, Scott C, Zhang L, Teodoro T, Ravazzola M, Vol- chuk A. Chronic palmitate but not oleate exposure induces en- doplasmic reticulum stress, which may contribute to INS-1 pancreatic beta-cell apoptosis. Endocrinology 2006;147:3398- 407.
9. Lai E, Bikopoulos G, Wheeler MB, Rozakis-Adcock M, Vol-
chuk A. Differential activation of ER stress and apoptosis in re- sponse to chronically elevated free fatty acids in pancreatic be- ta-cells. Am J Physiol Endocrinol Metab 2008;294:E540-50.
10. Bermudez JA, Velasquez CM. Profile of free fatty acids (FFA) in serum of young Colombians with obesity and metabolic syndrome. Arch Latinoam Nutr 2014;64:248-57.
11. Berridge MV, Tan AS. Characterization of the cellular reduc- tion of 3-(4,5-dimethylthiazol-2-yl)-2,5-diphenyltetrazolium bromide (MTT): subcellular localization, substrate depen- dence, and involvement of mitochondrial electron transport in MTT reduction. Arch Biochem Biophys 1993;303:474-82.
12. Rojano BA, Gaviria CA, Saez JA. Antioxidant activity determi- nation in a lipidic peroxidation model of butter inhibited by isoespintanol. Vitae 2008;15:212-8.
13. Whiteman M, Ketsawatsakul U, Halliwell B. A reassessment of the peroxynitrite scavenging activity of uric acid. Ann N Y Acad Sci 2002;962:242-59.
14. Maedler K, Spinas GA, Dyntar D, Moritz W, Kaiser N, Donath MY. Distinct effects of saturated and monounsaturated fatty acids on beta-cell turnover and function. Diabetes 2001;50:69- 76.
15. Maedler K, Oberholzer J, Bucher P, Spinas GA, Donath MY.
Monounsaturated fatty acids prevent the deleterious effects of palmitate and high glucose on human pancreatic beta-cell turnover and function. Diabetes 2003;52:726-33.
16. Kawashima A, Sugawara S, Okita M, Akahane T, Fukui K, Hashiuchi M, Kataoka C, Tsukamoto I. Plasma fatty acid com- position, estimated desaturase activities, and intakes of energy and nutrient in Japanese men with abdominal obesity or meta- bolic syndrome. J Nutr Sci Vitaminol (Tokyo) 2009;55:400-6.
17. Klein-Platat C, Drai J, Oujaa M, Schlienger JL, Simon C. Plas- ma fatty acid composition is associated with the metabolic syndrome and low-grade inflammation in overweight adoles- cents. Am J Clin Nutr 2005;82:1178-84.
18. Malmgren S, Spegel P, Danielsson AP, Nagorny CL, Andersson LE, Nitert MD, Ridderstrale M, Mulder H, Ling C. Coordinate changes in histone modifications, mRNA levels, and metabo- lite profiles in clonal INS-1 832/13 beta-cells accompany func- tional adaptations to lipotoxicity. J Biol Chem 2013;288:11973- 87.
19. Akash MS, Rehman K, Chen S. Role of inflammatory mecha- nisms in pathogenesis of type 2 diabetes mellitus. J Cell Bio- chem 2013;114:525-31.
20. Haber EP, Hirabara SM, Gomes AD, Curi R, Carpinelli AR, Carvalho CR. Palmitate modulates the early steps of insulin
signalling pathway in pancreatic islets. FEBS Lett 2003;544:
185-8.
21. Pi J, Collins S. Reactive oxygen species and uncoupling protein 2 in pancreatic beta-cell function. Diabetes Obes Metab 2010;
12 Suppl 2:141-8.
22. Cnop M, Foufelle F, Velloso LA. Endoplasmic reticulum stress, obesity and diabetes. Trends Mol Med 2012;18:59-68.
23. Lowell BB, Shulman GI. Mitochondrial dysfunction and type 2 diabetes. Science 2005;307:384-7.
24. Luo P, Wang MH. Eicosanoids, beta-cell function, and diabe- tes. Prostaglandins Other Lipid Mediat 2011;95:1-10.
25. Meng ZX, Sun JX, Ling JJ, Lv JH, Zhu DY, Chen Q, Sun YJ, Han X. Prostaglandin E2 regulates Foxo activity via the Akt path- way: implications for pancreatic islet beta cell dysfunction. Di- abetologia 2006;49:2959-68.
26. Lupi R, Dotta F, Marselli L, Del Guerra S, Masini M, Santangelo C, Patane G, Boggi U, Piro S, Anello M, Bergamini E, Mosca F, Di Mario U, Del Prato S, Marchetti P. Prolonged exposure to free fatty acids has cytostatic and pro-apoptotic effects on hu- man pancreatic islets: evidence that beta-cell death is caspase mediated, partially dependent on ceramide pathway, and Bcl-2 regulated. Diabetes 2002;51:1437-42.
27. Eitel K, Staiger H, Rieger J, Mischak H, Brandhorst H, Brendel MD, Bretzel RG, Haring HU, Kellerer M. Protein kinase C del- ta activation and translocation to the nucleus are required for fatty acid-induced apoptosis of insulin-secreting cells. Diabetes 2003;52:991-7.
28. Wrede CE, Dickson LM, Lingohr MK, Briaud I, Rhodes CJ.
Protein kinase B/Akt prevents fatty acid-induced apoptosis in pancreatic beta-cells (INS-1). J Biol Chem 2002;277:49676-84.
29. Rakatzi I, Mueller H, Ritzeler O, Tennagels N, Eckel J. Adipo- nectin counteracts cytokine- and fatty acid-induced apoptosis in the pancreatic beta-cell line INS-1. Diabetologia 2004;47:
249-58.
30. Mehmeti I, Gurgul-Convey E, Lenzen S, Lortz S. Induction of the intrinsic apoptosis pathway in insulin-secreting cells is de- pendent on oxidative damage of mitochondria but indepen- dent of caspase-12 activation. Biochim Biophys Acta 2011;
1813:1827-35.
31. Newsholme P, Haber EP, Hirabara SM, Rebelato EL, Procopio J, Morgan D, Oliveira-Emilio HC, Carpinelli AR, Curi R. Diabe- tes associated cell stress and dysfunction: role of mitochondrial and non-mitochondrial ROS production and activity. J Physiol 2007;583(Pt 1):9-24.
32. Lim S, Rashid MA, Jang M, Kim Y, Won H, Lee J, Woo JT, Kim
YS, Murphy MP, Ali L, Ha J, Kim SS. Mitochondria-targeted antioxidants protect pancreatic beta-cells against oxidative stress and improve insulin secretion in glucotoxicity and glu- colipotoxicity. Cell Physiol Biochem 2011;28:873-86.
33. Lin N, Chen H, Zhang H, Wan X, Su Q. Mitochondrial reactive oxygen species (ROS) inhibition ameliorates palmitate-in- duced INS-1 beta cell death. Endocrine 2012;42:107-17.
34. Wei D, Li J, Shen M, Jia W, Chen N, Chen T, Su D, Tian H, Zheng S, Dai Y, Zhao A. Cellular production of n-3 PUFAs and reduction of n-6-to-n-3 ratios in the pancreatic beta-cells and islets enhance insulin secretion and confer protection against cytokine-induced cell death. Diabetes 2010;59:471-8.
35. Simopoulos AP. Importance of the ratio of omega-6/omega-3 essential fatty acids: evolutionary aspects. World Rev Nutr Diet 2003;92:1-22.
36. Calder PC. n-3 Polyunsaturated fatty acids, inflammation, and inflammatory diseases. Am J Clin Nutr 2006;83(6 Suppl):
1505S-19S.
37. Linn T, Noke M, Woehrle M, Kloer HU, Hammes HP, Litzl- bauer D, Bretzel RG, Federlin K. Fish oil-enriched diet and re- duction of low-dose streptozocin-induced hyperglycemia. In- hibition of macrophage activation. Diabetes 1989;38:1402-11.
38. Gonzalez-Periz A, Horrillo R, Ferre N, Gronert K, Dong B, Moran-Salvador E, Titos E, Martinez-Clemente M, Lopez-Par- ra M, Arroyo V, Claria J. Obesity-induced insulin resistance and hepatic steatosis are alleviated by omega-3 fatty acids: a role for resolvins and protectins. FASEB J 2009;23:1946-57.
39. Kang JX. The importance of omega-6/omega-3 fatty acid ratio in cell function. The gene transfer of omega-3 fatty acid desatu- rase. World Rev Nutr Diet 2003;92:23-36.