• 검색 결과가 없습니다.

Triglyceride Regulates the Expression of M1 and M2 Macrophage-specific Markers in THP-1 Monocytes

N/A
N/A
Protected

Academic year: 2021

Share "Triglyceride Regulates the Expression of M1 and M2 Macrophage-specific Markers in THP-1 Monocytes"

Copied!
7
0
0

로드 중.... (전체 텍스트 보기)

전체 글

(1)

Biomedical Science Letters 2016, 22(4): 220~226 http://dx.doi.org/10.15616/BSL.2016.22.4.220 eISSN : 2288-7415

Triglyceride Regulates the Expression of M1 and M2 Macrophage-specific Markers in THP-1 Monocytes

Hyun-Kyung Kim

1,2,§

, Sung Hoon Kim

1,§

, Yeo Wool Kang

1

, Bohee Kim

1

, Ki-Jong Rhee

1

and Yoon Suk Kim

1,†

1

Department of Biomedical Laboratory Science, College of Health Sciences, Yonsei University, Wonju, Gangwon-do 26493, Korea

2

Department of Biomedical Laboratory Science, College of Natural Science, Gimcheon University, Gimcheon, Gyungbuk 39528, Korea

Hypertriglyceridemia induces atherosclerosis and accordingly is a major causative factor in cardiovascular diseases.

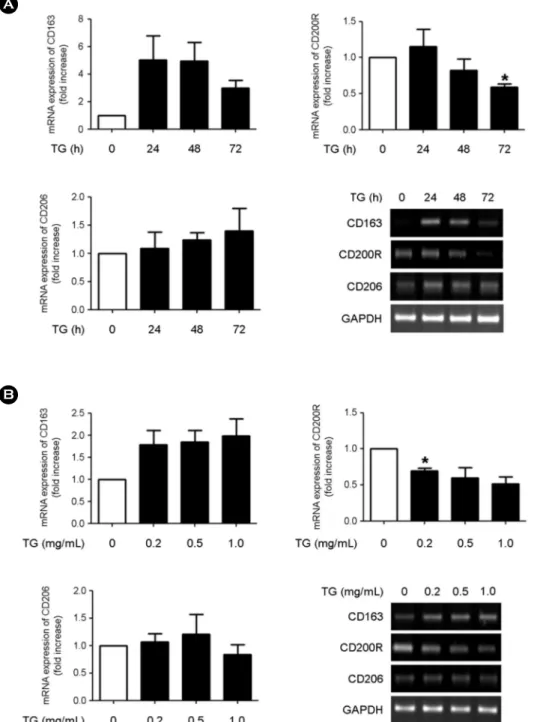
Macrophages that develop into foam cells are a crucial component in the development of atherosclerosis. Monocytes can be differentiated into M1 or M2 macrophages. M1 macrophages promote inflammatory responses, whereas M2 macrophages exhibit anti-inflammatory activity. Recently, we found that triglyceride (TG)-treated THP-1 monocytes express a variety of macrophage-specific surface markers, indicating that TG treatment could trigger the differentiation of monocytes into macrophages. In this study, we investigated whether TG-induced macrophages express the M1 or the M2 macrophage phenotype. THP-1 cells were treated with various concentrations of TG for different times and the expression of M1- and M2-specific markers was evaluated by RT-PCR. We found increased expression of M1 markers (CD40, CD80, and CD86) in TG-treated THP-1 cells in a TG dose- and time-dependent manner. The expression of M2 markers (CD163, CD200R, and CD206) showed variable responses to TG treatment. Taken together, our results indicate that TG treatment triggers the differentiation of monocytes into M1 macrophages, rather than into M2 macrophages, suggesting that TG contributes to pro-inflammatory responses.

Key Words: Triglyceride, M1/M2 macrophage, Differentiation, Inflammation, Marker

INTRODUCTION

Atherosclerosis is a risk factor for cardiovascular diseases, such as myocardial infarction and stroke, which are major causes of adult deaths. Atherosclerosis is a chronic vascular inflammatory disease involving the formation of atheroma, i.e., the accumulation of lipid materials in the inner layer of the artery (Hirata et al., 2011). During development of athero-

sclerosis, macrophages develop into foam cells and become the main component in atherosclerotic plaques (Hansson, 2005).

Macrophages differentiated from monocytes can be div- ided into two types, M1 and M2, which express distinct phenotype-specific markers. M1 macrophages express M1- specific markers including CD40, CD80, and CD86, whereas M2 macrophages express M2-specific markers such as CD- 163, CD200R, and CD206 (Li et al., 2012; Panackal et al.,

Brief Communication

*Received: October 28, 2016 / Accepted: November 14, 2016

§These authors contributed equally to this manuscript

Corresponding author: Yoon Suk Kim. Department of Biomedical Laboratory Science College of Health Sciences, Yonsei University Wonju 26493, Korea.

Tel: +82-33-760-2860, Fax: +82-33-760-2195, e-mail: yoonsukkim@yonsei.ac.kr

CThe Korean Society for Biomedical Laboratory Sciences. All rights reserved.

CCThis is an Open Access article distributed under the terms of the Creative Commons Attribution Non-Commercial License (http://creativecommons.org/licenses/by-nc/3.0/) which permits unrestricted non-commercial use, distribution, and reproduction in any medium, provided the original work is properly cited.

(2)

2015). Polarization to the M1 macrophage phenotype can be caused by IFN-γ or lipopolysaccharides; these macro- phages are involved in inflammatory responses via immunity activation. Polarization to M2 macrophages can be triggered by IL-4 or IL-13, and these macrophages are associated with anti-inflammatory activity via immunosuppression (Covarrubias et al., 2013). In a study of the association between macrophage phenotype and disease, patients with coronary artery disease showed increases of M1 macro- phages and inflammatory indicator such as C-reactive pro- tein. Furthermore, patients with increased M1 macrophages exhibited decreased HDL-C levels (Dopheide et al., 2007).

These results suggest that M1 macrophages are associated with coronary artery disease.

Hypertriglyceridemia is involved in cardiovascular dis- eases by inducing atherosclerosis (Murad et al., 2012).

According to a previous study, THP-1 monocytes treated with TG express a macrophage marker suggesting that TG par- tially triggers monocyte-to-macrophage differentiation (Lim et al., 2014). However, it remains unknown whether TG affects phenotype of differentiated macrophage. Here, we investigated which type of macrophage-specific marker is expressed in TG-treated THP-1 monocytes. Based on our results, we suggest that TG can modulate macrophage polari- zation during monocyte-to-macrophage differentiation.

MATERIALS AND METHODS

Materials

Lipofundin

®

MCT/LCT 20% (B. Braun Melsungen AG;

Melsungen, Germany) was used to deliver triglyceride into cells, as previously described (Lim et al., 2014). Lipofundin

®

- MCT/LCT 20% will be referred to as TG for convenience.

Soluble CD40 ligand was purchased from Peprotech (Rocky Hill, NJ, USA).

Cell culture

The THP-1 human acute monocytic leukemia cell line was purchased from ATCC (ATCC Number: TIB-202

TM

; Manassas, VA, USA). The cells were grown in RPMI 1640 media supplemented with heat-inactivated 10% fetal bovine serum, streptomycin (50 μg/mL), and penicillin (50 U/mL),

and maintained at 37℃ in a humidified atmosphere with 5%

CO

2

. THP-1 monocytes were treated with TG (1.0 mg/ mL) for the indicated times (0, 24, 48, or 72 h) or were treated with TG (0, 0.2, 0.5, or 1.0 mg/mL) for 48 h.

Cell viability test

The trypan blue dye exclusion assay was used to measure cell viability, as previously described (Kim et al., 2016).

Trypan blue stain solution (10 μL) was mixed with the cell suspension (10 μL) and unstained viable cells were counted using a hemocytometer (Marienfeld, LaudaKönigshofen, Germany). Each experiment was performed at least three times and the results are expressed as means ± SEM for each group.

RNA extraction and reverse transcriptase polymerase chain reaction

Total RNA was extracted from cultured THP-1 cells using TRIzol

®

reagent according to the manufacturer's instructions (Invitrogen, Thermo Fisher Scientific, Waltham, MA, USA).

Reverse transcriptase polymerase chain reaction (RT-PCR) was performed as previously described (Yoo et al., 2015).

Complementary DNA (cDNA) was synthesized using the

Moloney Murine Leukemia Virus Reverse Transcriptase Kit

(Invitrogen) and random hexamers (Invitrogen). cDNA was

synthesized for 10 min at 25℃, 50 min at 37℃, and 15 min

at 70℃. RT-PCR was performed as previously described

(Yoo et al., 2015). cDNA amplification using 0.2 U of the

Taq Premix PCR Kit (Genet Bio, Chungnam, Korea) was

performed in a thermocycler using specific primers pur-

chased from Genotech (Daejeon, Korea). The sequences of

the specific primers are listed in Table 1. Glyceraldehyde-

3-phosphate dehydrogenase (GAPDH) was used as a loading

control. Amplified PCR products were electrophoresed on

a 2% (w/v) agarose gel with 0.5% TBE buffer. PCR pro-

duct size was assessed by size comparisons with a 100-bp

DNA ladder (BioPrince, Seoul, Korea). The electrophoresed

gel was stained with ethidium bromide for 10 min and

destained in distilled water for 20 min. After the gels were

washed, gel images were obtained using Gel Doc (Bio-Rad,

Hercules, CA, USA). The band intensities of PCR products

were measured using Image Lab

TM

(version 4.1, Bio-Rad).

(3)

Statistical analysis

The statistical analysis was performed using GraphPad Prism 5 (GraphPad Software Inc., San Diego, CA, USA). All experiments were performed at least three times. Differences in means among groups were evaluated using Student's t-test, and P < 0.05 was considered significant. Values are shown as means and standard error of the mean (SEM).

RESULTS AND DISCUSSION

TG induces up-regulation of M1 macrophage-specific markers in THP-1 monocytes

Monocytes can be differentiated into M1 or M2 macro- phages according to the microenvironment. We reported previously that TG can partially trigger the differentiation of monocytes to macrophages (Lim et al., 2014). In this study, we investigated whether TG influences macrophage polarization as well as macrophage differentiation. THP-1 monocytes were treated with various concentrations of TG for different times. Next, the mRNA expression of M1 macrophage specific-markers including CD40, CD80 and CD86 was assessed. As shown in Fig. 1, TG up-regulated the expression of M1 macrophage markers tested in a TG dose- and time-dependent manner. M1 macrophages have microbicidal activity and release proinflammatory cytokines, such as TNF-α and IL-12, which are associated with Th1- mediated inflammatory responses (Li et al., 2012; Covarrubias et al., 2013). Furthermore, recent studies have reported that M1 macrophages may be involved in atherosclerosis (Hirata

et al., 2011; Fadini et al., 2014). Patients with coronary artery disease and hypercholesterolemia show an increased ratio of M1/M2 macrophages and an association with athero- sclerosis (Hirata et al., 2011; Fadini et al., 2014). Based on above data, it appears that TG has an influence on the differ- entiation of monocytes to the M1 macrophage type. It is probable that TG may be involved in the development of atherosclerosis by stimulating differentiation of monocyte into M1 macrophages which may play a role in atherosclerosis.

TG induces down-regulation of M2 macrophage specific marker, CD200R

We found that TG increases the expression of M1-specific surface markers in monocytes treated with TG. Next, we investigated whether TG influences the expression of the M2 markers including CD163, CD200R, and CD206. The expression patterns of CD163 and CD206 in TG dose- dependent experiment were different from the expression patterns in time-dependent experiment (Fig. 2). However, the expression of CD200R was down-regulated both in a time- and dose-dependent manner (Fig. 2). CD200R is a transmembrane glycoprotein containing an immunoglobulin domain and its ligand is CD200; it is mostly expressed on myeloid cells, and is a known marker for M2 macrophages (Walker et al., 2009; Panackal et al., 2015). Recent studies of CD200R have demonstrated its role in the regulation of inflammatory responses (Zhang et al., 2004; Walker et al., 2009). The CD200-CD200R interaction inhibits the release of inflammatory cytokines via the suppression of the acti- vation of inflammatory cells by the activation of anti- Table 1. PCR primers used for the assessment of mRNA levels

Gene Primer sequence

Forward Reverse

CD40 CAGCCAGGACAGAAACTGGTGAGT CTTCTTCACAGGTGCAGATGGTGTC

CD80 CACTTCTGTTCAGGTGTTATCC GGTGTAGGGAAGTCAGCTTTG

CD86 CTCTTTGTGATGGCCTTCCTG CTTAGGTTCTGGGTAACCGTG

CD163 ACATAGATCATGCATCTGTCATTTG CATTCTCCTTGGAATCTCACTTCTA

CD200R CTTCCTGTTCCAGGTGCCAAA GCCTCAGATGCCTTCACCTTG

CD206 CGGTGACCTCACAAGTATCCACAC TTCATCACCACACAATCCTCCTGT

GAPDH CGGGAAGCTTGTCATCAATGG GGCAGTGATGGCATGGACTG

(4)

inflammatory signaling (Zhang et al., 2004). Therefore, decreased CD200R on the cell surface may increase the inflammatory response in inflammatory diseases. Indeed,

in the microglia of patients with Alzheimer's disease, a type of chronic inflammation, the expression of CD200R is de- creased (Walker et al., 2009). Furthermore, CD200-deficient Fig. 1. TG induces up-regulation of M1 macrophage markers in THP-1 monocytes. (A) THP-1 monocytes were treated with TG (1.0 mg/mL) for the indicated time periods (0, 24, 48, or 72 h). (B) THP-1 monocytes were treated with TG (0, 0.2, 0.5, or 1.0 mg/mL) for 48 h.

RT-PCR was performed to assess the mRNA levels of CD40, CD80, and CD86 after treatment for the indicated time periods using the

indicated concentrations of TG. GAPDH was used as an internal control. A densitometric analysis was performed and the expression level

of THP-1 monocytes without TG treatment was set as 1.0. RT-PCR images are representative of three independent experiments. Significant

differences were determined using the Student's t-test. *P < 0.05

(5)

mice showed enhanced macrophage activity with increased mortality (Snelgrove et al., 2008). Here we found that TG decreases the expression of CD200R on THP-1 cells. It may

cause increase of inflammatory responses in the development of atherosclerosis.

Fig. 2. TG decreases the expression of CD200R. (A) THP-1 monocytes were treated with TG (1.0 mg/mL) for the indicated time periods (0, 24, 48, or 72 h). (B) THP-1 monocytes were treated with TG (0, 0.2, 0.5, or 1.0 mg/mL) for 48 h. RT-PCR was performed to assess the mRNA levels of CD163, CD200R, and CD206 for the indicated time periods and in the indicated concentrations of TG. GAPDH was used as an internal control. A densitometric analysis was performed and the expression level of THP-1 monocytes without TG treatment was set as 1.0. RT-PCR images are representative of three independent experiments. Significant differences were determined by the Student's t-test.

*P < 0.05

(6)

CD40 is not associated with cell death in TG-treated THP-1 monocytes.

CD40 is a member of the tumor necrosis factor receptor (TNFR) superfamily and is expressed on B cells and antigen- presenting cells (Noelle et al., 1992). CD40 has also been detected on the surfaces of M1 macrophages (Li et al., 2012).

Since CD40 functions as a transmembrane signal transducer, it plays a critical role in the regulation of immune responses (Kawabe et al., 2011). Previous studies have reported that CD40 activation via interactions with its ligand (CD40L) induces cell death in various cell types (Afford et al., 1999;

Elmetwali et al., 2010). Meanwhile, there were reports suggesting that CD40 is associated with atherosclerosis.

Blocking the interaction between CD40 and CD40L causes a decrease in atherosclerosis (Mach et al., 1998). Since we found that TG up-regulates CD40 which is known to be involved in cell death or atherosclerosis, we investigated whether CD40 induces cell death in TG-treated THP-1 cells.

We measured the viability of TG-treated THP-1 monocytes in the absence or presence of the CD40 ligand. Cell viability was not changed in response to CD40L (Fig. 3). These results show that CD40 expressed in TG-treated THP-1 monocytes is not involved in cell death. It may be possible that CD40 expressed in TG-treated cells may be associated with athero- sclerosis, not cell death.

In conclusion, TG enhances the expression of M1 macro- phage markers including CD40, CD80 and CD86 in THP-1 cells and decreases the expression of M2 macrophage markers, CD200R. Based on these results, we suggest that TG affects differentiation of monocytes into M1 macro- phages which may be involved in pro-inflammatory re- sponses in the development of atherosclerosis.

Acknowledgements

This work was supported by the 2015 Gimcheon University Research Grant.

Conflict of interest

There is no conflict of interest for all authors.

REFERENCES

Afford SC, Randhawa S, Eliopoulos AG, Hubscher SG, Young LS, Adams DH. CD40 activation induces apoptosis in cultured human hepatocytes via induction of cell surface fas ligand expression and amplifies fas-mediated hepatocyte death during allograft rejection. J Exp Med. 1999. 189: 441-446.

Covarrubias A, Byles V, Horng T. ROS sets the stage for macro- phage differentiation. Cell Research. 2013. 23: 984-985.

Dopheide JF, Sester U, Schlitt A, Horstick G, Rupprecht HJ, Munzel T, Blankenberg S. Monocyte-derived dendritic cells of patients with coronary artery disease show an increased expression of costimulatory molecules CD40, CD80 and CD86 in vitro.

Coron Artery Dis. 2007. 18: 523-531.

Elmetwali T, Young LS, Palmer DH. CD40 ligand-induced car- cinoma cell death: a balance between activation of TNFR- associated factor (TRAF) 3-dependent death signals and suppression of TRAF6-dependent survival signals. J Immunol.

2010. 184: 1111-1120.

Fadini GP, Simoni F, Cappellari R, Vitturi N, Galasso S, Vigili de Kreutzenberg S, Previato L, Avogaro A. Pro-inflammatory monocyte-macrophage polarization imbalance in human hyper- cholesterolemia and atherosclerosis. Atherosclerosis. 2014. 237:

805-808.

Hansson GK. Inflammation, atherosclerosis, and coronary artery disease. N Engl J Med. 2005. 352: 1685-1695.

Hirata Y, Tabata M, Kurobe H, Motoki T, Akaike M, Nishio C, Higashida M, Mikasa H, Nakaya Y, Takanashi S, Igarashi T, Kitagawa T, Sata M. Coronary atherosclerosis is associated Fig. 3. CD40 is not implicated in cell death in TG-stimulated

THP-1 cells. THP-1 monocytes were treated with TG (1.0 mg/

mL) in the absence or presence of 1.0 μg/mL CD40 ligand for the

indicated times (24, 48, or 72 h). Cell viability (%) was measured

in a trypan blue dye exclusion assay.

(7)

with macrophage polarization in epicardial adipose tissue. J Am Coll Cardiol. 2011. 58: 248-255.

Kawabe T, Matsushima M, Hashimoto N, Imaizumi K, Hasegawa Y. CD40/CD40 ligand interactions in immune responses and pulmonary immunity. Nagoya J Med Sci. 2011. 73: 69-78.

Kim SH, Kang YW, Lee JY, Kim HK, Jung BC, Kim BH, Kim DJ, Kim YS. Ultraviolet B (UVB) induces down-regulation of parkin gene expression. Biomedical Science Letters. 2016.

22: 18-23.

Li W, Katz BP, Spinola SM. Haemophilus ducreyi-induced interleukin-10 promotes a mixed M1 and M2 activation pro- gram in human macrophages. Infect Immun. 2012. 80: 4426 -4434.

Lim JW, Kim YS, Kim SH, Cho YJ, Lee MH, Jung BC, Jung DJ, Rhee K-J. Triglyceride enhances susceptibility to TNF-α- induced cell death in THP-1 cells. Gen Genom. 2014. 36: 87 -93.

Mach F, Schonbeck U, Sukhova GK, Atkinson E, Libby P.

Reduction of atherosclerosis in mice by inhibition of CD40 signaling. Nature. 1998. 394: 200-203.

Murad MH, Hazem A, Coto-Yglesias F, Dzyubak S, Gupta S, Bancos I, Lane MA, Erwin PJ, Berglund L, Elraiyah T, Montori VM. The association of hypertriglyceridemia with cardiovas- cular events and pancreatitis: a systematic review and meta- analysis. BMC Endocr Disord. 2012. 12: 2.

Noelle RJ, Ledbetter JA, Aruffo A. CD40 and its ligand, an essential ligand-receptor pair for thymus-dependent B-cell activation.

Immunol Today. 1992. 13: 431-433.

Panackal AA, Wuest SC, Lin YC, Wu T, Zhang N, Kosa P, Komori M, Blake A, Browne SK, Rosen LB, Hagen F, Meis J, Levitz SM, Quezado M, Hammoud D, Bennett JE, Bielekova B, Williamson PR. Paradoxical immune responses in non-HIV cryptococcal meningitis. PLoS Pathog. 2015. 11: e1004884.

Snelgrove RJ, Goulding J, Didierlaurent AM, Lyonga D, Vekaria S, Edwards L, Gwyer E, Sedgwick JD, Barclay AN, Hussell T. A critical function for CD200 in lung immune homeostasis and the severity of influenza infection. Nat Immunol. 2008. 9:

1074-1083.

Walker DG, Dalsing-Hernandez JE, Campbell NA, Lue LF.

Decreased expression of CD200 and CD200 receptor in Alzheimer's disease: a potential mechanism leading to chronic inflammation. Exp Neurol. 2009. 215: 5-19.

Yoo TH, Lee MH, Park M, Lee JW, Woo HJ, Kim HW, Yang JY, Kwon HJ, Yeon MJ, Kim JB. Detection of EBV-encoded small RNA from diffuse large B-cell lymphoma patients by RT-PCR method. Biomedical Science Letters. 2015. 21: 227 -232.

Zhang S, Cherwinski H, Sedgwick JD, Phillips JH. Molecular

mechanisms of CD200 inhibition of mast cell activation. J

Immunol. 2004. 173: 6786-6793.

수치

Fig. 2. TG decreases the expression of  CD200R. (A) THP-1 monocytes were treated with TG (1.0 mg/mL) for the indicated time periods (0, 24, 48, or 72 h)

참조

관련 문서

Biochemical markers of bone turnover can be classified according to the process that underlie in markers of bone formation, products of the osteoblast

Two cyclic monomers of one a nucleophile and the other an electrophile can undergo a ring opening polymerization to produce a 1:1 alternating copolymer. to produce a

Third, objet, which appeared in the interior design, creates a form of space that makes mental process that triggers observers a sensation and a desire

 Rule #1: Express currents in terms of node voltages: Count the number of unknown node voltages and the required number of KCL equations to solve..  Rule #2: If a node

FBG: fasting blood glucose, TC: total cholesterol, TG: triglyceride, HDL-C: high density lipoprotein-cholesterol, LDL-C: low density lipoprotein-cholesterol,

The Article 75 section 1 of the German Federal Admin- istrative Process Law regulates about the effect that when a decision of a large scale

In addition, a recent study reported that anxiety and depression were associated with increased medical costs in general medical inpatient suggesting that anxiety

Characterization of the glycoprotein D gene products of equine herpesvirus 1 using a prokaryotic cell expression vector.. Expression of equine herpesvirus-1 glycoprotein D by