서 론
비만은 여러가지 질병의 사망률 및 이환율을 증가시키는 주요한 요인으로 알려져 있다.1 뿐만 아니라 미국에서는 연간 약 32만 명에 이르는 사람들이 비만과 관련된 질병으로 인하여 사망을 한다고 알려져 있으며,2 최근 우리나라에서도 비만에 대한 위험성이 인지 되고 있다.3,4 그러나 비만 예방을 위한 노력에도 불구하고 식생활의 서구화 등 여러가지 원인으로 인하여 우리나라 20세 이상 성인의
비만율은 꾸준히 증가하고 있다. 최근 발표된 선행연구에서는 국민 건강보험공단 건강검진 자료를 토대로 2006년부터 2015년 동안 비 만 유병률은 29.7%에서 32.4%로 빠르게 증가하였고,5 특히 복부비 만은 15.1%에서 17.7%로 꾸준히 증가하였음을 발표하였다.6
1950년대 후반부터 비만과 폐기능과의 관련성이 알려져 왔으며, 여러 선행 연구들을 통하여 폐질환자의 폐기능이 체지방량과의 유 의한 관련성이 있다는 것이 보고된 바 있다.7 일례로, 고도 비만인들 을 대상으로 한 선행 연구에서 비만군의 1초간노력성호기량(forced Allergy Asthma Respir Dis 9(3):171-179, July 2021 https://doi.org/10.4168/aard.2021.9.3.171 ORIGINAL ARTICLE
Correspondence to: Sun-Sin Kim https://orcid.org/0000-0002-0664-3256
Seoul National University Hospital Healthcare System Gangnam Center, Seoul, 152 Teheran-ro, Gangnam-gu, Seoul 06236, Korea
Tel: +82-2-2112-5642, Fax: +82-2-2112-5794, Email: [email protected]
*These authors contributed equally to this study as co-first authors.
© 2021 The Korean Academy of Pediatric Allergy and Respiratory Disease The Korean Academy of Asthma, Allergy and Clinical Immunology This is an Open Access article distributed under the terms of the Creative
(Allergy Asthma Respir Dis 2021;9:171-179)
40세 이상 건강한 성인에서 시간에 따른 체지방량과 복부지방률 변화가 폐기능 감소에 미치는 영향
안경민,1,* 이소희,1,2,* 김선신1,2
1서울대학교 의과대학 내과학교실, 2서울대학교병원 헬스케어시스템 강남센터
The effect of changes in total body fat amount and abdominal fat ratio on lung function decline in healthy adults
Kyung-Min Ahn,1,* So-Hee Lee,1,2,* Sun-Sin Kim1,2
1Department of Internal Medicine, Seoul National University Hospital, Seoul; 2Seoul National University Hospital Healthcare System Gangnam Center, Seoul, Korea
Purpose: Many studies have shown that obesity is one of the major causes of lung function decline. However, a longitudinal study of the correlation between changes in obesity degree and lung function is still lacking. This study aimed to analyze alterations in lung function according to changes in body and abdominal fat amount over time in healthy individuals.
Methods: A retrospective cohort study of individuals who received annual health screening was performed. Individuals who under- went health screening at least 3 times with follow-up periods more than 5 years were included. Using a linear mixed model, we ana- lyzed associations between the change in total body fat amount/abdominal fat ratio and lung function decline over time by divid- ing each quartile according to the fat change rate.
Results: A total of 15,484 individuals over 40 years old was enrolled prospectively. A longitudinal increase in total body fat amount over time was associated with a predicted value of forced expiratory volume in 1 second (FEV1p; %) and predicted value of forced vi- tal capacity (FVCp; %) declines, regardless of sex. A similar phenomenon was observed between an increase in abdominal fat ratio and FEV1p/FVCp decline, which was predominant in males. In addition, the change in abdominal fat ratio showed a significant cor- relation with differences in the initial values of FEV1p and FVCp after 40 years old.
Conclusion: Increases in total body fat amount and abdominal fat ratio may cause lung function decline over time. (Allergy Asthma Respir Dis 2021;9:171-179)
Keywords: Total body fat amount, Abdominal fat ratio, Lung function, Forced expiratory volume in 1 second, Forced vital capacity
expiratory volume in 1 second, FEV1)은 정상 체중군에 비하여 낮 다는 보고가 있었다.8 비만은 천식을 포함한 저환기장애, 폐쇄수면 무호흡증후군(obstructive sleep apnea syndrome) 등과 같은 다양 한 호흡기질환에 영향을 미치고, 질환의 빠른 유병률 증가에 영향 을 끼치는 것으로도 알려져 있다.9,10 그럼에도 불구하고 비만이 폐 기능에 영향을 미치는 정확한 기전을 알려져 있지 않으며, 현재까 지 진행된 연구들에서 폐기능과 비만도의 단순관련성에 대한 근거 들을 살펴본 바 있으나,11,12 시간에 따른 비만도의 변화에 대한 폐기 능과의 연관성을 살펴본 연구는 현재까지 보고된 바 없었다. 또한 현재까지 대규모의 일반인들을 대상으로 시행된 연구는 없어서, 향후 일반인들의 건강증진에 활용하기 위한 기초자료로는 활용되 기에는 매우 부족한 실정이다.
따라서 우리는 비만 평가에 주요하게 이용되는 생체전기 임피던 스 측정법을 통해 측정된 일반인들의 체지방량과 폐기능 수치 간의 상관관계를 분석하여 일반 성인에서 시간이 지남에 따른 체지방량 및 복부지방률 변화에 따른 폐기능의 변화를 분석해보고자 한다.
대상 및 방법
1. 대상
2004년 10월 1일부터 2019년 5월 31일까지 서울대학교병원 헬스 케어시스템 강남센터를 방문한 수진자들 중 체지방량, 복부지방률 검사가 포함된 건강검진을 받은 40세 이상의 성인들을 대상으로 하 였다. 충분한 기간 동안의 폐기능 변화량을 측정하기 위하여 추적 검사 기간이 평균 5년 이상이며 3회 이상의 건강검진에서 폐기능을
측정받은 사람들을 연구 대상으로 한정하였다. 정상인에서의 폐기 능 변화를 측정하기 위하여 첫 방문 당시 정상 폐기능을 보이는 수 검자들에 국한하였다[정상 추정치에 대한 1초간노력성호기량 (predicted value of FEV1 (FEV1p) ≥80%, 정상 추정치에 대한 노력 성폐활량비율(predicted value of force vital capacity (FVCp) ≥80%, FEV1와 FVC의 비율(FEV1/FVC) ≥80%]. 또한 대상자들 중 천식, 만성폐쇄성폐질환, 폐섬유증, 폐암과 같이 폐기능에 영향을 미칠 수 있는 호흡기질환자들은 건강검진 설문지의 답변을 반영하여 제 외하였다.
2. 데이터 수집 및 분석
수검자는 일반적으로 건강검진에서 시행하게 되는 문진을 통한 병력청취와 신체 계측을 받았다. 이를 통하여 대상자들의 성별, 연 령, 추적 검사 기간, 체질량지수(body mass index), 질환 동반 유무 등의 정보를 알 수 있었다. 한편 대상자들은 폐활량 측정을 위한 폐 기능검사를 시행하였으며(MasterScreen Pneumo, Viasys Respira- tory Care, Inc., San Diego, CA, USA) 측정방식은 미국흉부학회와 유럽호흡기학회의 가이드라인을 따랐다.13 이들의 FEV1, FVC, FEV1/FVC 비의 절대값(mL)을 측정하고 ‘한국인의 폐활량 정상예 측식’을 참고하여 FEV1p과 FVCp 등의 예측값을 계산하였다.14 또 한 지방량 분석을 위하여 최근 임상에서 비만을 진단하는데 활발 히 사용되고 있는 체구성 평가방법인 생체 전기 저항측정법(bio- electrical impedance analysis)에 의하여 전신체지방량을(total body fat amount, kg) 측정하였다(InBody 720, Biospace Co, Seoul, Korea). 또한 복부지방률(abdominal fat ratio)은 허리/엉덩이 둘레 Table 1. Characteristics of each quartile (Q1–Q4) according to the rate of change in total fat amount
Characteristic Male Female
Q1 (n= 2,348) Q2 (n= 2,348) Q3 (n= 2,348) Q4 (n= 2,348) Q1 (n= 1,523) Q2 (n= 1,523) Q3 (n= 1,523) Q4 (n= 1,523) Age (yr) 50.56± 7.32 50.78± 7.31 51.02± 7.51 51.02± 7.83 49.42± 7.25 49.50± 7.12 49.58± 6.85 49.38± 6.99 Height (cm) 170.0± 5.44 170.0± 5.53 170.4± 5.52 171.4± 5.63 158.3± 5.10 158.4± 5.13 158.3± 5.00 158.5± 4.75 BMI (kg/m2) 24.47± 2.45 24.73± 2.70 24.29± 2.38 24.47± 2.74 21.657± 2.57 21.73± 2.40 21.98± 2.42 22.85± 2.81 Smoker 1,822 (77.6) 1,807 (78.0) 1,863 (79.3) 1,936 (82.5) 96 (6.3) 75 (4.9) 89 (5.9) 113 (7.2) Follow-up (yr) 8.42± 2.13 8.33± 2.16 8.20± 2.19 8.31± 2.06 8.29± 2.34 8.16± 2.36 8.34± 2.35 8.40± 2.18 FVC (mL) 4,243± 611 4,238± 613 4,247± 613 4,280± 657 3,058± 435 3,043± 431 3,043± 438 3,076± 417 FVCp (%) 96.31± 10.89 96.16± 10.80 96.06± 10.94 95.51± 11.03 97.81± 11.47 97.16± 11.00 97.33± 11.61 98.03± 11.02 FEV1 (mL) 3,388± 529 3,386± 549 3,389± 544 3,408± 575 2,532± 380 2,512± 382 2,515± 382 2,541± 367 FEV1p (%) 103.3± 12.79 103.2± 13.02 103.2± 13.07 102.6± 12.91 106.6± 13.23 105.7± 12.78 106.0± 13.35 106.6± 12.80 FEV1/FVC (%) 79.84± 6.21 79.89± 6.52 79.79± 6.31 79.62± 6.03 82.79± 5.31 82.55± 5.52 82.64± 5.21 82.60± 6.03 Fatamt (kg) 16.16± 4.45 15.58± 3.96 15.88± 4.12 17.25± 5.00 15.31± 4.24 15.40± 4.04 15.84± 3.98 17.20± 4.68 FatamtD (/yr)* -0.1428± 0.12 0.047± 0.034 0.170± 0.037 0.380± 0.132 -0.087± 0.11 0.091± 0.031 0.205± 0.035 0.416± 0.141 Abdfat 0.895± 0.037 0.819± 0.036 0.894± 0.037 0.903± 0.042 0.854± 0.043 0.855± 0.043 0.860± 0.042 0.870± 0.046 Values are presented as mean± standard deviation or number (%).
BMI, body mass index; FVC, forced vital capacity; FVCp, predicted value of FVC; FEV1, forced expiratory volume in 1 second; FEV1p, predicted value of FEV1; Fatmat, total fat amount; FatamtD, total fat amount decline rate; Abdfat, abdominal fat ratio.
*P< 0.001, statistically significant difference in characteristics between sexes.
비(waist-to-hip circumference ratio)15 수치로서 InBody 기기를 통 해 자동으로 측정하였다. 세계보건기구(World Health Organiza- tion)에서 추천한 기준에 의거하여 복부지방률이 남성의 경우 0.9, 여성의 경우 0.85 초과 시 복부비만으로 정의하였다.16
이 연구에서는 시간에 따른 체지방량과 복부지방률의 변화율 을 구하고, 변화율 사분위값(quartile, Q)에 따라 대상군을 4개의 부류로 나누어 각 그룹에서 시간에 따른 폐기능 변화를 살펴보았 다. 신체계측과 폐기능에 있어서 남녀의 차이가 큰 점을 고려하여 성별에 따라 나누어서 분석하였다.
3. 통계 분석
이 연구의 분석 결과는 평균과 표준편차로 표시하였고, 통계적
유의성을 위해 선형 혼합 모델(Linear mixed model)을 사용하여 시간에 따른 폐기능 변화를 구하고 그룹 간의 차이를 비교하였다.
R ver. 4.03 (R Foundation for Statistical Computing, Vienna, Aus- tria) 소프트웨어를 사용하여 분석을 수행하였고, P<0.05일 경우 통계적인 유의성이 있는 것으로 간주하였다.
결 과
1. 대상 환자의 특성
총 15,484명의 성인이 분석에 포함되었고 이 중 여자가 6,092명 (39.3%), 남자가 9,392명(60.7%)이었다. 처음 폐기능검사 시 평균 연 령(±표준편차)은 여자가 49.47±7.06세, 남자가 50.84±7.50세였
0 5 10 15 Year
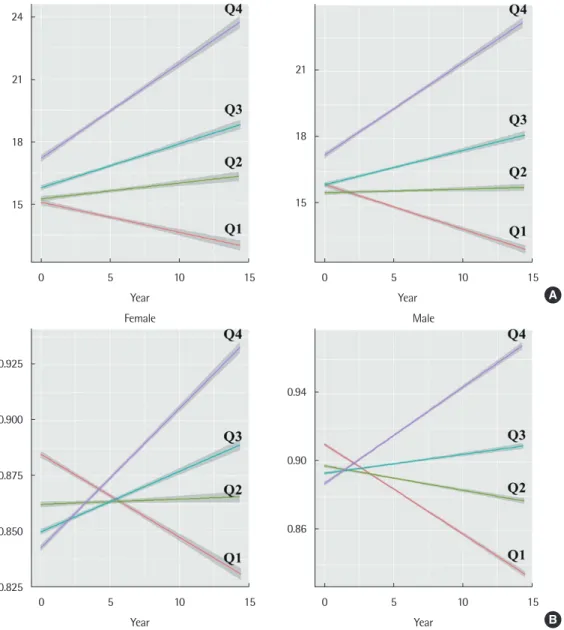
Fig. 1. Four groups (quartiles) according to the rate of change over time. (A) Fat amount. (B) Abdominal fat ratio.
24
21
18
15
0 5 10 15 Year
Female
Year 21
18
15
0 5 10 15 Male
A
0.925
0.900
0.875
0.850
0.825
Female
0.94
0.90
0.86
0 5 10 15 Year
Male
B
으며 평균 추적 기간은 8.32±2.14년이었고, 평균 6.14±2.07회의 폐기능을 측정했다(Table 1).
이들은 시간에 따른 체지방량(Fig. 1A)과 복부지방률(Fig. 1B)의 변화율의 사분위값에 따라 네 그룹으로 나누었는데 가장 큰 음의 변화를 보인 그룹을 Q1, 가장 큰 양의 변화를 보인 그룹을 Q4로 명 명하였다. 각 그룹의 기저 임상적 특징은 Table 1과 Table 2에 제시 하였다.
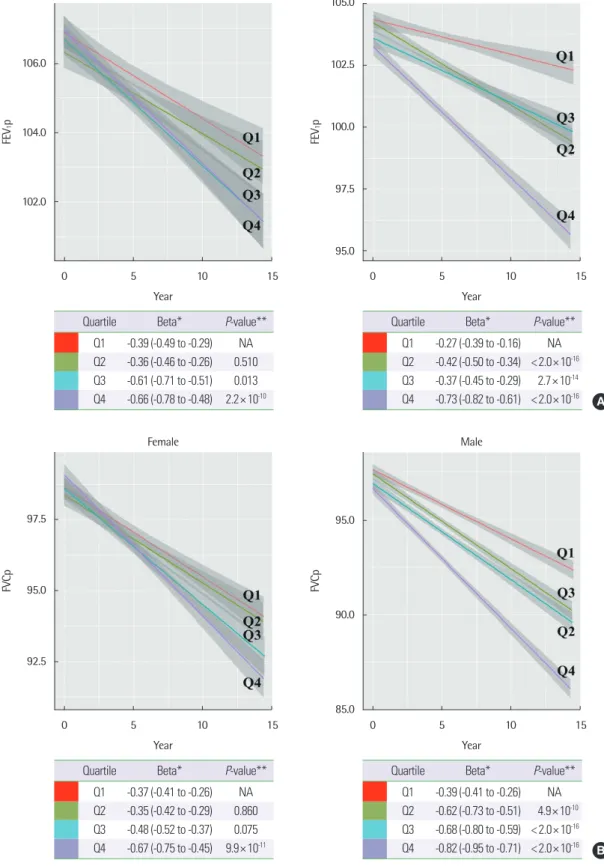
2. 체지방량 및 복부지방률의 증가가 폐기능에 미치는 영향 시간에 따른 체지방량 증가율과 FEV1p, FVCp의 감소율은 전 그 룹에서 양의 상관관계를 보였다. 특히 체지방량의 증가가 가장 작은 그룹(Q1)에 비해 가장 큰 그룹(Q4)에서 FEV1p, FVCp의 감소율은 매우 유의하게 증가하였는데(Q1 vs. Q4; 여: P=2.2×10⁻¹⁰, 남: P<
2.0×10⁻¹⁶), 이 현상은 남녀 모두에서 관찰되었다(Fig. 2A, B). 그러 나 남녀 모두에서 체지방량의 변화와 FEV1/FVC비와는 연관성을 보이지 않았다(Fig. 2C).
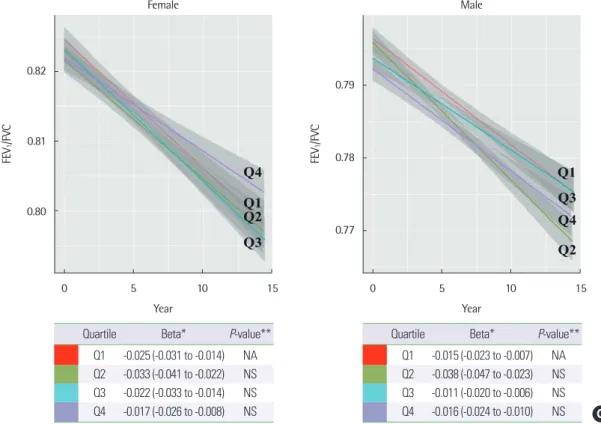
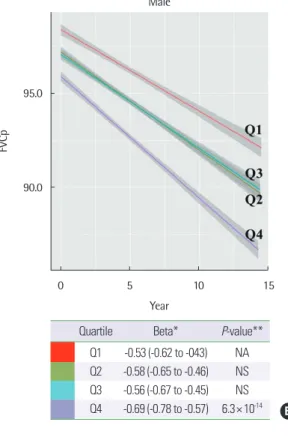
복부지방률의 증가율도 체지방량과 마찬가지로 FEV1p, FVCp 의 감소율과 전 그룹에서 양의 상관관계를 보였다(Fig. 3A, B). 복부 지방률의 증가가 가장 작은 그룹(Q1)과 가장 큰 그룹(Q4)을 비교하 였을 때 FEV1p, FVCp 감소율에 매우 유의한 차이를 보였는데, 복 부비만도의 증가가 폐기능 감소에 미치는 영향은 여자보다 남자에 서 훨씬 두드러졌다(FEV1p; 여: P = 6.7×10⁻³, 남: P<2.0×10⁻¹⁶, FVCp; 여: P= 0.034, 남: P= 6.3×10⁻¹⁴). 한편 복부지방률과 FEV1/ FVC비와는 연관성을 보이지 않았다(Fig. 3C).
3. 복부지방률의 변화에 따른 기저 폐기능의 차이
복부지방률 변화에 따른 Q1과 Q4 그룹의 FEV1p, FVCp 기저치 (이 연구 40세 측정값에 해당, Table 2)는 남녀 모두에서 유의한 차 이를 보였다(P<0.05) (Fig. 3A, B). 흥미롭게도 이 차이는 시간이 지 나도 그대로 유지되었는데 이는 복부지방률에 따라 40세 이후 FE- V1p, FVCp 감소의 출발점이 유의하게 차이가 나는 것을 시사하고 있다.
고 찰
이 연구의 결과 40세 이후 기저질환이 없는 건강한 일반인에서 시간에 따른 체지방량과 복부지방률의 증가가 FEV1p 및 FVCp 감 소량과의 유의한 연관성이 있음을 확인하였다. 이 결과는 현재까지 의 연구 중 가장 큰 규모의 종단 연구로, 성인에서 체지방률 증가와 FEV1 또는 FVC과 통계적으로 유의한 음의 상관관계로 관련된 기 존의 연구들과 부합하였다.17 그러나 기존의 연구들이 대부분 1회 측정값들을 이용한 단면적인 분석에 그쳤던 반면, 이 연구는 여러 번 반복 측정된 데이터를 이용해서 신체계측과 폐기능의 시간에 따른 변화 간의 연관성을 확인하였다는 데에 큰 의의가 있다.
그간 여러 연구에서 체지방량의 증가가 폐용량의 감소에 영향을 미친다는 보고가 있었는데, 2017년 소아와 성인에서 비만과 폐기 능에 대한 연구들을 메타분석한 자료에 의하면 비만은 FEV1, FVC, total lung capacity, reserve volume 등 여러 가지 폐기능 지표에 큰 영향을 끼친다.18 특히 이 메타연구에서 비만에 의한 FEV1, FVC의 감소는 소아보다 성인에서 더욱 두드러지는데,19-22 현재까지 정확한 Table 2. Characteristics of each quartile(Q1–Q4) according to the rate of change in abdominal fat ratio
Characteristic Male Female
Q1 (n= 2,348) Q2 (n= 2,348) Q3 (n= 2,348) Q4 (n= 2,348) Q1 (n= 1,523) Q2 (n= 1,523) Q3 (n= 1,523) Q4 (n= 1,523) Age (yr) 53.49± 8.08 50.88± 7.23 49.99± 7.11 49.02± 6.73 52.44± 8.05 49.98± 6.99 48.12± 6.00 47.34± 5.83 Height (cm) 167.5± 5.25 169.6± 5.01 171.2± 4.98 173.6± 5.08 155.3± 4.65 157.5± 4.43 159.3± 4.35 161.4± 4.39 BMI (kg/m2) 25.58± 2.70 24.49± 2.39 24.32± 2.45 24.12± 2.60 22.97± 2.87 22.12± 2.45 21.64± 2.40 21.48± 2.39 Smoker 1,762 (75.0) 1,823 (77.6) 1,867 (79.5) 1,936 (82.5) 75 (4.9) 93 (6.1) 86 (5.6) 119 (7.8) Follow-up (yr) 8.39± 2.05 8.34± 2.22 8.13± 2.17 8.40± 2.09 8.35± 2.36 8.18± 2.43 8.2± 2.31 8.42± 2.12 FVC (mL) 4,066± 610 4,205± 600 4,322± 605 4,415± 624 2,904± 435 3,017± 411 3,108± 408 3,191± 414 FVCp (%) 97.06± 11.23 96.04± 10.92 96.16± 10.65 94.78± 10.73 99.52± 11.87 98.01± 11.49 96.79± 10.96 96.02± 10.73 FEV1 (mL) 3,238± 545 3,358± 528 3,456± 539 3,520± 544 2,389± 383 2,419± 357 2,576± 358 2,644± 365 FEV1p (%) 104.5± 13.51 103.0± 12.95 103.2± 12.65 101.5± 12.50 109.0± 14.07 106.7± 13.12 105.1± 12.15 104.0± 12.23 FEV1/FVC (%) 79.63± 6.54 79.89± 6.22 79.98± 6.30 79.80± 6.51 82.32± 5.71 82.69± 5.96 82.99± 5.81 82.99± 6.09 Fatamt(kg) 16.59± 4.34 16.07± 4.34 15.98± 4.42 16.26± 4.65 17.18± 4.73 15.95± 4.06 15.37± 4.07 15.34± 4.10 Abdfat 0.91± 0.037 0.89± 0.036 0.89± 0.036 0.88± 0.040 0.88± 0.045 0.86± 0.039 0.84± 0.039 0.84± 0.039 AbdfatD (/yr)* -0.0048± 0.0021 -0.0011± 0.00069 0.0011± 0.00068 0.0049± 0.0026 -0.0032± 0.0021 0.00032± 0.00064 0.0024± 0.00061 0.0052± 0.0021 Values are presented as mean± standard deviation or number (%).
BMI, body mass index; FVC, forced vital capacity; FVCp, predicted value of FVC; FEV1, forced expiratory volume in 1 second; FEV1p, predicted value of FEV1; Fatmat, total fat amount; Abdfat, abdominal fat ratio; AbdfatD, abdominal fat ratio decline rate.
*P< 0.001, statistically significant difference in characteristics between sexes.
105.0
102.5
100.0
97.5
95.0
0 5 10 15 Year
Male
A FEV1p
106.0
104.0
102.0
0 5 10 15 Year
Female
FEV1p
Quartile Beta* P-value**
Q1 -0.39 (-0.49 to -0.29) NA Q2 -0.36 (-0.46 to -0.26) 0.510 Q3 -0.61 (-0.71 to -0.51) 0.013 Q4 -0.66 (-0.78 to -0.48) 2.2× 10⁻¹⁰
Quartile Beta* P-value**
Q1 -0.27 (-0.39 to -0.16) NA Q2 -0.42 (-0.50 to -0.34) < 2.0× 10⁻¹⁶ Q3 -0.37 (-0.45 to -0.29) 2.7× 10⁻¹⁴ Q4 -0.73 (-0.82 to -0.61) < 2.0× 10⁻¹⁶
Fig. 2. The changes in lung function in quartiles according to the rate of change in total fat amount over time. (A) FEV1p. (B) FVC.
95.0
90.0
85.0
0 5 10 15 Year
Male
B
FVCp
97.5
95.0
92.5
0 5 10 15 Year
Female
FVCp
Quartile Beta* P-value**
Q1 -0.37 (-0.41 to -0.26) NA Q2 -0.35 (-0.42 to -0.29) 0.860 Q3 -0.48 (-0.52 to -0.37) 0.075 Q4 -0.67 (-0.75 to -0.45) 9.9× 10⁻¹¹
Quartile Beta* P-value**
Q1 -0.39 (-0.41 to -0.26) NA Q2 -0.62 (-0.73 to -0.51) 4.9× 10⁻¹⁰ Q3 -0.68 (-0.80 to -0.59) < 2.0× 10⁻¹⁶ Q4 -0.82 (-0.95 to -0.71) < 2.0× 10⁻¹⁶
(Continued to the next page)
Fig. 2. (Continued) (C) FEV1/FVC. FEV1p, predicted value of forced expiratory volume in 1 second; FVC, forced vital capacity; FVCp, predicted value of FVC; Q, quartile;
NA, not applicable; NS, not significant. *Beta: regression coefficient with 95% confidence interval (%/yr in FEV1p and FVCp, /yr in FEV1/FVC). **P-value: in comparison to quartile 1 (Q1).
0.79
0.78
0.77
0 5 10 15 Year
Male
C FEV1/FVC
0.82
0.81
0.80
0 5 10 15 Year
Female
FEV1/FVC
Quartile Beta* P-value**
Q1 -0.025 (-0.031 to -0.014) NA Q2 -0.033 (-0.041 to -0.022) NS Q3 -0.022 (-0.033 to -0.014) NS Q4 -0.017 (-0.026 to -0.008) NS
Quartile Beta* P-value**
Q1 -0.015 (-0.023 to -0.007) NA Q2 -0.038 (-0.047 to -0.023) NS Q3 -0.011 (-0.020 to -0.006) NS Q4 -0.016 (-0.024 to -0.010) NS
Fig. 3. The changes in lung function in quartiles according to the rate of change in abdominal fat ratio over time. (A) FEV1p. (Continued to the next page) 106.0
104.0
102.0
100.0
98.0
96.0
0 5 10 15 Year
Male
A FEV1p
110.0
107.5
105.0
102.5
100.0
0 5 10 15 Year
Female
FEV1p
Quartile Beta* P-value**
Q1 -0.29 (-0.38 to -0.16) NA Q2 -0.33 (-0.41 to -0.26) NS Q3 -0.34 (-0.42 to -0.25) NS Q4 -0.43 (-0.52 to -0.31) 6.7× 10⁻³
Quartile Beta* P-value**
Q1 -0.31 (-0.41 to -0.13) NA Q2 -0.42 (-0.51 to -0.29) 1.2× 10⁻⁴ Q3 -0.47 (-0.55 to -0.35) 4.5× 10⁻⁶ Q4 -0.71 (-0.80 to -0.63) < 2.0× 10⁻¹⁶
95.0
90.0
0 5 10 15 Year
Male
B
FVCp
99.0
96.0
93.0
0 5 10 15 Year
Female
FVCp
Quartile Beta* P-value**
Q1 -0.59 (-0.48 to -0.46) NA Q2 -0.53 (-0.41 to -0.33) NS Q3 -0.48 (-0.37 to -0.35) NS Q4 -0.65 (-0.51 to -0.43) 0.034
Quartile Beta* P-value**
Q1 -0.53 (-0.62 to -043) NA Q2 -0.58 (-0.65 to -0.46) NS Q3 -0.56 (-0.67 to -0.45) NS Q4 -0.69 (-0.78 to -0.57) 6.3× 10⁻¹⁴
Fig. 3. (Continued) (B) FVC. (C) FEV1/FVC. FEV1p, predicted value of forced expiratory volume in 1 second; FVC, forced vital capacity; FVCp, predicted value of FVC; Q, quartile; NA, not applicable; NS, not significant. *Beta: regression coefficient with 95% confidence interval (%/yr in FEV1p and FVCp, /yr in FEV1/FVC). **P-value: in comparison to quartile 1 (Q1).
0.79
0.78
0.77
0 5 10 15 Year
Male
C FEV1/FVC
0.82
0.81
0.80
0.79
0 5 10 15 Year
Female
FEV1/FVC
Quartile Beta* P-value**
Q1 -0.014 (-0.021 to -0.003) NA Q2 -0.025 (-0.037 to -0.013) NS Q3 -0.029 (-0.041 to -0.017) NS Q4 -0.031 (-0.042 to -0.022) NS
Quartile Beta* P-value**
Q1 -0.025 (-0.036 to -0.017) NA Q2 -0.028 (-0.037 to -0.016) NS Q3 -0.031 (-0.042 to -0.022) NS Q4 -0.033 (-0.044 to -0.020) NS
그 기전이 밝혀진 바는 없으나 여러 가지 요인들에 의하여 복합적 으로 발생하는 현상으로 사료되며,23,24 이를 설명할 수 있는 몇 가지 기전들은 다음과 같다. 첫째, 내장 지방이 전신 염증 반응을 야기하 여 폐기능 저하가 발생하였을 가능성이다. 기존의 여러 연구에서 내장지방은 interleukin-6 (IL-6), tumor necrosis factor-α, adipo- nectin 등의 혈중 사이토카인 농도에 영향을 주어 전신성 염증반응 (systemic inflammation)을 유발할 수 있는 것으로 밝혀졌으며, 이 러한 염증반응이 궁극적으로 폐기능 저하를 일으키는 주요한 요인 들 중 하나가 될 수 있다.24-26 최근에 시행되었던 비만과 천식의 상관 관계 관련 연구에 의하면, 인테그린, nuclear factor-kappa B 신호 전달 및 Hedgehog 신호 전달과 같은 염증반응 관련 유전자들도 연 관되었을 가능성을 시사하였다.27 둘째, 체지방으로 인하여 생긴 폐 의 구조적 변화로 인한 폐기능 감소 역시 가능한 기전 중 하나이다.
체질량지수의 증가에 따라 내장지방이 증가하며, 복강 내 지방침착 이 증가하면 흉곽의 용적이 감소되어 폐활량이 감소할 수 있다.28-30 뿐만 아니라 복강 내 지방침착은 호흡근육의 근력 저하를 초래하 며 말초기도 저항을 증가시킬 수 있다.31 셋째, 체지방이 호르몬 시 스템과 신경계에 관여하여 폐기능 저하를 초래할 가능성이 있다.
지방 세포에서 생성된 렙틴은 식욕조절과 지방조직의 대사에 작용 하는 물질로서,32,33 선행 연구들에 의하면 폐조직 내에서도 렙틴의 생산이 가능하고 수용체도 존재하는 것으로 알려져 있다.34,35 이전 연구에서 렙틴은 기도 염증을 동반하지 않고도 중추의 부교감신경 을 조절하여 기도에 영향을 미칠 수 있으며,36 이것은 자율신경계 변화를 통하여 체지방이 폐기능에 영향을 줄 수 있는 기전 중에 하 나가 될 수 있다.
이 연구에서 기도폐쇄의 지표인 FEV1/FVC 비는 체지방량과 복 부지방률의 증가와는 연관성을 보이지 않았으며 이는 나이가 들수 록 체지방 및 복부지방률의 증가가 폐기능 감소에 미치는 영향이 FEV1보다 FVC에서, 즉 폐활량 감소에 미치는 영향이 더 크기 때문 으로 추정한다.
이 연구에서 흥미로운 사실은 복부지방률의 증가율이 40세 이 후의 FEV1p 및 FVCp의 기저치와 통계학적으로 유의한 연관성을 보이며 이 차이는 긴 추적 기간 동안 역전이 없이 그대로 유지되었 다는 점이다. 이 결과를 바탕으로 우리는 40세 이전의 복부지방률 이 40세 이후 폐기능의 출발점을 결정한다고 유추할 수 있으며, 따 라서 40세 이전 복부지방량의 조절이 평생의 폐기능을 안정적으로 유지하는 데에 매우 중요하다고 생각해 볼 수 있다. 한편 이 연구에 서는 체중이나 체질량지수(body mass index) 변화에 따른 sub- group 분석 시에는 폐기능 감소의 유의한 차이를 확인하지 못하였 다. 이는 현재까지 시행된 다수의 비만과 폐기능의 상관관계에 대 한 선행 연구들과 일치하는 결과로, 이들 연구에서도 단순한 체중 또는 체질량지수보다는 체지방률 또는 체지방의 분포, 근육의 비 율 등을 기초로 분석했을 때 의미 있는 결과를 얻을 수 있었다.37-39
이번 연구의 제한점으로는 단일기관에서 후향적 의무기록 조사 를 통해 이루어졌으며, 대부분의 대상자가 건강검진을 위하여 자발 적으로 병원을 방문한 건강에 관심이 높고 사회경제적 수준이 높 은 사람들이었으므로 선택편향(selection bias)의 가능성이 있다는 점이다. 또한 폐기능 감소와 체지방량, 복부지방률 간의 상관관계 에 대한 구체적인 기전을 제시하지 못하였다.
그럼에도 불구하고 이 연구는 체지방 및 복부지방률의 시간에 따른 변화와 폐기능의 감소속도의 연관성을 확인함으로써 체지방 량 및 복부지방률을 줄이는 것이 폐기능 감소를 예방하는 데에 기 여할 수 있음을 증명하였고, 실제 건강관리에 적용할 수 있는 근거 가 된다는 점에서 가치가 있다고 할 수 있다.
나아가 정상인 외에도 천식, 만성폐쇄성폐질환 등의 만성호흡기 질환 환자들에서 유사 연구가 시행된다면 실제 임상 진료에 큰 도 움이 될 것으로 기대되므로 이에 대한 추가 연구를 계획해 볼 수 있 다. 또한 향후 체지방량과 폐기능 감소의 기전에 관한 후속 연구가 필요할 것으로 생각한다.
REFERENCES
1. Chaung SK. Effects of obesity on pulmonary function in adult women. J Korean Public Health Nursing 2014;28:22-31.
2. Allison DB, Fontaine KR, Manson JE, Stevens J, VanItallie TB. Annual deaths attributable to obesity in the United States. J Am Med Assoc 1999;
282:1530-8.
3. Kim SR, Choi YS, Choi JH, Koh HJ. Association of body fat and body mass index with pulmonary function in women in their forties. J Korean Acad Fam Med 2003;24:827-32.
4. Jeon HO. Factors affecting the abdominal obesity by sex among the Ko- rean elderly - focusing on health and health behavior related factors. J Korea Acad Industr Coop Soc 2018;19:559-68.
5. Seo MH, Kim YH, Han K, Jung JH, Park YG, Lee SS, et al. Prevalence of obesity and incidence of obesity-related comorbidities in Koreans based on National Health Insurance Service health checkup data 2006–2015. J Obes Metab Syndr 2018;27:46-52.
6. Seo MH, Lee WY, Kim SS, Kang JH, Kang JH, Kim KK, et al. 2018 Korean society for the study of obesity guideline for the management of obesity in Korea. J Obes Metab Syndr 2019;28:40-5.
7. Sue DY. Obesity and pulmonary function: more or less? Chest 1997;111:
844-6.
8. De Souza SAF, Faintuch J, Greve JW, Cecconello I. Role of body mass in- dex in pulmonary function of morbidly obese subjects. Chest 2007;132(4 Suppl):613C.
9. Kim SH. Gender difference on the relationship between obesity and air- way hyperresponsiveness in adult asthma. Allergy Asthma Respiry Dis 2014;2:1-2.
10. Rönmark E, Andersson C, Nyström L, Forsberg B, Järvholm B, Lundbäck B. Obesity increases the risk of incident asthma among adults. Eur Respir J 2005;25:282-8.
11. Beuther DA, Sutherland ER. Overweight, obesity, and incident asthma: a meta-analysis of prospective epidemiologic studies. Am J Respir Crit Care Med 2007;175:661-6.
12. Bates DV. Respiratory function in disease. Philadelphia (PA): Saunders;
1989.
13. Pellegrino R, Viegi G, Brusasco V, Crapo R, Burgos F, Casaburi R, et al.
Interpretative strategies for lung function tests. Eur Respir J 2005;26:948- 14. Choi JK, Paek D, Lee JO. Normal predictive values of spirometry in Ko-68.
rean population. Tuberc Respir Dis 2005;58:230-42.
15. Seidell J, Cigolini M, Charzewska J, Ellsinger B, Deslypere J, Cruz A. Fat distribution in European men: a comparison of anthropometric measure- ments in relation to cardiovascular risk factors. Int J Obes Relat Metab Disord 1992;16:17-22.
16. Organization WH. Waist circumference and waist-hip ratio: report of a WHO expert consultation [Internet]. Geneva (Switzerland): World Health Organization; 2008 [cited 2021 Mar 2]. Avaiable from: https://apps.who.
int/iris/handle/10665/44583.
17. Lazarus R, Gore CJ, Booth M, Owen N. Effects of body composition and fat distribution on ventilatory function in adults. Am J Clin Nutr 1998;68:
35-41.
18. Forno E, Han YY, Mullen J, Celedón JC. Overweight, obesity, and lung function in children and adults—a meta-analysis. J Allergy Clin Immunol:
In Practice 2018;6:570-81.e10.
19. Sutherland ER, Lehman EB, Teodorescu M, Wechsler ME, Heart N. Body mass index and phenotype in subjects with mild-to-moderate persistent asthma. J Allergy Clin Immunol 2009;123:1328-34.e1.
20. Farah CS, Kermode JA, Downie SR, Brown NJ, Hardaker KM, Berend N, et al. Obesity is a determinant of asthma control independent of inflam- mation and lung mechanics. Chest 2011;140:659-66.
21. Gibeon D, Batuwita K, Osmond M, Heaney LG, Brightling CE, Niven R, et al. Obesity-associated severe asthma represents a distinct clinical phe- notype: analysis of the British Thoracic Society Difficult Asthma Registry Patient cohort according to BMI. Chest 2013;143:406-14.
22. Kwon JW, Kim SH, Kim TB, Kim SH, Park HW, Chang YS, et al. Airway hyperresponsiveness is negatively associated with obesity or overweight status in patients with asthma. Int Arch Allergy Immunol 2012;159:187- 23. Permaul P, Kanchongkittiphon W, Phipatanakul W. Childhood asthma 93.
and obesity—what is the true link? Ann Allergy Asthma Immunol 2014;
113:244-6.
24. Tantisira K, Weiss S. Complex interactions in complex traits: obesity and asthma. Thorax 2001;56:ii64-74.
25. Kern PA, Ranganathan S, Li C, Wood L, Ranganathan G. Adipose tissue
tumor necrosis factor and interleukin-6 expression in human obesity and insulin resistance. Am J Physiol Endocrinol Metab 2001;280:E745-51.
26. Staiger H, Tschritter O, Machann J, Thamer C, Fritsche A, Maerker E, et al. Relationship of serum adiponectin and leptin concentrations with body fat distribution in humans. Obes Res 2003;11:368-76.
27. Croteau‐Chonka DC, Chen Z, Barnes KC, Barraza‐Villarreal A, Celedón JC, Gauderman WJ, et al. Gene coexpression networks in whole blood implicate multiple interrelated molecular pathways in obesity in people with asthma. Obesity 2018;26:1938-48.
28. Kotani K, Tokunaga K, Fujioka S, Kobatake T, Keno Y, Yoshida S, et al.
Sexual dimorphism of age-related changes in whole-body fat distribution in the obese. Int J Obes Relat Metab Disord 1994;18:207-2.
29. Pascot A, Lemieux S, Lemieux I, Prud'homme D, Tremblay A, Bouchard C, et al. Age-related increase in visceral adipose tissue and body fat and the metabolic risk profile of premenopausal women. Diabetes Care 1999;
22:1471-8.
30. Ryan AS, Nicklas BJ, Elahi D. A cross-sectional study on body composi- tion and energy expenditure in women athletes during aging. Am J Physi- ol Endocrinol Metab 1996;271:E916-21.
31. Canoy D, Luben R, Welch A, Bingham S, Wareham N, Day N, et al. Ab- dominal obesity and respiratory function in men and women in the EP- IC-Norfolk Study, United Kingdom. Am J Epidemiol 2004;159:1140-9.
32. Friedman J. Leptin at 20: an overview. J Endocrinol 2014;223:T1-8.
33. Harris RB. Direct and indirect effects of leptin on adipocyte metabolism.
Biochem Biophys Acta 2014;1842:414-23.
34. Malli F, Papaioannou AI, Gourgoulianis KI, Daniil Z. The role of leptin in the respiratory system: an overview. Respir Res 2010;11:1-16.
35. Sood A, Shore SA. Adiponectin, leptin, and resistin in asthma: basic mech- anisms through population studies. J Allergy 2013;2013:785835.
36. Arteaga-Solis E, Zee T, Emala CW, Vinson C, Wess J, Karsenty G. Inhibi- tion of leptin regulation of parasympathetic signaling as a cause of ex- treme body weight-associated asthma. Cell Metab 2013;17:35-48.
37. Sin DD, Man SFP. Impaired lung function and serum leptin in men and women with normal body weight: a population based study. Thorax 2003;
58:695-8.
38. Park CH, Yi Y, Do JG, Lee YT, Yoon KJ. Relationship between skeletal muscle mass and lung function in Korean adults without clinically ap- parent lung disease. Medicine (Baltimore) 2018;97:e12281.
39. Park JY, Chung JH, Lee KH, Shin KC. The effect of body composition on pulmonary function. Tuberc Respir Dis 2012;72:433-40.