The Impact of Hemodialysis and Arteriovenous Access Flow on Extracranial Hemodynamic Changes in End-Stage Renal Disease Patients
In this study, we characterized cerebral blood flow changes by assessment of blood flow parameters in neck arteries using carotid duplex ultrasonography and predictive factors for these hemodynamic changes. Hemodynamic variables were measured before and during hemodialysis in 81 patients with an arteriovenous access in their arm. Hemodialysis produced significant lowering in peak systolic velocity and flow volume of neck arteries and calculated total cerebral blood flow (1,221.9 ± 344.9 [before hemodialysis] vs.
1,085.8 ± 319.2 [during hemodialysis], P < 0.001). Effects were greater in vessels on the same side as the arteriovenous access and these changes were influenced by arteriovenous access flow during hemodialysis, both in the CCA (r = -0.277, P = 0.015) and the VA (r = -0.239, P = 0.034). The change of total cerebral blood flow during hemodialysis was independently related with age, presence of diabetes, and systemic blood pressure.
Keywords: Arteriovenous Access; Carotid Duplex Ultrasonography; Cerebral Blood Flow;
Hemodialysis Sarah Chung,1 Hye Seon Jeong,2,3
Dae Eun Choi,1 Hee-Jung Song,2,3 Young Gi Lim,2 Joo Yeon Ham,2 Ki Ryang Na,1 and Kang Wook Lee1
1Renal Division, Department of Internal Medicine, Chungnam National University Hospital, Daejeon, Korea; 2Department of Neurology, Chungnam National University Hospital, Daejeon, Korea;
3Daejeon-Chungnam Regional Cerebrovascular Center, Chungnam National University Hospital, Daejeon, Korea
Received: 29 October 2015 Accepted: 28 April 2016 Address for Correspondence:
Hye Seon Jeong, MD
Department of Neurology, Chungnam National University Hospital, 282 Munwha-ro, Jung-gu, Daejeon 35015, Korea E-mail: [email protected]
http://dx.doi.org/10.3346/jkms.2016.31.8.1239 • J Korean Med Sci 2016; 31: 1239-1245
INTRODUCTION
Intermittent hemodialysis influences cerebral hemodynamics through several mechanisms in patients with end-stage renal disease (ESRD). Ultrafiltration, defined as the elimination of in- travascular fluid during hemodialysis, leads to hemoconcentra- tion and a consequent rise in blood viscosity and hematocrit (1,2). Intradialytic hypotension, which is caused by volume re- duction, is a well-known factor that decreases cerebral perfu- sion pressure during hemodialysis (3,4). These mechanisms ul- timately affect cerebral blood flow (CBF), which can result in a cerebrovascular event (5). Alterations in cerebral oxygenation and endothelial activation in hemodialysis patients have also been suggested as alternative mechanisms influencing hemo- dynamic changes (6).
Transcranial Doppler (TCD) is a simple, noninvasive, bed- side test that provides information on changes in intracranial blood flow and has been used to evaluate hemodynamic chang- es in hemodialysis patients (6-10). However, reliable use of TCD in hemodialysis patients is limited by inadequacy of the tempo- ral window, examiner inexperience, and inaccurate measure- ment of flow velocity. Additionally, flow volume cannot be mea- sured by TCD.
In contrast to TCD, carotid duplex sonography (CDU) pro-
vides more detailed information regarding the anatomy of ves- sels and flow hemodynamics, including flow velocity and flow volume. To date, the use of CDU during hemodialysis has not been well studied. Additionally, the effects of the location of the arteriovenous (AV) access and the flow volume via the access during hemodialysis on cerebral hemodynamics have yet to be comprehensively evaluated. Only a few case reports have de- scribed vertebral blood flow steal caused by high flow through the AV access (11,12). Therefore, the first aim of our study was to evaluate hemodynamic changes in extracranial blood ves- sels, which directly connect with intracranial cerebral vessels, during hemodialysis using CDU measurements of flow velocity and volume. The second aim was to evaluate the relationship between the measured changes in these hemodynamic vari- ables and hemodialysis-specific parameters, including the lo- cation of and flow through the AV access and changes in sys- temic blood pressure during hemodialysis.
MATERIALS AND METHODS Participants
Participants were prospectively recruited into the study from among ESRD patients attending the artificial kidney unit at Chung- nam National University Hospital between October 2013 and
March 2014. Prospective patients were screened on the follow- ing inclusion criteria: age over 18 years, hemodialysis via AV ac- cess for more than 3 months, use of a radiocephalic or brachio- cephalic AV access, stable vital signs, willing to undergo repeat- ed CDU measurements before and after hemodialysis, and com- petency to provide consent. Based on these inclusion criteria, patients on emergent hemodialysis or with unstable vital signs, severe heart failure, or valvular heart disease were excluded.
Patients with an AV access malfunction due to infection, throm- bus formation, stenosis, or hematoma were also excluded.
Clinical data
Baseline characteristics of the patients were collected by review of the medical records. Descriptive data collected included car- diovascular risk factors, such as diabetes, hypertension, smok- ing, previous history of stroke or coronary heart disease, and the duration of hemodialysis via the AV access. Systolic and dia- stolic blood pressure (BP) values were obtained before and dur- ing hemodialysis. Patients were asked to report dizziness before and during hemodialysis, with the severity of dizziness graded between ‘0’ and ‘10’ using the verbal analogue scale (13).
CDU evaluation
Hemodynamic evaluations were performed using a CDU with a standard 7 MHz linear transducer (ACUSON X300TM, Siemens, Erlangen, Germany). CDU evaluations were completed at two time points for each patient, just before the start of hemodialy- sis and at 1 hour into the treatment, to minimize influence of systemic hypovolemia and hypotension, which usually occurr- ed during the last half of the hemodialysis session. At each time point, the bilateral peak systolic velocities (PSV) and blood flow volumes (FV) were measured for the common carotid arteries (CCA) and vertebral arteries (VA). At the CCA, hemodynamic variables were measured at a segment located 2 cm proximal to the bifurcation of the CCA; at the VA, variables were measured at the arterial segment between the transverse processes of the 4th and 5th cervical vertebrae in the sagittal plane (14). The di- ameter of the vessels at each location was measured at each evaluation. CBF volume was automatically calculated, using di- ameter and FV values measured on the same side as the AV ac- cess, with the following formula: Q = (Tmax/2)*area, where area
= (d/2)2*π (15). Total CBF was calculated as the sum of the bilat- eral FVs in the CCAs and VAs.
FV through the AV access was measured during hemodialy- sis using AV access flow surveillance and the ultrasound dilu- tion method (HD03 Hemodialysis Monitor®). FV was measured during the first 1.5 hours of hemodialysis, as per the guidelines of the Kidney Disease Outcomes Quality Initiative (16).
Statistical analysis
Differences in hemodynamic variables (BP, PSV, and FV) at the
two time points (before and during hemodialysis) were mea- sured separately for each site (CCA and VA) and evaluated rela- tive to the side of the AV access. Differences in the calculated total FV were also evaluated at the two time points. Paired sam- ple t-tests were used to determine the level of significance of the changes in systemic BP, PSV, and FV for each artery, as well as the total FV, before and during hemodialysis. Independent t- tests were used to compare the change (ΔHD-baseline) in PSV and FV for the AV access side and the opposite side.
The influence of access flow on cerebral hemodynamics was evaluated by correlation analysis of the combined hemody- namic variables measured at the vessels and flow via the AV ac- cess. Hemodynamic variables were also analyzed according to the presence of dizziness during hemodialysis. Our final analy- sis focused on identification of factors influencing hemodynam- ic variables. Values of change in total CBF (Δ total CBF) were rank ordered, and participants in the highest and lowest quar- tiles were selected. Group differences were evaluated using the Mann-Whitney U-test or Fisher’s exact test, as appropriate, for the following variables: age, presence of vascular risk factors, change in systolic blood pressure during hemodialysis, location and duration of AV access, and flow via the AV access during hemodialysis. Multiple logistic regression analysis was used to search for independent variables. Statistical analyses were per- formed using SPSS (v19.0; IBM, Chicago, IL, USA). The level of significance was set at P < 0.05.
Ethics statement
The methods and procedures for this study were approved by the institutional review board of Chungnam National Universi- ty Hospital (IRB No. 2013-04-010). Informed consent was ob- tained from all participants.
RESULTS
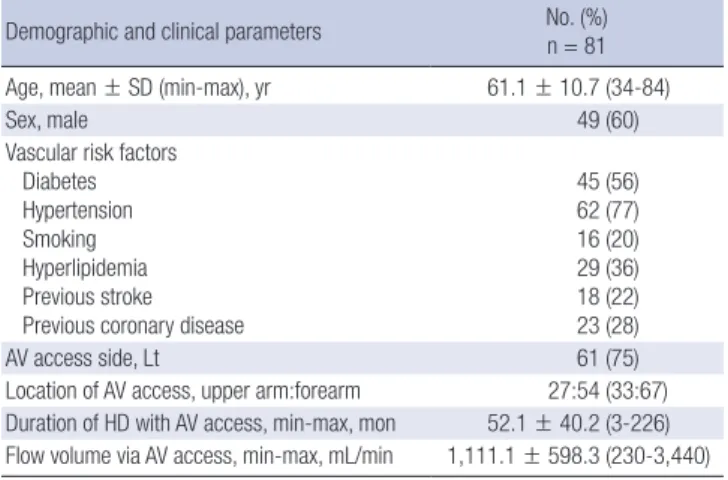
Of the 158 patients undergoing hemodialysis in our artificial kidney unit during the study period, 62 hospitalized patients and 7 patients who had begun treatment less than 3 months ago were excluded. Of the remaining 89 patients who agreed to participate in our study, the data from 8 patients were excluded from the analysis due to poor VA insonation (n = 4) and insuffi- cient AV access for hemodialysis (n = 4). Relevant characteris- tics of the patients forming our study group are listed in Table 1.
Our study group consisted of 81 patients, including 49 men with a mean ± SD age of 61.1 ± 10.7 years. Of these, 45 patients had diabetes (56%), 62 hypertension (77%), 18 a history of stroke (22%), and 29 a history of coronary heart disease (77%). AV ac- cess was located in the left arm for 75% of patients and forearm for 67%. The mean duration of hemodialysis with AV access was 52.1 ± 40.2 months (range, 3-226 months). The mean flow via the AV access during hemodialysis was 1,111.1 ± 598.3 mL/min
Table 1. Clinical characteristics of included participants
Demographic and clinical parameters No. (%) n = 81 Age, mean ± SD (min-max), yr 61.1 ± 10.7 (34-84)
Sex, male 49 (60)
Vascular risk factors Diabetes Hypertension Smoking Hyperlipidemia Previous stroke Previous coronary disease
45 (56) 62 (77) 16 (20) 29 (36) 18 (22) 23 (28)
AV access side, Lt 61 (75)
Location of AV access, upper arm:forearm 27:54 (33:67) Duration of HD with AV access, min-max, mon 52.1 ± 40.2 (3-226) Flow volume via AV access, min-max, mL/min 1,111.1 ± 598.3 (230-3,440) Values are mean ± standard deviation.
AV, arteriovenous; HD, hemodialysis.
Table 2. Systemic and extracranial hemodynamic changes measured before and during hemodialysis
Hemodynamic parameters Before
hemodialysis During
hemodialysis P value Systolic blood pressure, mmHg 146.2 ± 21.9 136.1 ± 24.6 < 0.001 Diastolic blood pressure, mmHg 76.6 ± 13.8 74.2 ± 13.5 0.080 Common carotid artery
AV access side PSV, cm/sec
FV, mL/min 71.2 ± 19.4
527.9 ± 183.2 64.4 ± 20.0
431.7 ± 158.8 < 0.001
< 0.001 Opposite side
PSV, cm/sec
FV, mL/min 64.5 ± 21.7
465.9 ± 167.5 61.5 ± 21.5
412. 6 ± 138.5 0.041
< 0.001 Vertebral artery
AV access side PSV, cm/sec FV, mL/min
45.9 ± 22.8 95.2 ± 81.8
41.2 ± 21.2 84.6 ± 79.7
< 0.001
< 0.001 Opposite side
PSV, cm/sec FV, mL/min
54.3 ± 16.7 132.1 ± 77.6
52.4 ± 16.8 131.0 ± 83.6
0.017 0.668 Sum of FV of CCA and VA
AV access side Opposite side
626.8 ± 194.7 592.2 ± 203.8
511.0 ± 169.0 538.5 ± 181.5
< 0.001
< 0.001 Total FV, mL/min 1,221.9 ± 344.9 1,085.8 ± 319.2 < 0.001 Values are mean ± standard deviation.
AVF, arteriovenous fistula; PSV, peak systolic velocity; FV, flow volume.
Table 3. Side-to-side comparison of extracranial hemodynamic variables, measured before and during hemodialysis
Hemodynamic variables ΔHD-baseline
P value ΔHD-baseline (%)
P value
AV access side Opposite side AV access side Opposite side
Common carotid artery PSV, cm/sec
FV, mL/min -6.7 ± 10.2
-94.3 ± 109.7 -3.0 ± 12.9
-52.6 ± 119.1 0.012
0.007 -9.2 ± 12.4
-16.5 ± 17.8 -3.0 ± 12.9
-5.2 ± 23.4 < 0.001
< 0.001 Vertebral artery
PSV, cm/sec
FV, mL/min -4.2 ± 6.7
-11.9 ± 23.1 -1.7 ± 6.7
-1.3 ± 23.1 0.009
0.002 -8.7 ± 12.1
-15.1 ± 21.5 -1.7 ± 11.0
-0.5 ± 21.7 < 0.001
< 0.001
Sum of FVs of CCA and VA -105.7 ± -115.5 -53.7 ± 123.5 0.001 -16.3 ± 15.7 -6.8 ± 18.7 < 0.001
Values are mean ± standard deviation; Δ means change of variable during hemodialysis to compare with before hemodialysis.
HD, hemodialysis; AVF, arteriovenous fistula; PSV, peak systolic velocity; FV, flow volume.
(range, 230-3,340 mL/min).
Hemodynamic changes during hemodialysis
The changes in hemodynamic variables, measured at the bilat- eral CCAs and VAs, are reported in Table 2. Systolic BP was sig- nificantly decreased during hemodialysis from 146.2 ± 21.9 be- fore hemodialysis to 136.1 ± 24.6 during (P < 0.001). Similarly, the PSV and FV in the CCA were significantly decreased during hemodialysis on both the AV access side and the opposite side:
PSV, same side, 71.2 ± 19.4 (before) vs. 64.4 ± 20.0 (during), P <
0.001; PSV, opposite side, 64.5 ± 21.7 (before) vs. 61.5 ± 21.5 (dur- ing), P = 0.041; FV, same side, 527.9 ± 183.2 (before) vs. 431.7 ± 158.8 (during), P < 0.001; FV, opposite side; 465.9 ± 167.5 (be- fore) vs. 412.6 ± 138.5 (during), P < 0.001.
The PSVs in the VAs were also significantly decreased during hemodialysis on both sides: same side, 45.9 ± 22.8 (before) vs.
41.2 ± 21.2 (during), P < 0.001; opposite side, 54.3 ± 16.7 (be- fore) vs. 52.4 ± 16.8 (during), P = 0.017. In contrast, FVs in the VAs were decreased only on the AV access side during hemodi- alysis: 95.2 ± 81.8 (before) vs. 84.6 ± 79.7 (during), P < 0.001.
The sum of the FVs in the CCAs and the VAs was also decreas- ed during hemodialysis on both sides: same side, 626.8 ± 194.7 (before) vs. 511.0 ± 169.0 (during), P < 0.001; opposite side (be-
fore), 592.2 ± 203.8 vs. 538.5 ± 181.5 (during), P < 0.001. Addi- tionally, the total CBF was significantly decreased during he- modialysis: 1,221.9 ± 344.9 (before) vs. 1,085.8 ± 319.2 (during), P < 0.001.
Comparison of hemodynamic variables according to the AV access side
Between-side comparisons of changes in hemodynamic vari- ables, measured before and during hemodialysis, are reported in Table 3. For all variables, the magnitude of change was signi- ficantly larger on the AV access side compared to the opposite side. In the CCAs, the PSV on the AV access side was -6.7 ± 10.2 compared to -3.0 ± 12.9 on the opposite side (P = 0.012). Simi- larly in the VAs, between-side PSV values were -4.2 ± 6.7 and -1.7 ± 6.7 for the AV access and opposite side, respectively (P = 0.009). For FVs, changes of -94.3 ± 109.7 and -52.6 ± 119.1 were measured on the AV access and opposite sides, respectively, in
the CCA (P = 0.007) and changes of -11.9 ± 23.1 and -1.3 ± 23.1, respectively, in the VA (P = 0.002). Similar between-side effects were identified for the sum of the FVs in the CCAs and the VAs, with Δ HD-baseline values of -105.7 ± -115.5 on the AV side compar- ed to -53.7 ± 123.5 on the opposite side (P = 0.001). The magni- tude of change in the FV expressed as a function of the flow via the AV access is shown for the CCAs and the VAs in Fig. 1A and 1B, respectively. FV decreased during hemodialysis at all flow volumes via the AV access, with the magnitude of change show- ing a tendency to increase as the access flow volume increased, both in the CCA (r = -0.277, r2= 0.077; P = 0.015; Fig. 1A) and the VA (r = -0.239, r2= 0.057; P = 0.034; Fig. 1B).
Hemodynamic change and dizziness
During hemodialysis, 14 patients complained of either an acute onset of dizziness or an aggravation of pre-existing dizziness.
Two patients who could not respond to the dizziness question- naire were excluded in this analysis. Age, sex, vascular risk fac- tors, AV access side and location, and duration of hemodialysis
with AV access were not significantly different between patients with dizziness (n = 14) and patients without dizziness (n = 65).
As well, changes in systolic and diastolic BP during hemodialy- sis were not different between the groups. However, flow via the AV access was higher in patients with dizziness compared to those without, with flow volumes of 1,466.2 ± 862.3 and 1,040.8
± 494.4, respectively (P = 0.055). There was also a significantly greater decrease in total CBF during hemodialysis in patients with dizziness compared to those without, with changes of -202.4
± 164.0 and -122.2 ± 217.7, respectively (P = 0.071); these re- sults are shown in Supplementary Table 1.
Influencing factors of hemodynamic change before and during hemodialysis
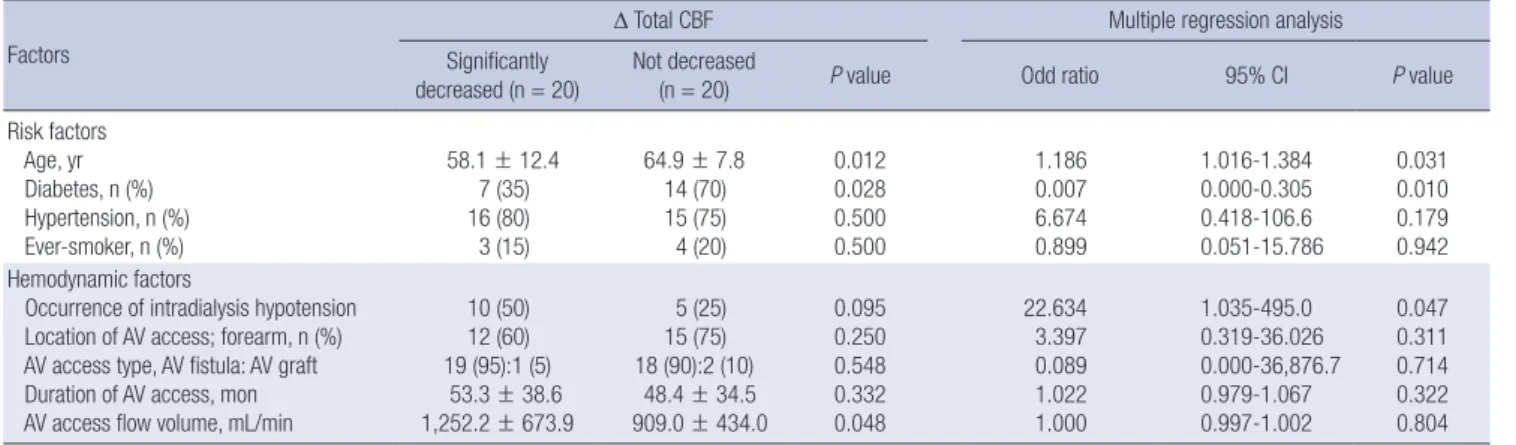
Patients in the highest quartile of Δ Total CBF were younger than patients in the lowest quartile, with age of 58.1 ± 12.4 and 64.9 ± 7.8, respectively (P = 0.012, Table 4). Interestingly, in terms of vascular risk factors, the prevalence of diabetes was higher in the group of patients in the lowest quartile, with a rate of 70%
Fig. 1. Correlation between flow volume (FV) on the arteriovenous (AV) access side and the access flow during hemodialysis. (A) The change in combined FV in the common carotid arteries (CCAs) and vertebral arteries (VAs) on AV access side tends to increase as the amount of AV access flow increases (r = -0.277, r2 = 0.077; P = 0.015). (B) The change in FV in the VAs on the AV access side also tended to increase as the amount of AV access flow increased (r = -0.239, r2 = 0.057; P = 0.034).
∆FV of CCA & VA in AV access side (HD-baseline)
Flow volume via AV access during HD (mL/min)
0 1,000 2,000 3,000 4,000
200
0
-200
-400 ∆FV of VA in AV access side (HD-baseline)
Flow volume via AV access during HD (mL/min)
0 1,000 2,000 3,000 4,000
25 0 -25 -50 -75
A B
Table 4. Factors related to change in total cerebral blood flow (Δ Total CBF) during hemodialysis Factors
Δ Total CBF Multiple regression analysis
Significantly
decreased (n = 20) Not decreased
(n = 20) P value Odd ratio 95% CI P value
Risk factors Age, yr Diabetes, n (%) Hypertension, n (%) Ever-smoker, n (%)
58.1 ± 12.4 7 (35) 16 (80) 3 (15)
64.9 ± 7.8 14 (70) 15 (75) 4 (20)
0.012 0.028 0.500 0.500
1.186 0.007 6.674 0.899
1.016-1.384 0.000-0.305 0.418-106.6 0.051-15.786
0.031 0.010 0.179 0.942 Hemodynamic factors
Occurrence of intradialysis hypotension Location of AV access; forearm, n (%) AV access type, AV fistula: AV graft Duration of AV access, mon AV access flow volume, mL/min
10 (50) 12 (60) 19 (95):1 (5) 53.3 ± 38.6 1,252.2 ± 673.9
5 (25) 15 (75) 18 (90):2 (10) 48.4 ± 34.5 909.0 ± 434.0
0.095 0.250 0.548 0.332 0.048
22.634 3.397 0.089 1.022 1.000
1.035-495.0 0.319-36.026 0.000-36,876.7 0.979-1.067 0.997-1.002
0.047 0.311 0.714 0.322 0.804 Δ means change in blood pressure, which was checked during hemodialysis to compare with before hemodialysis.
compared to 35% for patients in the highest quartile (P = 0.028, Table 4). However, the groups did not differ in terms of preva- lence of hypertension and smoking; there were also no between- group differences in AV access-related factors (location of AV access, type of AV access, and duration of dialysis with AV ac- cess). However, intradialytic hypotension was more frequently observed in highest quartile group (P = 0.095), and the flow volume via the AV access was larger in patients with a larger de- crease in total CBF, with flow values of 1,252.2 ± 673.9 and 909.0
± 434.0 for patients in the highest and lowest quartiles, respec- tively (P = 0.048, Table 4). Multiple logistic regression analysis indicated that older age (odds ratio [OR] 1.186, 95% confidence interval (CI) 1.016-1.384; P = 0.031) and the presence of diabe- tes (OR 0.007, 95% CI 0.000-0.305; P = 0.010) predicted a lower probability of hemodynamic changes. The occurrence of IDH was also independently related to the change in CBF (OR 22.684, 95% CI 1.035-495.0; P = 0.047) (Table 4).
DISCUSSION
In this study, we used CDU to quantify changes in the hemody- namics of extracranial vessels, namely the CCAs and the VAs.
We provided evidence for a significant decrease in hemodyna- mic variables of the bilateral CCAs and VAs, as well as the total CBF, during hemodialysis. This decrease in total CBF can result from a number of factors, including a decrease in intravascular volume by ultrafiltration, hemoconcentration, and intradialytic hypotension (1-4). A number of studies have evaluated changes in cerebral hemodynamics during dialysis in patients with ESRD.
Using TCD, these studies reported lower baseline CBF in pati- ents with ESRD compared to healthy controls, with a further decrease in CBF after hemodialysis (6-10).
While TCD is useful as a bedside assessment of hemodyna- mics, the temporal window is typically not sufficient for real-time evaluation of the dynamics of CBF, specifically in older Asian women. In addition, FV is not a measured hemodynamic vari- able in routine TCD evaluations. In contrast, FV is readily mea- sured with CDU. Using CDU, we demonstrated a significant de- crease in PSVs and FVs in the bilateral CCAs and VAs, as well as the total CBF, during hemodialysis. Therefore, while our find- ings of a general decrease in hemodynamic variables during hemodialysis is comparable to findings from previous studies, use of the CDU allowed us to estimate the total CBF by measur- ing the FV in the arteries of the neck.
In the present study, the PSV and FV of the CCAs and VAs were more decreased in the vessels located on the same side as the AV access than the opposite side. This effect of AV access on the FV in ipsilateral vessels was explained by the flow volume via the AV access (Fig. 1). To date, the effects of flow volume via the AV access on cerebral hemodynamics have not been evalu- ated in prospective studies of hemodialysis patients. Two case
reports have described a relationship between high flow through the AV access in the arm and reversal of flow in the ipsilateral VA in a patient who presented with ataxia and vertigo associat- ed with hemodialysis; the flow through the AV access, and the clinical symptoms, were corrected by surgical reduction of the AV fistula (11,12). The reversal of flow in the VA, and the associ- ated clinical symptoms, can be explained by a subclavian artery steal syndrome from the VA due to high flow via the AV access.
Dizziness is an unpleasant side effect of hemodialysis. In our study group, dizziness was predicted by younger age, higher flow volume via the AV access and a greater magnitude of de- crease in the total CBF volume during hemodialysis. Due to the relatively low number of patients with dizziness (i.e., 18%), the predictive value of these factors could not be evaluated. As diz- ziness was prevalent in patients with higher flow volumes via their AV access, we propose that high flow volume causes a ver- tebral-to-subclavian artery steal syndrome, which lowers CBF sufficiently to induce clinical symptoms of vertebrobasilar artery insufficiency.
The effect of decreased CBF during hemodialysis on clinical outcomes has not been well studied. According to the previous research of Hata et al. (8), there was a significant decrease in the mean flow velocity of the basal cerebral arteries after hemodi- alysis, and there was an inverse correlation between the % mean flow velocity and both the weight loss and the increase in he- matocrit produced by hemodialysis. One explanation is that the reduced circulating volume during hemodialysis causes a re- sultant increase in the hematocrit and oxygen delivery capacity, leading to a decrease in MFV and a reduction in CBF. Moreover, hemodialysis can be a harmful procedure because of a high prev- alence of cardiovascular disease in patients receiving regular hemodialysis. In this study, we suggest that the decrease in CBF during hemodialysis is one of the possible causes of dizziness in patients on regular hemodialysis. A more precisely designed, prospective long-term follow-up study is needed to evaluate the correlation between hemodynamic changes and cardiovas- cular outcomes.
Age, presence of diabetes, and occurrence of intradialysis hy- potension were highly related to the change in total CBF during hemodialysis. Interestingly, greater effects from hemodialysis were observed in younger and non-diabetic patients. This un- expected result can partially be explained by cerebral vascular reactivity (VR). Although the influence of age on cerebral VR remains controversial, cerebral VR has been shown to decline with increasing age (17). Impairment in VR due to the partial pressure of CO2 and changes in BP have been reported in elder- ly patients and patients with diabetes (18-20).
To explain the unusual finding that ΔCBF was lower in pati- ents with both diabetes mellitus (DM) and ESRD, we also con- sidered some possible biases. Among the factors, age was sig- nificantly lower in non-diabetic patients (DM, 63.5 ± 7.6 vs. non-
DM, 58.0 ± 13.6; P = 0.028). Additionally, the flow volume via AV access was significantly higher in non-diabetic patients (DM, 1,325.6 ± 607.8 vs. non-DM, 939.6 ± 537.9 mL/min; P = 0.003).
Other AV access related factors and the occurrence of IDH were not associated with the presence of DM. Interestingly, age neg- atively influenced the relationship of DM and ΔCBF; thus, both factors affect independently of the change in CBF. Larger FVs via AV access during HD in non-diabetic patients possibly con- tributed to the significant decrease in CBF, which was greater in non-diabetic patients than in DM patients, as well as the decreas- ed vasoreactivity in diabetic patients.
Intradialytic hypotension has been known to be the main cause of hemodynamic instability during hemodialysis (3,4).
Because IDH is more frequently observed in the latter stages of the hemodialysis sessions (21), we conducted our hemodyna- mic evaluations and BP measurements just 1 hour after the start of hemodialysis to minimize influences of systemic hypoten- sion on measured hemodynamic variables. However, in the present study, between the extreme 2 groups, the highest quar- tile group and lowest quartile group of Δ Total CBF, CBF was re- lated to the systemic BP change at 1 hour after dialysis initiation;
thus, IDH caused by decreased vascular volume can cause de- creased cerebral blood flow, even in an early stage of hemodi- alysis.
Limitations of our study need to be acknowledged in the eval- uation of our outcomes. We used CCA volume, rather than in- ternal carotid artery (ICA) volume, to calculate total CBF. Strict- ly, ICA volume would provide a more specific calculation of to- tal CBF. However, to avoid inaccurate measurement of FV due to stenosis of the proximal ICA, which is frequently observed in ESRD patients, we selected to obtain our measures from the CCA. Additionally, we did not consider blood viscosity, blood gas, or other influencing metabolic factors. More comprehen- sive studies designed to evaluate the relationship between chan- ges in hemodynamic variables and metabolic and hemodyna- mic factors are needed.
In summary, the extracranial blood flow decreased during the hemodialysis session, and the decrease was larger in vessels on the same side as the AV access. The main factors influencing the change in CBF were age, presence of diabetes, and decrease in systemic blood pressure. Outcomes of our study provide in- sight into the hemodynamic changes in extracranial vessels that are closely related to changes in intracranial cerebral blood flow with hemodialysis.
ACKNOWLEDGMENT
Special thanks to Professor, Jei Kim (Department of Neurology, Chungnam National University hospital, Daejeon-Chungnam Regional Cerebrovascular Center) who contributed to the study design and logistics of the study, and Jun-Sik Lee (Daejeon-
Chung nam Regional Cerebrovascular Center, Chungnam Na- tional University hospital), a professional sonographer who performed CDU evaluations.
DISCLOSURE
The authors have no potential conflicts of interest to disclose.
AUTHOR CONTRIBUTION
Study conception and design: Jeong HS, Lee KW. Acquisition of data: Chung S, Song HJ, Lim YG, Ham JY, Na KR. Analysis and interpretation of data: Chung S, Jeong HS, Choi DE. Drafting of manuscript: Chung S, Jeong HS. Critical revision: Jeong HS, Choi DE. Final approval of manuscript and submission: all authors.
ORCID
Sarah Chung http://orcid.org/0000-0002-8184-8905 Hye Seon Jeong http://orcid.org/0000-0002-2031-5662 Dae Eun Choi http://orcid.org/0000-0003-2870-3958 Hee-Jung Song http://orcid.org/0000-0001-9572-4105 Young Gi Lim http://orcid.org/0000-0003-1194-507X Joo Yeon Ham http://orcid.org/0000-0001-6999-1701 Ki Ryang Na http://orcid.org/0000-0002-0136-176X Kang Wook Lee http://orcid.org/0000-0003-3407-1205
REFERENCES
1. Metry G, Wikström B, Valind S, Sandhagen B, Linde T, Beshara S, Lång- ström B, Danielson BG. Effect of normalization of hematocrit on brain circulation and metabolism in hemodialysis patients. J Am Soc Nephrol 1999; 10: 854-63.
2. Brass LM, Pavlakis SG, DeVivo D, Piomelli S, Mohr JP. Transcranial Dop- pler measurements of the middle cerebral artery. Effect of hematocrit.
Stroke 1988; 19: 1466-9.
3. Daugirdas JT. Dialysis hypotension: a hemodynamic analysis. Kidney Int 1991; 39: 233-46.
4. Kooman J, Basci A, Pizzarelli F, Canaud B, Haage P, Fouque D, Konner K, Martin-Malo A, Pedrini L, Tattersall J, et al. EBPG guideline on haemody- namic instability. Nephrol Dial Transplant 2007; 22 Suppl 2: ii22-44.
5. Iseki K, Fukiyama K; Okawa Dialysis Study (OKIDS) Group; The Okinawa Dialysis Study (OKIDS) Group. Clinical demographics and long-term prognosis after stroke in patients on chronic haemodialysis. Nephrol Dial Transplant 2000; 15: 1808-13.
6. Stefanidis I, Bach R, Mertens PR, Liakopoulos V, Liapi G, Mann H, Heintz B. Influence of hemodialysis on the mean blood flow velocity in the mid- dle cerebral artery. Clin Nephrol 2005; 64: 129-37.
7. Postiglione A, Faccenda F, Gallotta G, Rubba P, Federico S. Changes in middle cerebral artery blood velocity in uremic patients after hemodialy- sis. Stroke 1991; 22: 1508-11.
8. Hata R, Matsumoto M, Handa N, Terakawa H, Sugitani Y, Kamada T. Ef- fects of hemodialysis on cerebral circulation evaluated by transcranial
Doppler ultrasonography. Stroke 1994; 25: 408-12.
9. Metry G, Spittle M, Rahmati S, Giller C, Giller A, Kaufman A, Schneditz D, Manno E, Brener Z, Boniece I, et al. Online monitoring of cerebral hemo- dynamics during hemodialysis. Am J Kidney Dis 2002; 40: 996-1004.
10. Skinner H, Mackaness C, Bedforth N, Mahajan R. Cerebral haemodyna- mics in patients with chronic renal failure: effects of haemodialysis. Br J Anaesth 2005; 94: 203-5.
11. Bron C, Hirt L, Halabi G, Saucy F, Qanadli SD, Haesler E. Asymptomatic high flow subclavian steal in a patient with hemodialysis access. J Vasc Access 2010; 11: 63-5.
12. Schenk WG 3rd. Subclavian steal syndrome from high-output brachioce- phalic arteriovenous fistula: a previously undescribed complication of dialysis access. J Vasc Surg 2001; 33: 883-5.
13. Jung JY, Kim JS, Chung PS, Woo SH, Rhee CK. Effect of vestibular rehabili- tation on dizziness in the elderly. Am J Otolaryngol 2009; 30: 295-9.
14. Schöning M, Walter J, Scheel P. Estimation of cerebral blood flow through color duplex sonography of the carotid and vertebral arteries in healthy adults. Stroke 1994; 25: 17-22.
15. Scheel P, Ruge C, Petruch UR, Schöning M. Color duplex measurement of
cerebral blood flow volume in healthy adults. Stroke 2000; 31: 147-50.
16. III. NKF-K/DOQI clinical practice guidelines for vascular access: update 2000. Am J Kidney Dis 2001; 37: S137-81.
17. Bakker SL, de Leeuw FE, den Heijer T, Koudstaal PJ, Hofman A, Breteler MM. Cerebral haemodynamics in the elderly: the rotterdam study. Neu- roepidemiology 2004; 23: 178-84.
18. Dandona P, James IM, Newbury PA, Woollard ML, Beckett AG. Cerebral blood flow in diabetes mellitus: evidence of abnormal cerebrovascular reactivity. BMJ 1978; 2: 325-6.
19. Griffith DN, Saimbi S, Lewis C, Tolfree S, Betteridge DJ. Abnormal cere- brovascular carbon dioxide reactivity in people with diabetes. Diabet Med 1987; 4: 217-20.
20. Rodriguez G, Nobili F, Celestino MA, Francione S, Gulli G, Hassan K, Mar- enco S, Rosadini G, Cordera R. Regional cerebral blood flow and cerebro- vascular reactivity in IDDM. Diabetes Care 1993; 16: 462-8.
21. Rho M, Perazella MA, Parikh CR, Peixoto AJ, Brewster UC. Serum vaso- pressin response in patients with intradialytic hypotension: a pilot study.
Clin J Am Soc Nephrol 2008; 3: 729-35.
Supplementary Table 1. Characteristics of patients reporting dizziness during hemodialysis
Parameters Patients with dizziness n = 14 (%) Patients without dizziness n = 65 (%) P value
Age, yr 61.7 ± 10.5 60.9 ± 10.8 0.440
Sex, male 7 (50) 42 (63) 0.387
Vascular risk factors Diabetes Hypertension Smoking Previous stroke
9 (64) 10 (71) 3 (21) 4 (31)
36 (54) 52 (78) 13 (19) 14 (21)
0.562 0.730 0.557 0.475
AV access side, Lt 9 (64) 52 (78) 0.317
Location of AV access, upper arm:forearm 4:10 (29:71) 23:44 (34:66) 0.765
Duration of HD with AV access, mon 50.5 ± 45.9 52.4 ± 39.4 0.332
Flow volume via AV access, mL/min 1,466.2 ± 862.3 1,040.8 ± 494.4 0.055
Change of hemodynamic variables (ΔHD-baseline) Δ Systolic BP
Δ Diastolic BP
Δ FV of VA, AV access side Δ FV of VA, opposite side Δ Total CBF
-7.6 ± 24.1 0.6 ± 17.4 -10.6 ± 19.1 -6.1 ± 21.1 -202.4 ± 164.0
-10.7 ± 20.0 -3.0 ± 10.8 -12.3 ± 24.1 -0.3 ± 23.6 -122.2 ± 217.7
0.347 0.226 0.371 0.334 0.071 Values are mean ± SD; Of the 81 total patients, 2 patients who could not respond to the dizziness questionnaire were excluded.