Relationship between Bone Mineral Density and Moderate to Severe Chronic Kidney Disease among General Population in Korea
Recent studies in Western countries have reported a significant association between glomerular filtration rate (GFR) and bone mineral density (BMD) in the absence of dialysis among the general population. However, there have been few studies regarding renal function and BMD among Korean or Asian subjects with moderate to severe (stage 3 or 4) chronic kidney disease (MS-CKD). The aim of the present study was to investigate the association between MS-CKD and BMD in the general Korean population. BMD, serum creatinine and other measures were obtained from 3,190 subjects (1,428 males and 1,762 females; the fourth Korean National Health and Nutrition Examination Survey). GFR was estimated using the Cockcroft-Gault formula, with adjustment for body surface area.
After adjustment for all variables, multiple regression analysis showed that BMD in the femur neck, total femur and lumbar spine were positively associated with eGFR in both males and females. Additional analysis showed that MS-CKD was also significantly associated with osteoporosis in both males and females (odds ratio [OR] 2.20, 95%
confidence interval [CI] 1.15-4.20 in males; and OR 1.96, 95% CI 1.33-2.88 in females).
Individuals with MS-CKD may be at higher risk of osteoporosis even among Asians.
Key Words: Glomerular Filtration Rate; Bone Density; Osteoporosis; Renal Insufficiency;
KNHANES Jun-Pyo Myong, Hyoung-Ryoul Kim,
Jung-Wan Koo, and Chung Yill Park Department of Occupational and Environmental Medicine, Center for Occupational and
Environmental Medicine, Seoul St. Mary’s Hospital, The Catholic University of Korea, Seoul, Korea Received: 29 August 2012
Accepted: 25 January 2013 Address for Correspondence:
Jung-Wan Koo, MD
Department of Preventive Medicine and Center for Occupational and Environmental Medicine, College of Medicine, The Catholic University of Korea, 222 Banpo-daero, Seocho-gu, Seoul 137-701, Korea
Tel: +82.2-2258-6268, Fax: +82.2-2258-6678 E-mail: [email protected]
http://dx.doi.org/10.3346/jkms.2013.28.4.569 • J Korean Med Sci 2013; 28: 569-574 Nephrology
INTRODUCTION
End-stage renal disease (ESRD) is a well-established risk factor for reduced bone mineral density (BMD) and osteoporosis as well as for hip fracture (1-3). Since the relationship between re- nal function and BMD in ESRD patients has been extensively investigated (4-7), it is suggested that an association between a moderate to severe decrease in glomerular filtration rate (GFR) in the absence of dialysis (K-DOQI [Kidney Disease Outcomes Quality Initiative] 3 and 4) and BMD (or osteoporosis) may exist among the general population (6, 7). Though the values of GFR and BMD vary across ethnicity, most previous studies of the potential association between renal function and BMD among the general population with stage 3 or 4 CKD have been per- formed in Western countries (6, 7). There have been few studies regarding renal function and BMD among the general popula- tion with moderate to severe (stage 3 or 4) chronic kidney dis- ease (MS-CKD) in Korea or Asia. Furthermore, former studies have been performed only in postmenopausal women (8, 9) or with small sample sizes (9).
In addition to ethnicity, previous studies concerning bone health have also been conducted mainly for women, especially postmenopausal women (8-10). Few studies have been per-
formed on men. Given the increasing prevalence of both osteo- genesis and CKD without dialysis and osteoporosis in Asian countries (11, 12), even among men, evaluating the relation- ship between decreased renal function and BMD in both Kore- an men and women is of great importance. Therefore, we in- vestigate the association between MS-CKD and BMD in the general Korean population.
MATERIALS AND METHODS Data source and study subjects
The present study used the BMD data subset of the Korean Na- tional Health and Nutrition Examination Survey IV (KNHANES IV) of 2008. The KNHANES collected representative data on the health, nutritional status, and BMD of the civilian, non-institu- tionalized Korean general population. A stratified multistage clustered probability design was used to select representative samples of non-institutionalized Korean civilians for the KNH- ANES (13). The survey data were publicly available. A total of 3,583 subjects were recruited in the BMD sub-dataset. We ex- cluded the data from individuals that did not include serum creatinine levels (n = 116). The data for BMD and clinical ex- amination findings, including serum creatinine levels, were avail-
able for a total of 3,467 individuals. Individuals with incomplete survey responses (n = 8), diagnosis and treatment of osteopo- rosis (n = 257), or ESRD (eGFR < 15 mL/min/1.73 m2) and dial- ysis (n = 12) were also excluded, leaving a total of 3,190 subjects.
BMD and definition of osteoporosis
In KNHANES IV, subjects were examined in a mobile examina- tion vehicle. Licensed, trained technicians measured BMD in men and non-pregnant women aged ≥ 20 yr by using dual en- ergy X-ray absorptiometry (DXA; HOLOGIC, DISCOVERY-W, Bedford, MA, USA). BMD was measured at several areas (whole femur, femoral neck and lumbar spine). BMD was expressed as g/cm2. For the purpose of DXA quality control, daily automatic calibration was performed to maintain a precision standard of 1.5% for the total hip measurements according to the manufac- turer’s instructions (13). Osteoporosis was operationally de- fined as a T-score of equal or below -2.5. T-score was estimated using the following equation: (measured BMD - mean of maxi- mum BMD)/standard deviation (SD) of maximum BMD. As there is no universal consensus on maximum BMD, an Asian standard (Japanese) measured for BMD was used. The mean (± SD) values in the femur neck were 0.846 (± 0.124) for males and 0.803 (± 0.107) for females. The values in the total femur were 0.940 (± 0.137) for males and 0.851 (± 0.115) for females.
The values in the lumbar spine were 1.024 (± 0.120) for males and 1.006 (± 0.115) for females (14).
GFR estimation
In KNHANES IV, serum creatinine was measured using the Ja- ffe method and a Hitachi Automatic Analyzer 7600 (Hitachi, Tokyo, Japan), and serum creatinine concentrations were cali- brated to a creatinine standard. Renal function was estimated using the estimated glomerular filtration rate (eGFR). As Modi- fication of Diet in Renal Disease (MDRD) study population had been derived from almost non-dialysis patients with CKD (15), the GFR of healthy people might be underestimated by the MD- RD equation. Therefore, we estimated the GFR (mL/min/1.73 m2) using the following Cockcroft-Gault (CG) formula: eGFR (mL/min/1.73 m2) = ([140-age] × weight × [0.85 if subject was female])/72 × serum creatinine, adjusted for body surface area (BSA). BSA was calculated as follows: BSA = weight (kg)0.425× height (cm)0.725× 0.007184 (16). With K-DOQI, MS-CKD was defined as subjects with eGFR < 60 mL/min/1.73 m2 (K-DOQI stage 3 or 4).
Covariate assessments
Body mass index (BMI) was calculated by dividing weight (kg) by square of height (m2). BMI was classified into the following 3 groups: underweight (BMI < 18.5 kg/m2), normal weight (BMI 18.5 kg/m2 to < 25 kg/m2) and obesity (BMI ≥ 25 kg/m2) (13).
Daily calcium intake (mg/day) was calculated using the 24-hr
recall method. Information concerning cigarette smoking (nev- er smoked & ex-smoker/ current smoking), alcohol consump- tion (less than once per month/more than once per month), exercise (none/1-2 times per week/3-4 times per week/5 times or more per week), and menopause and hormone replacement therapy, and fracture-related history, such as any history of os- teoporosis in family members and any history of fracture in themselves (no/yes) were assessed using survey questionnaires.
Statistical analysis
All statistical analyses were performed using SAS software, ver- sion 9.2 (SAS Institute Inc, Cary, NC, USA) to account for the stratified multistage clustered probability design and survey weights. The age-standardized prevalence of osteoporosis was measured by using the standardization methods for the popu- lation derived from the 2005 Korean Census as the standard population. For continuous variables (age, BMI, daily calcium intake, vitamin D level, and BMD at various sites), a univariate regression analysis was applied to evaluate the difference in means between subjects with and without MS-CKD according to statistical guidelines (13). For categorical variables (BMI, smo- king status, exercise, alcohol consumption, fracture-related his- tory, and menopause & hormonal replacement threrapy), a Rao-Scott chi-square analysis was applied to account for differ- ences in terms of the absence or presence of MS-CKD. The re- lationship between eGFR and BMD was determined in terms of sex by MS-CKD stratified simple and multiple regression analysis (SAS syntax: SURVEYREG); after adjustment for age and BMI, covariates were related to bone health (age, BMI, dai- ly calcium intake, vitamin D level, alcohol consumption, ciga- rette smoking, exercise, and fracture-related history, as well as menopause and hormone replacement therapy in females).
The association between MS-CKD and osteoporosis was esti- mated using a logistic regression model. For the first step, ad- justments were made for age and BMI. Next, multiple logistic regression analysis included all variables. The reference catego- ry in each model was an eGFR of ≥ 60 mL/min/1.73 m2.
Ethics statement
The design of the present study was approved by institutional review board of the Catholic University of Korea, College of Medicine (approval ID: CUMC11U139). The Korea Center for Disease Control and Prevention received the informed consent from all participants (13). The data are publicly available in web- site (13).
RESULTS
The estimated percentages of subjects with MS-CKD were 6.4%
in males and 17.0% in females. The subjects with MS-CKD were older than those with an eGFR of ≥ 60 mL/min/1.73 m2. Both
males and females with MS-CKD were more likely to have lower BMD and calcium intake. The subjects who were underweight or normal weight, former smokers/non-smokers, and who had a history of fracture risks had higher prevalence of MS-CKD in all four groups. Women with MS-CKD were more likely to be taking hormone replacement therapy (Table 1).
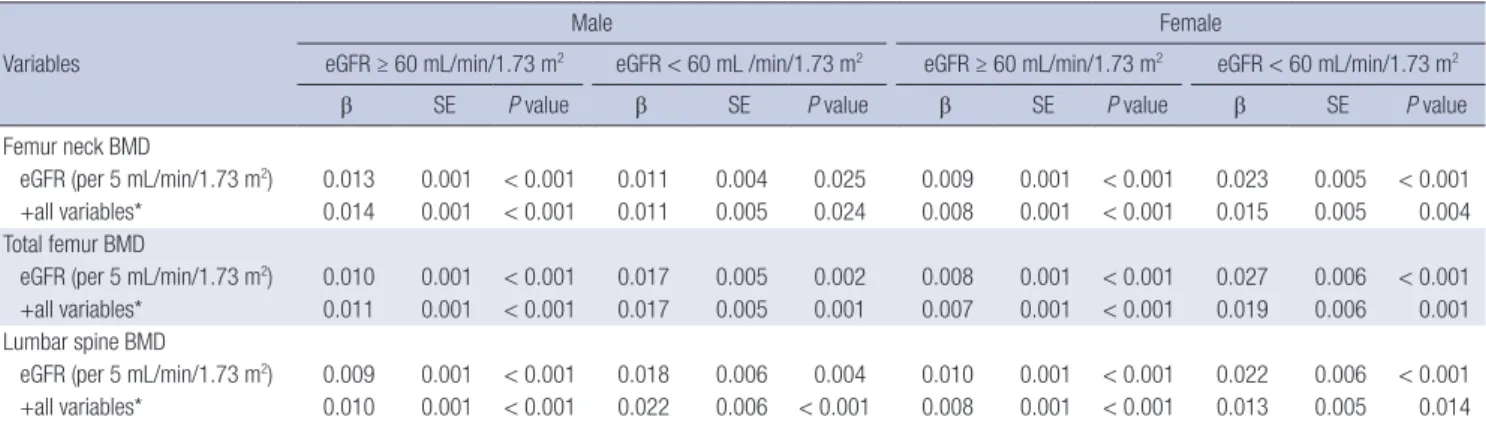
Table 2 shows the association between eGFR (per 5 mL/min/
1.73 m2) and BMD. Multiple regression analysis revealed that in both males and females, the BMD at femur neck, total femur, and lumbar spine area were positively associated with eGFR among those with MS-CKD. The regression coefficients of eGFR on BMD were higher in females with MS-CKD (β = 0.013-0.019) at all sites than in those with an eGFR of ≥ 60 mL/min/1.73 m2 (β = 0.007-0.008). For males, the regression coefficients of eGFR on BMD were higher in males with MS-CKD (β = 0.017-0.022) at total femur (P < 0.001) and lumbar spine (P = 0.014) than in
those with an eGFR of ≥ 60 mL/min/1.73 m2 (β = 0.010-0.011) (Table 2).
Table 3 shows the association between MS-CKD and osteo- porosis. After adjustment for all confounding factors, the MS- CKD was significantly associated with osteoporosis (odds ratio [OR] 2.20, 95% confidence interval [CI] 1.15-4.20 in males; and OR 1.96, 95% CI 1.33-2.88 in females) (Table 3).
DISCUSSION
Our study results revealed that there was a positive association between eGFR and BMD in the Korean population and that both men and women with MS-CKD were likely to have a higher decline in BMD than those with an eGFR of ≥ 60 mL/min/1.73 m2 in multiple linear regression analysis.
In ESRD patients undergoing dialysis, the bone loss resulted Table 1. Characteristics of 3,190 subjects by sex and moderate to severe chronic kidney disease
Parameters
Male Female
Estimated GFR
P value
Estimated GFR
P value eGFR ≥ 60
(mL/min/1.73 m2) eGFR < 60
(mL/min/1.73 m2) eGFR ≥ 60
(mL/min/1.73 m2) eGFR < 60 (mL/min/1.73 m2)
No. % (SE) No. % (SE) No. % (SE) No. % (SE)
Total 1,273 93.6 (0.7) 155 6.4 (0.7) 1,412 83.0 (1.5) 350 17.0 (1.5)
Age* (yr) 45.5 (0.4) 69.6 (0.8) < 0.001 42.4 (0.4) 64 (0.8) < 0.001
BMI* (kg/m2) 24.1 (0.1) 21.2 (0.2) < 0.001 23.4 (0.1) 22.1 (0.2) < 0.001
Obesity
BMI < 18.5 35 3.3 (0.6) 32 22.5 (4.1) < 0.001 70 5.8 (0.7) 49 17.3 (2.9) < 0.001
BMI: 18.5-25 775 60.3 (1.5) 106 64.1 (4.5) 930 68.1 (1.5) 244 70.4 (3.0)
BMI-25 463 36.5 (1.5) 17 13.5 (3.3) 412 26.1 (1.6) 57 12.3 (1.7)
Ca intake* (mg/day) 548.4 (13.1) 392.7 (36.0) 0.300 457.1 (11.2) 369.5 (18.6) 0.096
Vitamin D (ng/mL) 22.7 (0.4) 25.6 (0.7) < 0.001 19.1 (0.4) 20.0 (0.6) 0.142
Femoral neck BMD* (g/cm2) 0.844 (0.005) 0.661 (0.010) < 0.001 0.748 (0.004) 0.603 (0.009) < 0.001 Total femoral BMD* (g/cm2) 0.989 (0.004) 0.833 (0.011) < 0.001 0.889 (0.004) 0.749 (0.010) < 0.001 Lumbar spine BMD* (g/cm2) 0.983 (0.004) 0.883 (0.015) < 0.001 0.963 (0.005) 0.796 (0.010) < 0.001 Alcohol
1 time/month > 306 22.2 (1.7) 70 43.9 (4.8) < 0.001 755 51.9 (1.3) 262 72.5 (2.4) < 0.001
1 time/month ≤ 967 77.8 (1.7) 85 56.1 (4.8) 657 48.1 (1.3) 88 27.5 (2.4)
Smoking
Current 603 49.4 (1.4) 54 35.1 (4.9) 0.007 99 7.4 (1.0) 28 8.8 (2.2) 0.561
Former/non 670 50.6 (1.4) 101 64.9 (4.9) 1,313 92.6 (1.0) 322 91.2 (2.2)
Exercise
No 334 24.3 (1.5) 69 45.2 (4.6) < 0.001 583 40.2 (1.9) 184 53.6 (3.6) 0.009
1-2/week 325 28.2 (1.4) 21 12.3 (3.2) 298 21.7 (1.2) 47 15.6 (2.1)
3-4/week 250 20.8 (1.1) 21 14.3 (3.8) 222 16.4 (1.1) 43 12.1 (3.1)
5 ≤ /week 364 26.7 (1.4) 44 28.2 (4.8) 309 21.7 (1.6) 76 18.7 (2.3)
Fracture-related history†
No 1,074 85.5 (1.3) 139 85.8 (4.1) 0.937 1,167 82.2 (1.2) 299 84.3 (2.4) 0.460
Yes 199 14.5 (1.3) 16 14.2 (4.1) 245 17.8 (1.2) 51 15.7 (2.4)
Menopause & HRT‡ status
Pre-menopause 363 20.8 (1.4) 266 70.5 (3.4) < 0.001
Post-menopause & HRT (-) 875 66.9 (1.4) 68 24.4 (3.1)
Post-menopause & HRT (+) 174 12.3 (0.8) 16 5.1 (1.8)
All values were numbers of subjects, estimated percent and standard error (SE) with weight unless otherwise stated. As there is no consensus on maximum BMD for Koreans, the Japanese standards for BMD at those three sites were used. The mean (standard deviation, SD) values for femoral neck = 0.846 (0.124) for men and 0.803 (0.107) for women. The mean (SD) values in total femur = 0.940 (0.137) for men and 0.851 (0.115) for women. The mean (SD) values in lumbar spine = 1.024 (0.120) for men and 1.006 (0.115) for women. *Weighted mean (SE); †Any history of osteoporosis in family member and any history of fracture in themselves; ‡HRT hormone replacement therapy.
from secondary hyperparathyroidism. However, there have been few reports of obvious mechanisms for the association between BMD and MS-CKD in terms of the degrees of CKD.
Recently, some studies have suggested several possible mecha- nisms behind bone loss in patients with MS-CKD without dial- ysis (17-19). As GFR decreases below 60 mL/min/1.73 m2, phos- phate retention in blood triggers a rise in parathyroid hormone (PTH) and fibroblast growth factor-23 (FGF-23) as well as a de- cline in tubular 1,25(OH)2 vitamin D; these changes may have a negative influence on BMD (17). Another possible mechanism is that chronic metabolic acidosis characterized by decreased serum bicarbonate may result in a gradual dissolution of bone mineral (18). Consistent with our study results, a study concern- ing early impairment of bony structures revealed that early tra- becular microarchitectures were seen in K-DOQI stages II throu- gh IV (20). That study also showed early impairments of bony structures among early stage CKD patients. However, they did not explain why the more severe degrees of CKD had greater bone loss. Therefore, further studies should be conducted to demonstrate a biologically plausible explanation of difference in bone loss between early and severe stage CKD.
There have been few studies concerning the association be- tween BMD and renal function in males. Our study demon-
strated that both males and females with MS-CKD had higher ORs for osteoporosis. Consistent with our study results, a pro- spective study has supported this association (4). In the pro- spective Osteoporotic Fractures in Men (MrOS) study, a corre- lation between changes in total hip BMD and the eGFR quar- tiles (calculated using a MDRD formula) was reported. The mean annualized BMD percentage changes of -0.58%, -0.39%, -0.37%, and -0.31% for the first (lowest) to fourth (highest) eGFR quar- tiles, respectively (P for linear trend = 0.020) were also shown in multiple regression analysis (4). As this study demonstrated a significant association between eGFR and BMD observed in the males from their cohort, its results suggested that a positive association between eGFR and BMD might exist in males.
Since ethnic differences in bone density and GFR are well described (10, 21, 22), we can assume that the relationship be- tween GFR and BMD may be different among ethnic groups.
The effect of height, weight and/or body composition (fat mass, lean body mass, etc.) may result in ethnic differences in bone mass (23). Our study demonstrated that the age-standardized prevalence of osteoporosis in individuals with MS-CKD were lower (9.5% for males and 18.0% for females in Table 3) than those of previous studies in Western countries (6, 24). However, due to the fact that subjects were recruited from a certain hos- Table 2. Univariate and multiple linear regression of glomerular filtration rate according to bone mineral density in subjects by sex and moderate to severe chronic kidney disease
Variables
Male Female
eGFR ≥ 60 mL/min/1.73 m2 eGFR < 60 mL /min/1.73 m2 eGFR ≥ 60 mL/min/1.73 m2 eGFR < 60 mL/min/1.73 m2
β SE P value β SE P value β SE P value β SE P value
Femur neck BMD
eGFR (per 5 mL/min/1.73 m2) 0.013 0.001 < 0.001 0.011 0.004 0.025 0.009 0.001 < 0.001 0.023 0.005 < 0.001
+all variables* 0.014 0.001 < 0.001 0.011 0.005 0.024 0.008 0.001 < 0.001 0.015 0.005 0.004
Total femur BMD
eGFR (per 5 mL/min/1.73 m2) 0.010 0.001 < 0.001 0.017 0.005 0.002 0.008 0.001 < 0.001 0.027 0.006 < 0.001
+all variables* 0.011 0.001 < 0.001 0.017 0.005 0.001 0.007 0.001 < 0.001 0.019 0.006 0.001
Lumbar spine BMD
eGFR (per 5 mL/min/1.73 m2) 0.009 0.001 < 0.001 0.018 0.006 0.004 0.010 0.001 < 0.001 0.022 0.006 < 0.001
+all variables* 0.010 0.001 < 0.001 0.022 0.006 < 0.001 0.008 0.001 < 0.001 0.013 0.005 0.014
*For male: adjusted for (age, BMI, daily calcium intake, blood vitamin D level, alcohol consumption, smoking, exercise, and any history of osteoporosis in family member and any history of fracture in themselves); For females: adjusted for (age, BMI, daily calcium intake, blood vitamin D level, alcohol consumption, smoking, exercise, any history of osteoporosis in family member and any history of fracture in themselves, and menopause & hormone replacement therapy).
Table 3. Multiple logistic regression for the association between osteoporosis and moderate to severe chronic kidney disease (MS-CKD) by sex
Kidney disease
Male Female
Prevalence of osteoporosis Model 1* Model 2† Prevalence of osteoporosis Model 1* Model 2‡ Age-standardized
% (95% CI) OR (95% CI) OR (95% CI) Age-standardized
% (95% CI) OR (95% CI) OR (95% CI)
MS- CKD No 6.2 (4.7-7.8) 1 1 14.2 (9.3-19.1) 1 1
Yes 9.5 (2.0-17.1) 3.28 (1.82-5.58) 2.20 (1.15-4.20) 18.0 (14.5-21.6) 2.66 (1.88-3.74) 1.96 (1.33-2.88) eGFR estimated glomerular filtration; OR odds ratio; CI confidence interval. Osteoporosis was defined as a T-score < -2.5 for any sites of the measured bones (total femur, femo- ral neck, or lumbar spine). The age-standardized prevalence of osteoporosis was measured by the standardization methods for the population derived from the 2005 Korean Census as the standard population. *Adjusted for age. †Adjusted for (age, BMI, smoking, exercise, frequency of alcohol consumption, daily calcium intake, blood vitamin D level and any history of osteoporosis in family member and any history of fracture in themselves). ‡Adjusted for (age, BMI, smoking, exercise, frequency of alcohol consumption, daily calcium intake, blood vitamin D level, any history of osteoporosis in family member and any history of fracture in themselves, and HRT & menopause).
pital in Ireland, there may have been a selection bias in that older subjects or those with more co-morbid diseases related to osteoporosis or kidney disease had been referred to the hospi- tal for DXA and assessments of renal function (24). Environ- mental factors and lifestyle may also affect ethnic differences in bone density. A previous study has shown that US born Japa- nese females may have significantly higher body fat and BMD than native Japanese females due to lifestyle differences (25).
Thus, ethnic and environmental differences may play an im- portant role in evaluating association between BMD and other factors. Further studies are needed to generalize the association between BMD and MS-CKD in the absence of dialysis in the Korean general population as well as in other ethnic groups.
In our study, serum vitamin D was higher in males with MS- CKD than in those without. Our data was not in accordance with previously described mechanism through vitamin D defi- ciency (17). After adjustment for potential confounding factors, such as age and smoking, multiple regression analysis was per- formed (not shown in Tables). Although a positive regression coefficient was found for MS-CKD (2.915; comparing to those with eGFR ≥ 60 mL/min/1.73 m2) and serum vitamin D levels (unadjusted), non significant regression coefficient of MS-CKD (-0.157; comparing to those with eGFR ≥ 60 mL/min/1.73 m2) was also seen after adjustment for age and smoking rate. There- fore, age and smoking rate might serve as confounders for se- rum vitamin D levels. Furthermore, with the limitation of the KNHANES survey, the authors could not check for supplement use including vitamin D or the active form of vitamin D (includ- ing 1,25(OH)2D; calcitriol). Thus, further longitudinal studies are required to confirm this issue.
Our study had some limitations. First, the data were derived from the cross-sectional KNHANES survey, and so we could not evaluate the causal relationship between MS-CKD, BMD and osteoporosis. Second, measurement of GFR with 24-hr urine collection was not available. A 24-hr urine collection is a more precise method for measuring creatinine clearance or GFR than the CG formula and MDRD equation used in research, and this urine collection was used in a previous epidemiologi- cal study (26). However, this method is not feasible in the con- text of population-based studies, such as the KNHANES and the NHANES, which estimated eGFR using serum creatinine instead (6, 7, 9). Third, it was necessary to estimate the figures for patients with a family history of osteoporosis and the num- ber of patients with ‘fragility’ fractures at the age of > 50 yr. How- ever, due to the limitation of our questionnaire, we could not evaluate this issue.
Our study had some strengths, including the use of a large, healthy and community-based study population. To the best of our knowledge, our study is the first to evaluate the association between MS-CKD, BMD and osteoporosis in the Korean gener- al population. In addition, we performed sex-stratification and
age-standardization for the prevalence of MS-CKD as well as adjustments for known confounder, including eGFR and BMD.
This point is important because the CG formula uses age, sex, weight and BSA to estimate GFR and because it would be un- clear whether the observed association was a consequence of renal dysfunction or confounders, such as age or sex.
In conclusion, the results of present study provide important evidence to support an association between GFR and BMD in both males and females and suggest that osteoporosis may be highly prevalent in individuals with MS-CKD in the Korean ge- neral population. Further longitudinal studies are warranted to investigate the potential effects of MS-CKD on individuals from the general population who are vulnerable to osteoporosis. Hen- ce, screening procedures for the early detection of such patients should be established.
ACKNOWLEDGMENTS
The authors have no conflicts of interest to disclose.
REFERENCES
1. Alem AM, Sherrard DJ, Gillen DL, Weiss NS, Beresford SA, Heckbert SR, Wong C, Stehman-Breen C. Increased risk of hip fracture among patients with end-stage renal disease. Kidney Int 2000; 58: 396-9.
2. Lindberg JS, Moe SM. Osteoporosis in end-state renal disease. Semin Nephrol 1999; 19: 115-22.
3. Stehman-Breen CO, Sherrard DJ, Alem AM, Gillen DL, Heckbert SR, Wong CS, Ball A, Weiss NS. Risk factors for hip fracture among patients with end-stage renal disease. Kidney Int 2000; 58: 2200-5.
4. Ishani A, Paudel M, Taylor BC, Barrett-Connor E, Jamal S, Canales M, Steffes M, Fink HA, Orwoll E, Cummings SR, et al. Renal function and rate of hip bone loss in older men: the Osteoporotic Fractures in Men Study. Osteoporos Int 2008; 19: 1549-56.
5. Jamal SA, Swan VJ, Brown JP, Hanley DA, Prior JC, Papaioannou A, Lang- setmo L, Josse RG; Canadian Multicentre Osteoporosis Study Research Group. Kidney function and rate of bone loss at the hip and spine: the Canadian Multicentre Osteoporosis Study. Am J Kidney Dis 2010; 55:
291-9.
6. Klawansky S, Komaroff E, Cavanaugh PF Jr, Mitchell DY, Gordon MJ, Connelly JE, Ross SD. Relationship between age, renal function and bone mineral density in the US population. Osteoporos Int 2003; 14:
570-6.
7. Nickolas TL, McMahon DJ, Shane E. Relationship between moderate to severe kidney disease and hip fracture in the United States. J Am Soc Nephrol 2006; 17: 3223-32.
8. Kaji H, Yamauchi M, Yamaguchi T, Shigematsu T, Sugimoto T. Mild re- nal dysfunction is a risk factor for a decrease in bone mineral density and vertebral fractures in Japanese postmenopausal women. J Clin En- docrinol Metab 2010; 95: 4635-42.
9. Kim HL, Park IY, Choi JM, Hwang SM, Kim HS, Lim JS, Kim M, Son MJ.
A decline in renal function is associated with loss of bone mass in Korean postmenopausal women with mild renal dysfunction. J Korean Med Sci
2011; 26: 392-8.
10. Barrett-Connor E, Siris ES, Wehren LE, Miller PD, Abbott TA, Berger ML, Santora AC, Sherwood LM. Osteoporosis and fracture risk in wom- en of different ethnic groups. J Bone Miner Res 2005; 20: 185-94.
11. International Osteoporosis Foundation. The Asian Audit: epidemiology, costs and burden of osteoporosis in Asia 2009. Nyon: IOF, 2009.
12. Meguid El Nahas A, Bello AK. Chronic kidney disease: the global chal- lenge. Lancet 2005; 365: 331-40.
13. Korea Center for Disease Control and Prevention. Korea National Health and Nutrition Examination Survey. Available at http://knhanes.cdc.
go.kr [accessed on 28 August 2012].
14. Orimo H, Hayashi Y, Fukunaga M, Sone T, Fujiwara S, Shiraki M, Kushi- da K, Miyamoto S, Soen S, Nishimura J, et al. Diagnostic criteria for pri- mary osteoporosis: year 2000 revision. J Bone Miner Metab 2001; 19:
331-7.
15. Levey AS, Bosch JP, Lewis JB, Greene T, Rogers N, Roth D. A more accu- rate method to estimate glomerular filtration rate from serum creatinine:
a new prediction equation: Modification of Diet in Renal Disease Study Group. Ann Intern Med 1999; 130: 461-70.
16. Botev R, Mallié JP, Couchoud C, Schück O, Fauvel JP, Wetzels JF, Lee N, De Santo NG, Cirillo M. Estimating glomerular filtration rate: Cockcroft- Gault and Modification of Diet in Renal Disease formulas compared to renal inulin clearance. Clin J Am Soc Nephrol 2009; 4: 899-906.
17. Gal-Moscovici A, Sprague SM. Osteoporosis and chronic kidney disease.
Semin Dial 2007; 20: 423-30.
18. Lemann J Jr, Litzow JR, Lennon EJ. The effects of chronic acid loads in normal man: further evidence for the participation of bone mineral in the defense against chronic metabolic acidosis. J Clin Invest 1966; 45:
1608-14.
19. Jamal SA, West SL, Miller PD. Fracture risk assessment in patients with chronic kidney disease. Osteoporos Int 2012; 23: 1191-8.
20. Bacchetta J, Boutroy S, Vilayphiou N, Juillard L, Guebre-Egziabher F, Rognant N, Sornay-Rendu E, Szulc P, Laville M, Delmas PD, et al. Early impairment of trabecular microarchitecture assessed with HR-pQCT in patients with stage II-IV chronic kidney disease. J Bone Miner Res 2010;
25: 849-57.
21. Looker AC, Wahner HW, Dunn WL, Calvo MS, Harris TB, Heyse SP, Johnston CC Jr, Lindsay R. Updated data on proximal femur bone min- eral levels of US adults. Osteoporos Int 1998; 8: 468-89.
22. Matsuo S, Yasuda Y, Imai E, Horio M. Current status of estimated glo- merular filtration rate (eGFR) equations for Asians and an approach to create a common eGFR equation. Nephrology (Carlton) 2010; 15: 45-8.
23. Andersen S, Boeskov E, Laurberg P. Ethnic differences in bone mineral density between inuit and Caucasians in north Greenland are caused by differences in body size. J Clin Densitom 2005; 8: 409-14.
24. Kinsella S, Chavrimootoo S, Molloy MG, Eustace JA. Moderate chronic kidney disease in women is associated with fracture occurrence indepen- dently of osteoporosis. Nephron Clin Pract 2010; 116: c256-62.
25. Kin K, Lee JH, Kushida K, Sartoris DJ, Ohmura A, Clopton PL, Inoue T.
Bone density and body composition on the Pacific rim: a comparison between Japan-born and U.S.-born Japanese-American women. J Bone Miner Res 1993; 8: 861-9.
26. Yendt ER, Cohanim M, Jarzylo S, Jones G, Rosenberg G. Bone mass is related to creatinine clearance in normal elderly women. J Bone Miner Res 1991; 6: 1043-50.