Received : May 18, 2017
Revised : June 15, 2017
Accepted : June 18, 2017
Correspondence to: Young Hwa Choi, Department of Infectious Diseases, Ajou University School of Medicine, 164 WorldCup-ro, Yeongtong-gu, Suwon 16499, Korea
Tel: 031-219-5112, Fax: 031-219-5109 E-mail: [email protected]
*This study was supported by a grant of year 2015-2016 from the Korea Centers for Disease Control and Prevention.
전국의료관련감염감시체계 중환자실 부문 결과 보고:
2015년 7월부터 2016년 6월
곽이경1ㆍ최영화2ㆍ최준용3ㆍ유현미4ㆍ이상오5ㆍ김홍빈6ㆍ한수하7ㆍ이미숙8ㆍ김효열9ㆍ김성란10 김태형11ㆍ박선희12ㆍ유소연13ㆍ최평균6ㆍ은병욱14ㆍ신명진15ㆍ최지연16ㆍ구현숙17ㆍ어 영18ㆍ유진홍12
인제대학교 일산백병원 내과1, 아주대학교 의과대학 감염내과2, 연세대학교 의과대학 내과학교실3, 인제대학교 상계백병원 감염관리실4, 울산대학교 의과대학 서울아산병원 감염내과5, 서울대학교 의과대학 내과6,
순천향대학교 의과대학 간호학과7, 경희대학교 의과대학 내과8, 연세대학교 원주의과대학 내과9, 고려대학교 구로병원 감염관리실10, 순천향대학교 의과대학 내과11, 가톨릭대학교 의과대학 내과12, 가톨릭대학교 성빈센트병원 감염관리실13, 을지대학교 의과대학 소아과14, 분당서울대학교병원 감염관리실15,
중앙대학교병원 감염관리팀16, 질병관리본부 감염병감시과17, 연세대학교 원주의과대학 진단검사의학과18
Korean National Healthcare-associated Infections Surveillance System, Intensive Care Unit Module Report: Summary of Data
from July 2015 through June 2016
Yee Gyung Kwak
1, Young Hwa Choi
2, Jun Yong Choi
3, Hyeon Mi Yoo
4, Sang-Oh Lee
5, Hong Bin Kim
6, Su Ha Han
7, Mi Suk Lee
8, Hyo Youl Kim
9, Sung Ran Kim
10, Tae Hyong Kim
11, Sun Hee Park
12,
So-Yeon Yoo
13, Pyoeng Gyun Choe
6, Byung Wook Eun
14, Myoung Jin Shin
15, Ji-youn Choi
16, Hyun-Sook Koo
17, Young Uh
18, Jin-Hong Yoo
12Department of Internal Medicine, Inje University Ilsan Paik Hospital
1, Goyang, Department of Infectious Diseases, Ajou University School of Medicine
2, Suwon, Department of Internal Medicine, Yonsei University College of Medicine
3, Infection Control Office, Inje University Sanggye Paik Hospital
4, Department of Infectious Diseases, Asan Medical Center, University of Ulsan College of Medicine
5, Department of Internal Medicine, Seoul National University College of Medicine
6, Seoul, Department of Nursing, Soonchunhyang University College of Medicine
7, Cheonan, Department of Internal Medicine, Kyung Hee University
School of Medicine
8, Seoul, Department of Internal Medicine, Yonsei University Wonju College of Medicine
9, Wonju, Infection Control Office, Korea University Guro Hospital
10, Department of Internal Medicine, Soonchunhyang University College of Medicine
11, Seoul, Department of Internal Medicine, College of Medicine, The Catholic University of Korea
12, Seoul, Infection Control Office,
The Catholic University of Korea St. Vincent's Hospital
13, Suwon, Department of Pediatrics, Eulji University School of Medicin
14, Seoul, Infection Control Office, Seoul National University Bundang Hospital
15, Seongnam, Infection Control Team, Chungang University Hospital
16,
Seoul, Division of Infectious Disease Control, Korea Centers for Disease Control and Prevention
17, Osong, Department of Laboratory Medicine, Yonsei University Wonju College of Medicine
18, Wonju, Korea
Background: In this report, we present the annual data of the intensive care unit (ICU) module of the Korean National Healthcare-associated Infections Surveillance System (KONIS) from July 2015 through June 2016.
Methods: We performed a prospective surveillance of healthcare-associated urinary tract infection (UTI), bloodstream
infection (BSI), and pneumonia (PNEU) at 178 ICUs in 103 hospitals using KONIS surveillance system. Healthcare-
associated infections (HAI) rates were calculated as the numbers of infections per 1,000 patient-days or device-days.
Results: A total of 2,608 HAIs were found during the study period: 718 UTIs (702 cases were urinary catheter- associated), 1,236 BSIs (1,058 were central line-associated), and 654 PNEUs (389 were ventilator-associated). The rate of catheter-associated UTIs (CAUTI) was 0.88 cases per 1,000 device-days (95% confidence interval [CI, 0.82-0.95]) and urinary catheter utilization ratio was 0.84 (95% CI, 0.839-0.841). The rate of central line-associated BSIs (CLABSI) was 2.20 (95% CI, 2.07-2.33) per 1,000 device-days and the utilization ratio was 0.51 (95% CI, 0.509-0.511). The rate of ventilator-associated PNEUs (VAPs) was 1.00 (95% CI, 0.91-1.11) per 1,000 device-days and the utilization ratio was 0.41 (95% CI, 0.409-0.411). The ventilator utilization ratio was lower; however, VAPs were more common in the ICUs of hospitals with 700-899 beds (1.23 [95% CI, 1.07-1.42]) than in those of hospitals with more than 900 beds (0.87 [95%
CI, 0.71-1.06]).
Conclusion: Compared with the previous year, the device utilization ratio was similar but the rate of VAP was significantly decreased.
Keywords: Healthcare-associated Infection, Intensive care unit, KONIS, Korean National Healthcare-associated Infections Surveillance System
Introduction
의료관련감염 감시는 의료관련감염의 기본자 료를 확보함으로써 감염관리 활동의 우선순위를 정하고 의료관련감염의 대책을 마련하는 데에 중요하다. 의료관련감염은 개별 병원에만 국한된 문제가 아니기 때문에 지속적이고 효율적인 전 국적인 감시체계가 필요하며 전국적인 의료관련 감염 감시체계를 운영하는 것은 그 나라의 의료 관련 감염률을 감소시키는 효과가 있다고 알려 져 있다[1-3].
전국의료관련감염감시체계(Korean National He- althcare-associated Infections Surveillance System, KONIS; 2016년에 Korean Nosocomial Infections Surveillance System에서 명칭 변경)는 2006년도에 시작된 우리나라의 대표적인 의료관련감염 감시체 계이다[4,5]. KONIS는 전국에서 자발적으로 참여 하는 병원들에 의해 이루어지며 중환자실 부문은 표준화된 방법으로 각 병원의 중환자실에서 발생 하는 요로감염(urinary tract infection), 혈류감염 (bloodstream infection)과 폐렴(pneumonia)에 대한 감시를 수행하고 있다. 이 보고서는 KONIS 중환자 실 부문 2015년 7월부터 2016년 6월까지의 연간자 료이다.
Materials and Methods
2015년 7월부터 2016년 6월까지 300병상 이상
총 103개 병원에서 각 참여병원의 성인 중환자실
중 대표적인 내과와 외과 중환자실 또는 통합중
환자실을 대상으로 하여 총 178개 중환자실이 참
여하였다. 각 참여병원의 형태적 특성, 인력 구성
과 질적인 부분 등의 기초정보를 조사하였다. 연
구 기간 동안 각 참여 중환자실에서 요로감염,
혈류감염과 폐렴에 대한 의료관련감염 감시를
수행하였다. 중환자실 의료관련감염과 요로감염,
혈류감염, 폐렴의 정의는 미국 질병관리본부
(Center for Disease Control and Prevention, CDC)의
정의에 근거하였다[6]. 요로감염은 ‘증상이 있는
요로감염(symptomatic urinary tract infection,
SUTI)’과 ‘무증상 균혈증 요로감염(asymptomatic
bacteremic urinary tract infection, ABUTI)’을 포함하
였고 혈류감염은 ‘원인균 확인 혈류감염(laboratory-
confirmed bloodstream infection)’을 감시대상으로
하였다. 폐렴은 ‘임상적 폐렴(clinically defined pneu-
monia, PNEU1)’, ‘원인균 확인 폐렴(pneumonia with
specific laboratory findings, PNEU2)’과 ‘면역저하
자 폐렴(pneumonia in immunocompromised patients,
PNEU3)’으로 분류하였다[7]. 요로감염, 혈류감염
과 폐렴에서 각각 요로카테터, 중심정맥관 또는
인공호흡기와의 관련 여부를 구분하였다. 항생제
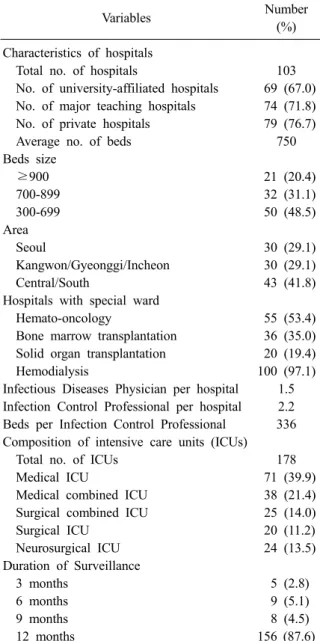
Table 1. Characteristics of hospitals and intensive care units participated in KONIS from July 2015 through June 2016
Variables Number
(%) Characteristics of hospitals
Total no. of hospitals 103
No. of university-affiliated hospitals 69 (67.0) No. of major teaching hospitals 74 (71.8) No. of private hospitals 79 (76.7)
Average no. of beds 750
Beds size
≥900 21 (20.4)
700-899 32 (31.1)
300-699 50 (48.5)
Area
Seoul 30 (29.1)
Kangwon/Gyeonggi/Incheon 30 (29.1)
Central/South 43 (41.8)
Hospitals with special ward
Hemato-oncology 55 (53.4)
Bone marrow transplantation 36 (35.0) Solid organ transplantation 20 (19.4)
Hemodialysis 100 (97.1)
Infectious Diseases Physician per hospital 1.5 Infection Control Professional per hospital 2.2 Beds per Infection Control Professional 336 Composition of intensive care units (ICUs)
Total no. of ICUs 178
Medical ICU 71 (39.9)
Medical combined ICU 38 (21.4)
Surgical combined ICU 25 (14.0)
Surgical ICU 20 (11.2)
Neurosurgical ICU 24 (13.5)
Duration of Surveillance
3 months 5 (2.8)
6 months 9 (5.1)
9 months 8 (4.5)
12 months 156 (87.6)
감수성 결과가 있는 주요 세균을 대상으로 항생 제에 대한 내성률을 조사하였고 중등도 내성은 내성에 포함시켜 분석하였다. KONIS 의료관련감 염감시가 기구일수 감염률에 미친 영향을 분석 하기 위해 2015년 7월-2016년 6월 기간의 기구일 수 감염률 자료를 2011년 7월-2015년 6월 사이 4 년간의 연간자료와 비교하였다[8-11]. 95% 신뢰 구간이 겹치지 않는 경우 유의한 차이가 있는 것 으로 판단하였다.
Results
1. KONIS 참여병원과 참여중환자실의 특성 2015년 7월부터 2016년 6월까지 KONIS 중환 자실 부문에 참여한 병원과 중환자실의 특성은 Table 1과 같다. 총 103개의 참여병원 중 대학병 원은 69개(67.0%)이었고 주교육병원은 74개(71.8%) 였다. 병상 규모별로는 300-699병상 병원이 50개 (48.5%), 700-899병상 병원이 32개(31.1%), 900병 상 이상 병원이 21개(20.4%)이었고, 평균 병상 수 는 750개였다. 전년도 96개 참여병원에서 중환자 실 7개 병원이 증가하였는데 300-699병상 규모에 서 7개 기관이 증가하였고, 700-899병상 규모에 서 1개 병원이 감소하고 900병상 이상에서 1개 병원이 증가하였다[11]. 지역별로는 서울에 위치 한 병원이 30개(29.1%), 강원/경기/인천 지역 병 원이 30개(29.1%), 중남부권역 지역의 참여병원 이 43개(41.8%)였다. 한 병원 당 감염관리전담인 력 2.2명이 근무하였고 이들은 1인당 평균 336병 상을 담당하고 있어 전년도 345병상에 비해 감소 하였다. 100병상당 감염관리전담인력 수는 0.30 명으로 2014년 0.29명, 2013년 0.25명과 비교할 때 증가 추세였다[10,11]. 총 178개의 참여중환자 실은 종류별로 내과 중환자실 71개(39.9%), 내과 계 통합 중환자실 38개(21.4%), 외과계 통합 중환 자실 25개(14.0%), 외과 중환자실 20개(11.2%), 신 경외과 중환자실 24개(13.5%)이었다. 참여중환자 실은 9개가 증가하였으며 내과계 통합 중환자실 7개, 내과 중환자실 3개, 외과계 통합 중환자실 2 개가 증가하고 외과 중환자실 2개, 신경외과 중 환자실 1개가 감소하였다. 12개월 동안 지속적으 로 감시를 수행한 중환자실은 156개(87.6%)로 전
년도 87% (147/169)와 유사하였다[11].
2. 의료관련감염 건수와 재원일수 감염률
연구 기간 동안 총 2,608건의 의료관련감염이
보고되었다. 이 중 요로감염이 718건(27.5%), 혈
류감염이 1,236건(47.4%), 폐렴이 654건(25.1%)이
었다. 요로감염 중에서 SUTI가 688건, ABUTI가
30건이었고, 폐렴 중에서는 PNEU1이 603건,
PNEU2가 49건, PNEU3가 2건이었다. 참여중환자
실의 총 재원일수는 945,605일이었다. 전체 의료
관련감염(요로감염, 혈류감염과 폐렴)의 1,000 재
Table 3. Pooled means and percentiles of the decive-associated infection rates, by number of hospital beds, July 2015 through June 2016
No. of hospital beds
No. of units
No. of infection
Device- days
Pooled
mean 95% CI 10‰ 25‰ 50‰ 75‰ 90‰
Urinary catheter-associated UTI rate*
≥900 41 161 193,617 0.83 0.71-0.97 0 0 0.47 1.29 3.11
700-899 62 269 315,290 0.85 0.76-0.96 0 0.24 0.51 1.10 1.89
300-699 75 272 286,559 0.95 0.84-1.07 0 0.35 0.77 1.24 1.77
All 178 702 795,466 0.88 0.82-0.95 0 0.20 0.67 1.20 1.92
Central line-associated BSI rate
†≥900 41 283 135,561 2.09 1.86-2.35 0 0.61 1.99 3.47 4.59
700-899 62 485 197,002 2.46 2.25-2.69 0.96 1.50 2.12 3.29 4.38
300-699 75 290 148,739 1.95 1.74-2.19 0 0 1.41 2.13 4.31
All 178 1,058 481,302 2.20 2.07-2.33 0 0.86 1.77 2.93 4.47
Ventilator-associated PNEU rate
‡≥900 41 92 106,020 0.87 0.71-1.06 0 0 0.58 1.87 3.23
700-899 62 194 157,543 1.23 1.07-1.42 0 0 0.74 2.08 3.79
300-699 75 103 124,845 0.83 0.68-1.00 0 0 0.71 1.16 2.19
All 178 389 388,408 1.00 0.91-1.11 0 0 0.69 1.58 2.80
*(No. of urinary catheter-associated UTIs/No. of urinary catheter-days)×1,000;
†(No. of central line-associated BSIs/No.
of central line-days)×1,000;
‡(No. of ventilator-associated PNEUs/No. of ventilator-days)×1,000.
Abbreviations: UTI, urinary tract infection; BSI, bloodstream infection; PNEU, pneumonia; CI, confidence interval.
Table 2. Pooled means of nosocomial infection rates, by number of hospital beds, July 2015 through June 2016
Nosocomial infection rate No. of hospital beds
≥900 700-899 300-699 All
No. of units 41 62 75 178
Patient-days 226,289 366,743 352,573 945,605
Infection rate*
No. of infections 607 1,178 823 2,608
Pooled mean 2.68 3.21 2.33 2.76
95% CI 2.48-2.90 3.03-3.40 2.18-2.50 2.65-2.87
UTI rate
†No. of UTI 163 274 281 718
Pooled mean 0.72 0.75 0.80 0.76
95% CI 0.62-0.84 0.66-0.84 0.71-0.90 0.71-0.82
BSI rate
‡No. of BSI 310 570 356 1,236
Pooled mean 1.37 1.55 1.01 1.31
95% CI 1.23-1.53 1.43-1.69 0.91-1.12 1.24-1.38
PNEU rate
§No. of PNEU 134 334 186 654
Pooled mean 0.59 0.91 0.53 0.69
95% CI 0.50-0.70 0.82-1.01 0.46-0.61 0.64-0.75
*(No. of UTIs, BSIs, or PNEUs/No. of patient-days)×1,000;
†(No. of UTIs/No. of patient-days)×1,000;
‡(No. of BSIs/
No. of patient-days)×1,000;
§(No. of PNEUs/No. of patient-days)×1,000.
Abbreviations: UTI, urinary tract infection; BSI, bloodstream infection; PNEU, pneumonia; CI, confidence interval.
원일수 당 감염률은 2.76건 (95% 신뢰구간[confi- dence interval, CI], 2.65-2.87)이었다. 1,000 재원일 수 당 의료관련 감염률은 요로감염 0.76건(95%
CI, 0.71-0.82), 혈류감염 1.31건(95% CI, 1.24-1.38),
폐렴 0.69건(95% CI, 0.64-0.75)이었다(Table 2).
Table 4. Pooled means and percentiles of the distribution of device-utilization ratios, by number of hospital beds, July 2015 through June 2016
No. of hospital beds
No. of units
Device- days
Patient- days
Pooled
mean 95% CI 10‰ 25‰ 50‰ 75‰ 90‰
Urinary catheter utilization ratio*
≥900 41 193,617 226,289 0.86 0.859-0.861 0.74 0.82 0.88 0.95 0.97
700-899 62 315,290 366,743 0.86 0.859-0.861 0.70 0.85 0.90 0.94 0.99
300-699 75 286,559 352,573 0.81 0.809-0.811 0.61 0.77 0.85 0.91 0.96
All 178 795,466 945,605 0.84 0.839-0.841 0.69 0.80 0.88 0.93 0.98
Central line utilization ratio
†≥900 41 135,561 226,289 0.60 0.598-0.602 0.42 0.46 0.59 0.72 0.88
700-899 62 197,002 366,743 0.54 0.538-0.542 0.34 0.44 0.53 0.68 0.77
300-699 75 148,739 352,573 0.42 0.418-0.422 0.22 0.32 0.43 0.54 0.61
All 178 481,302 945,605 0.51 0.509-0.511 0.29 0.41 0.50 0.62 0.77
Ventilator utilization ratio
‡≥900 41 106,020 226,289 0.47 0.468-0.472 0.23 0.29 0.46 0.62 0.78
700-899 62 157,543 366,743 0.43 0.428-0.432 0.26 0.34 0.41 0.49 0.61
300-699 75 124,845 352,573 0.35 0.348-0.352 0.14 0.25 0.36 0.42 0.55
All 178 388,408 945,605 0.41 0.409-0.411 0.22 0.29 0.39 0.50 0.62
*(No. of urinary catheter-days/No. of patient-days);
†(No. of central line-days/No. of patient-days);
‡(No. of ven- tilator-days/No. of patient-days).
Abbreviations: UTI, urinary tract infection; BSI, bloodstream infection; PNEU, pneumonia; CI, confidence interval.
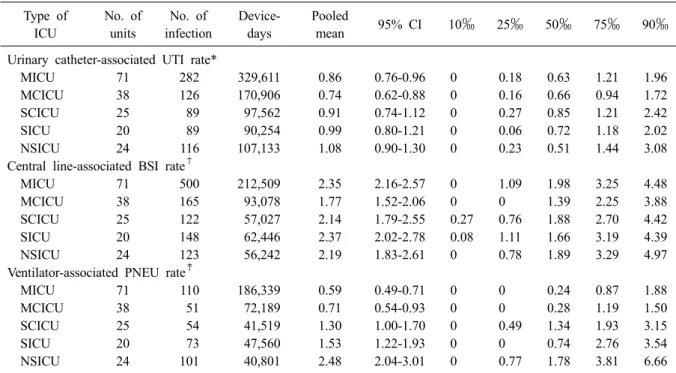
Table 5. Pooled means and percentiles of the distribution of device-associated infection rates, by type of ICU, July 2015 through June 2016
Type of ICU
No. of units
No. of infection
Device- days
Pooled
mean 95% CI 10‰ 25‰ 50‰ 75‰ 90‰
Urinary catheter-associated UTI rate*
MICU 71 282 329,611 0.86 0.76-0.96 0 0.18 0.63 1.21 1.96
MCICU 38 126 170,906 0.74 0.62-0.88 0 0.16 0.66 0.94 1.72
SCICU 25 89 97,562 0.91 0.74-1.12 0 0.27 0.85 1.21 2.42
SICU 20 89 90,254 0.99 0.80-1.21 0 0.06 0.72 1.18 2.02
NSICU 24 116 107,133 1.08 0.90-1.30 0 0.23 0.51 1.44 3.08
Central line-associated BSI rate
†MICU 71 500 212,509 2.35 2.16-2.57 0 1.09 1.98 3.25 4.48
MCICU 38 165 93,078 1.77 1.52-2.06 0 0 1.39 2.25 3.88
SCICU 25 122 57,027 2.14 1.79-2.55 0.27 0.76 1.88 2.70 4.42
SICU 20 148 62,446 2.37 2.02-2.78 0.08 1.11 1.66 3.19 4.39
NSICU 24 123 56,242 2.19 1.83-2.61 0 0.78 1.89 3.29 4.97
Ventilator-associated PNEU rate
‡MICU 71 110 186,339 0.59 0.49-0.71 0 0 0.24 0.87 1.88
MCICU 38 51 72,189 0.71 0.54-0.93 0 0 0.28 1.19 1.50
SCICU 25 54 41,519 1.30 1.00-1.70 0 0.49 1.34 1.93 3.15
SICU 20 73 47,560 1.53 1.22-1.93 0 0 0.74 2.76 3.54
NSICU 24 101 40,801 2.48 2.04-3.01 0 0.77 1.78 3.81 6.66
*(No. of urinary catheter-associated UTIs/No. of urinary catheter-days)×1,000;
†(No. of central line-associated BSIs/No.
of central line-days)×1,000;
‡(No. of ventilator-associated PNEUs/No. of ventilator-days)×1,000.
Abbreviations: ICU, intensive care unit; MICU, medical ICU; MCICU, medical combined ICU; SCICU, surgical com- bined ICU; SICU, surgical ICU; NSICU, neurosurgical ICU; UTI, urinary tract infection; BSI, bloodstream infection;
PNEU, pneumonia; CI, confidence interval.
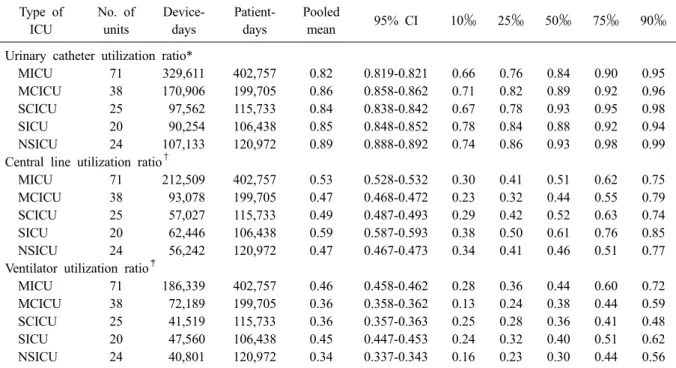
Table 6. Pooled means and percentiles of the distribution of device-utilization ratios, by type of ICU, July 2015 through June 2016
Type of ICU
No. of units
Device- days
Patient- days
Pooled
mean 95% CI 10‰ 25‰ 50‰ 75‰ 90‰
Urinary catheter utilization ratio*
MICU 71 329,611 402,757 0.82 0.819-0.821 0.66 0.76 0.84 0.90 0.95
MCICU 38 170,906 199,705 0.86 0.858-0.862 0.71 0.82 0.89 0.92 0.96
SCICU 25 97,562 115,733 0.84 0.838-0.842 0.67 0.78 0.93 0.95 0.98
SICU 20 90,254 106,438 0.85 0.848-0.852 0.78 0.84 0.88 0.92 0.94
NSICU 24 107,133 120,972 0.89 0.888-0.892 0.74 0.86 0.93 0.98 0.99
Central line utilization ratio
†MICU 71 212,509 402,757 0.53 0.528-0.532 0.30 0.41 0.51 0.62 0.75
MCICU 38 93,078 199,705 0.47 0.468-0.472 0.23 0.32 0.44 0.55 0.79
SCICU 25 57,027 115,733 0.49 0.487-0.493 0.29 0.42 0.52 0.63 0.74
SICU 20 62,446 106,438 0.59 0.587-0.593 0.38 0.50 0.61 0.76 0.85
NSICU 24 56,242 120,972 0.47 0.467-0.473 0.34 0.41 0.46 0.51 0.77
Ventilator utilization ratio
‡MICU 71 186,339 402,757 0.46 0.458-0.462 0.28 0.36 0.44 0.60 0.72
MCICU 38 72,189 199,705 0.36 0.358-0.362 0.13 0.24 0.38 0.44 0.59
SCICU 25 41,519 115,733 0.36 0.357-0.363 0.25 0.28 0.36 0.41 0.48
SICU 20 47,560 106,438 0.45 0.447-0.453 0.24 0.32 0.40 0.51 0.62
NSICU 24 40,801 120,972 0.34 0.337-0.343 0.16 0.23 0.30 0.44 0.56
*(No. of urinary catheter-days/No. of patient-days);
†(No. of central line-days/No. of patient-days);
‡(No. of ven- tilator-days/No. of patient-days).
Abbreviations: ICU, intensive care unit; MICU, medical ICU; MCICU, medical combined ICU; SCICU, surgical com- bined ICU; SICU, surgical ICU; NSICU, neurosurgical ICU; UTI, urinary tract infection; BSI, bloodstream infection;
PNEU, pneumonia; CI, confidence interval.
3. 기구일수 감염률과 기구사용률
요로감염 718건 중 702건(97.8%)이 요로카테터 와 관련이 있었다. 전체 요로카테터 기구일수는 795,466일이었고, 요로카테터 관련 요로감염(urinary catheter-associated UTI)은 1,000 기구일수 당 0.88 건(95% CI, 0.82-0.95)이었다(Table 3). 요로카테터 의 기구사용률은 0.84 (95% CI, 0.839-0.841)이었 다(Table 4). 혈류감염 1,236건 중 1,058건(85.6%) 이 중심정맥관과 관련된 것이었다. 전체 중심정 맥관 기구일수는 481,302일이었고, 중심정맥관 관 련 혈류감염(central line-associated BSI)은 1,000 기구일수 당 2.20건(95% CI, 2.07-2.33)이었다. 중 심정맥관의 기구사용률은 0.51 (95% CI, 0.509- 0.511)이었다. 폐렴 654건 중 389건(59.5%)이 인 공호흡기와 관련된 것이었다. 전체 인공호흡기 기구일수는 388,408일이었고, 1,000 기구일수 당 인공호흡기 관련 폐렴 건수는 1.00건(95% CI, 0.91-1.11)이었다. 인공호흡기의 기구사용률은 0.41
(95% CI, 0.409-0.411)이었다.
4. 병상규모에 따른 기구일수 감염률과 기구 사용률의 비교
요로카테터의 기구사용률은 병상규모가 300-699
병상인 병원에서 가장 낮았으나(0.81 [95% CI,
0.809-0.811]) (Table 4), 요로카테터관련 요로감염
의 기구일수 감염률은 700-899병상, 900 병상 이
상의 병원의 중환자실과 비교할 때 유의한 차이
가 없었다(Table 3). 중심정맥관 기구사용률은
300-699병상, 700-899병상, 900병상 이상인 병원
으로 갈수록 유의하게 높았고(0.42 [95% CI, 0.418-
0.422], 0.54 [95% CI, 0.538-0.542], 0.60 [95% CI,
0.598-0.602]) 중심정맥관 관련 혈류감염의 기구
일수 감염률도 700-899병상 규모의 병원에서 300-
699병원에 비해 유의하게 높았으나(2.46 [95% CI,
2.25-2.69] vs. 1.95 [95% CI, 1.74-2.19]) 900병상
이상 규모의 병원과는 유의한 차이가 없었다(2.46
[95% CI, 2.25-2.69] vs. 2.09 [95% CI, 1.86-2.35]).
인공호흡기 사용률 역시 병상규모가 커질수록 기 구사용률이 유의하게 높았다(0.35 [95% CI, 0.348- 0.352], 0.43 [95% CI, 0.428-0.432], 0.47 [95% CI, 0.468-0.472]). 그러나, 인공호흡기 관련 폐렴의 기구일수 감염률은 인공호흡기 사용률이 낮았던 700-899병상 규모의 병원이 900병상 이상인 병원 에 비해 유의하게 높았다(1.23 [95% CI, 1.07-1.42]
vs. 0.87 [95% CI, 0.71-1.06]).
5. 중환자실 유형에 따른 기구일수 감염률과 기구사용률의 비교
요로카테터 관련 요로감염은 신경외과 중환자 실에서 감염률이 가장 높았고(1.08 [95% CI, 0.90- 1.30]), 내과계 통합 중환자실에서 가장 낮았다 (0.74 [95% CI, 0.62-0.88]). 중심정맥관 관련 혈류 감염은 내과계 통합 중환자실에서 가장 낮았고 (1.77 [95% CI, 1.52-2.06]) 내과 중환자실은 내과 계 통합 중환자실과 비교할 때 유의하게 높은 감 염률을 보였다(2.35 [95% CI, 2.16-2.57]). 인공호 흡기 관련 폐렴은 신경외과 중환자실에서 다른 중환자실에 비해 감염률이 유의하게 가장 높았 고(2.48 [95% CI, 2.04-3.01]) 내과 중환자실에서 가장 낮았다(0.59 [95% CI, 0.49-0.71]) (Table 5).
요로카테터 사용률은 내과 중환자실에서 가장 낮았으며(0.82 [95% CI, 0.819-0.821]), 신경외과 중환자실에서 가장 높았다(0.89 [95% CI, 0.888- 0.892]). 중심정맥관 사용률은 신경외과 중환자실 과 내과계 통합 중환자실에서 가장 낮았으며 (0.47 [95% CI, 0.467-0.473], 0.47 [95% CI, 0.468- 0.472]), 외과 중환자실에서 가장 높았다(0.59 [95%
CI, 0.587-0.593]). 인공호흡기 사용률은 신경외과 중환자실에서 가장 낮았으며(0.34 [95% CI, 0.337- 0.343]), 내과 중환자실에서 가장 높았다(0.46 [95%
CI, 0.458-0.462]) (Table 6).
6. 원인미생물과 주요 미생물의 항생제 내성률 총 2,608건의 감염에서 2,602균주가 분리되었다.
그람음성막대균 1,119 (43.0%), 그람양성알균 1,002 (38.5%), 진균 459 (17.6%)의 순이었다. 요로감염에 서는 그람음성막대균이 45.4%로 가장 많았고, 혈류 감염은 그람양성알균이 49.2%로 가장 흔하게 분리 되었다. 폐렴에서는 그람음성막대균이 63.9%로 가
장 많았다. 중환자실 감염에 따른 원인미생물을 Table 7에 기술하였다. 혈류감염의 흔한 원인균은 Enterococcus faecium (14.7%, 189/1,288), Staphyl- ococcus aureus (14.2%, 183/1,288), Acinetobacter baumannii (12.6%, 162/1,288)이었다. 폐렴의 흔한 원인균은 A. baumannii (34.5%, 191/554), S. aureus (28.5%, 158/554)였다. 요로감염에서는 Escherichia coli (17.6%, 134/760)가 가장 흔하게 분리된 세균이 었다. 주요 세균의 주요 항생제에 대한 내성률은 Table 8에 기술하였다. Klebsiella pneumoniae의 imi- penem 내성률은 14.7%이었다.
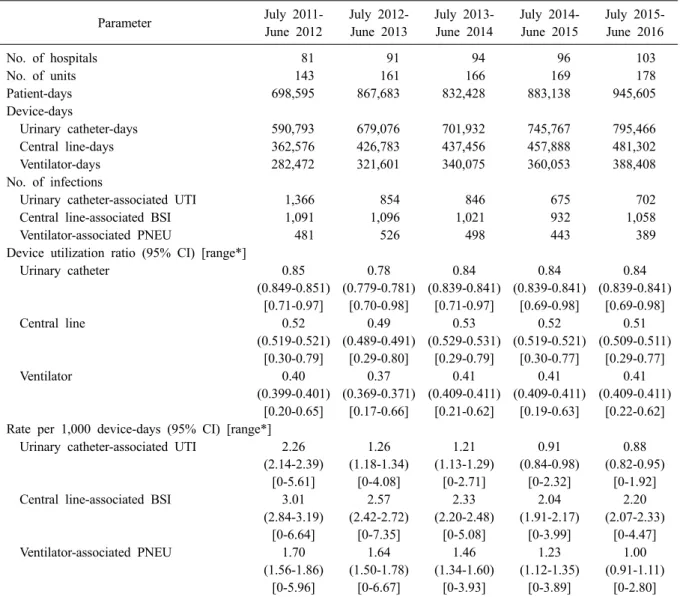
7. 2011-2016년도의 기구사용률과 기구일수 감 염률 비교
2015년 7월부터 2016년 6월까지의 기구사용률 과 기구일수 의료관련감염률을 이전 4년간의 KONIS 자료와 비교하였다(Table 9). 요로카테터 기구사용률과 요로카테터 관련 요로감염은 전년 도와 유의한 차이가 없었다[11]. 중심정맥관 관련 혈류감염은 유의한 차이는 아니었으나 중심정맥 관 기구사용률이 전년도에 비해 감소하였음에도 증가하는 경향이었다(2.04 [95% CI, 1.91-2.17] vs.
2.20 [95% CI, 2.07-2.33]). 인공호흡기 기구사용률 은 전년도와 비교할 때 차이가 없었으나 인공호 흡기 관련 폐렴은 유의하게 감소하였다(1.23 [95%
CI, 1.12-1.35] vs. 1.00 [95% CI, 0.91-1.11].
Discussion
KONIS 중환자실 부문은 2006년 7월부터 의료
관련감염 감시를 시작하여 2007년 7월부터 연간
자료를 발표하기 시작하였으며, 이번 결과보고는
아홉 번째 연간자료이다. KONIS에서는 각 병원
의 사정에 따라 참여 여부를 분기별로 선택하도
록 하고 있는데 2015년 3분기에는 95개 병원 166
개 중환자실, 4분기에는 97개 병원 167개 중환자
실, 2016년 1분기에는 98개 병원 169개 중환자실,
2분기에는 98개 병원 169개 중환자실이 참여하
였고 참여 병원과 중환자실은 분기별로 고르게
분포하였다. 특히 총 178개 중환자실 중에서
87.6%에 해당하는 156개 중환자실은 12개월 동
안 지속적으로 참여하여 감시를 수행하였다. 12
Table 7. Number (%) of microorganisms isolated from clinical specimens of patients with nosocomial infections
Organisms No. of isolates
SUTI ABUTI UTI BSI PNEU3 PNEU2 PNEU1 PNEU All
Gram-positive cocci (%) 176 (24.1) 8
(26.7) 184
(24.2) 634 (49.2) 1
(33.3) 19
(37.3) 164
(32.8) 184
(33.2) 1,002 (38.5)
Staphylococcus aureus
8 0 8 183 1 10 147 158 349Coagulase-negative staphylococci 20 2 22 154 0 2 0 2 178
Streptococcus pneumoniae
0 0 0 1 0 0 4 4 5Streptococcus species
9 0 9 5 0 4 10 14 28Enterococcus faecalis
70 2 72 94 0 1 0 1 167Enterococcus faecium
67 4 71 189 0 2 2 4 264Enterococcus species
2 0 2 5 0 0 1 1 8Others 0 0 0 3 0 0 0 0 3
Gram-positive bacilli (%) 6 (0.8) 0
(0) 6
(0.8) 10 (0.8) 0
(0) 0
(0) 1
(0.2) 1
(0.2) 17 (0.7)
Corynebacterium species
6 0 6 7 0 0 1 1 14Bacillus species
0 0 0 2 0 0 0 0 2Others 0 0 0 1 0 0 0 0 1
Gram-negative bacilli (%) 332 (45.5) 13
(43.3) 345
(45.4) 420 (32.6) 1
(33.3) 30
(58.8) 323
(64.6) 354
(63.9) 1,119 (43.0)
Haemophilus influenzae
0 0 0 0 0 0 1 1 1Escherichia coli
127 7 134 27 0 1 11 12 173Klebsiella pneumoniae
63 2 65 60 0 6 46 52 177Klebsiella oxytoca
4 0 4 3 0 0 1 1 8Enterobacter cloacae
5 0 5 14 0 1 11 12 31Enterobacter aerogenes
7 2 9 7 0 0 18 18 34Enterobacter species
1 0 1 1 0 0 0 0 2Serratia marcescens
1 0 1 14 0 1 2 3 18Proteus mirabilis
15 1 16 5 0 1 0 1 22Proteus vulgaris
1 0 1 1 0 0 1 1 3Proteus species
1 0 1 0 0 0 0 0 1Citrobacter freundii
3 0 3 2 0 0 2 2 7Citrobacter species
2 0 2 0 0 0 0 0 2Morganella morganii
5 0 5 1 0 0 2 2 8Providencia stuartii
0 0 0 0 0 0 1 1 1Pseudomonas aeruginosa
55 0 55 41 0 4 45 49 145Pseudomonas species
2 0 2 2 0 0 0 0 4Acinetobacter baumannii
34 0 34 162 1 16 174 191 387Acinetobacter species
2 0 2 12 0 0 1 1 15Burkholderia cepacia
1 0 1 12 0 0 0 0 13Stenotrophomonas maltophilia
2 0 2 28 0 0 6 6 36Sphingomonas paucimobilis
0 0 0 7 0 0 0 0 7Chryseobacterium meningosepticum
0 0 0 14 0 0 0 0 14Others 1 1 2 7 0 0 1 1 10
Anaerobes (%) 0
(0) 0
(0) 0
(0) 5
(0.4) 0
(0) 0
(0) 0
(0) 0
(0) 5
(0.2)
Actinomyces species
0 0 0 1 0 0 0 0 1Bacteroides species
0 0 0 3 0 0 0 0 3Prevotella species
0 0 0 1 0 0 0 0 1Fungi (%) 216
(29.6) 9
(30.0) 225
(29.6) 219 (17.0) 1
(33.3) 2
(3.9) 12
(2.4) 15
(2.7) 459 (17.6)
Candida albicans
94 2 96 84 0 2 8 10 190Candida tropicalis
53 5 58 45 1 0 0 1 104Candida glabrata
23 1 24 37 0 0 0 0 61Candida parapsilosis
7 1 8 32 0 0 0 0 40Candida species
20 0 20 12 0 0 1 1 33Trichosporon asahii
8 0 8 3 0 0 0 0 11Yeast 11 0 11 5 0 0 2 2 18
Aspergillus species
0 0 0 0 0 0 1 1 1Others 0 0 0 1 0 0 0 0 1
Total 730 30 760 1,288 3 51 500 554 2,602