Seiji Ohtori et al.
516 Asian Spine J 2016;10(3):516-521
Classification of Chronic Back Muscle Degeneration after Spinal Surgery and
Its Relationship with Low Back Pain
Seiji Ohtori, Sumihisa Orita, Kazuyo Yamauchi, Yawara Eguchi, Yasuchika Aoki, Junichi Nakamura, Tetsuhiro Ishikawa, Masayuki Miyagi, Hiroto Kamoda, Miyako Suzuki, Gou Kubota, Kazuhide Inage, Takeshi Sainoh, Jun Sato, Yasuhiro Shiga,
Koki Abe, Kazuki Fujimoto, Hirohito Kanamoto, Gen Inoue, Kazuhisa Takahashi
Department of Orthopaedic Surgery, Graduate School of Medicine, Chiba University, Chiba, Japan
Study Design: Retrospective case series.
Purpose: To classify back muscle degeneration using magnetic resonance imaging (MRI) and investigate its relationship with back pain after surgery.
Overview of Literature: Back muscle injury and degeneration often occurs after posterior lumbar surgery, and the degeneration may be a cause of back pain. However, the relationship between back muscle degeneration and back pain remains controversial.
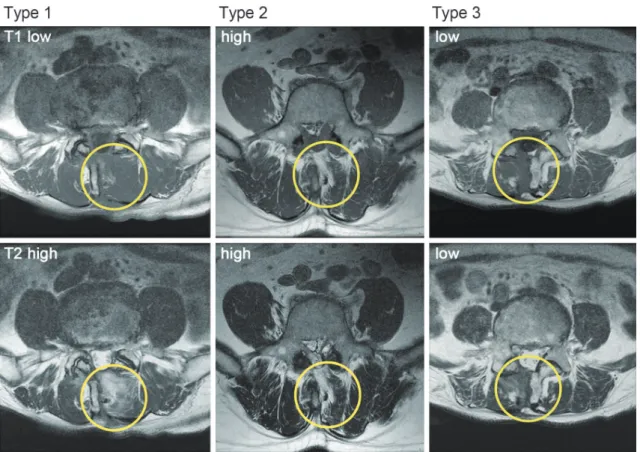
Methods: A total of 84 patients (average age, 65.1 years; 38 men, 46 women) with lumbar spinal stenosis underwent posterior de- compression surgery alone. MRI (1.5 tesla) was evaluated before and more than a year after surgery in all patients. Muscle on MRI was classified into three categories: low intensity in T1-weighted imaging, high intensity in T2-weighted imaging (type 1), high inten- sity in both T1- and T2-weighted images (type 2), and low intensity in both T1- and T2-weighted imaging (type 3). The prevalence of the types and their relationship with back pain (determined on a visual analog scale) were evaluated.
Results: MRI revealed muscle degeneration in all patients after surgery (type 1, 6%; type 2, 82%; and type 3, 12%). Type 2 was sig- nificantly more frequent compared with types 1 and 3 (p<0.01). Low back pain was significantly improved after surgery (p<0.01). Low back pain was not associated with any MRI type of muscle degeneration after surgery (p>0.05).
Conclusions: Various pathologies of back muscle degeneration after posterior lumbar surgery were revealed. Type 2 (fatty) change was most frequent, and other patients had type 3 (scar) or type 1 (inflammation or water-like) changes. According to the Modic clas- sification of bone marrow changes, Modic type 1 change is associated with inflammation and back pain. However, no particular type of back muscle degeneration was correlated with back pain after surgery.
Keywords: Lumbar; Muscle; Injury; Surgery; Pain
Copyright Ⓒ 2016 by Korean Society of Spine Surgery
This is an Open Access article distributed under the terms of the Creative Commons Attribution Non-Commercial License (http://creativecommons.org/licenses/by-nc/3.0/) which permits unrestricted non-commercial use, distribution, and reproduction in any medium, provided the original work is properly cited.
Asian Spine Journal • pISSN 1976-1902 eISSN 1976-7846 • www.asianspinejournal.org
Received Sep 26, 2015; Revised Oct 23, 2015; Accepted Oct 24, 2015 Corresponding author: Seiji Ohtori
Department of Orthopaedic Surgery, Graduate School of Medicine, Chiba University, 1-8-1 Inohana, Chuo-ku, Chiba 260-8670, Japan
Tel.: +81-43-226-2117, Fax: +81-43-226-2116, E-mail: [email protected]
ASJ A SJ
Clinical Study Asian Spine J 2016;10(3):516-521 • http://dx.doi.org/10.4184/asj.2016.10.3.516
Introduction
In Sweden, up to 25% of patients report unimproved or
worse pain and up to 40% are not happy with the outcome of lumbar fusion [1]. There are many possible reasons for poor results, including instrumentation failure,
inadequate surgical technique, and poor patient selection [2,3]. Other reported reasons for poor surgical results include presurgical pain/function, negative personality traits, emotional status, anxiety/depression, negative out- come expectations, negative coping, and duration of back pain, muscle injury, and workers’ compensation [2,3].
However, the relationship between back muscle injury after surgery and pain remains unclear.
Lumbar surgery induces histological change in muscle in humans. Kawaguchi et al. [4] reported the histologi- cal and histochemical changes in back muscle in patients who underwent surgery for lumbar spine disorders for the first time and in patients who underwent repeated poste- rior lumbar surgery. Histological damage to back muscle because of previous surgical intervention was long last- ing. Of 178 patients who had undergone laminectomies 2–5 years earlier, 14 patients had good recovery and 21 patients had poor recovery [5]. Back muscle biopsy was performed in patients with poor outcome. Local denerva- tion, atrophy of paraspinal muscles, and loss of muscular support leads to disability and increased biomechanical strain, and possibly failed back syndrome and pain [5].
The cross-sectional area (CSA) of the back muscula- ture has been measured before and after various types of posterior lumbar surgery in T2-weighted axial magnetic resonance imaging (MRI) using a computer-linked digi- tizer [6]. The extent of atrophy of the back musculature was determined on MRI after five types of posterior lum- bar surgery. However, the clinical outcomes showed no correlation with the extent of atrophy after each surgical procedure [7]. This finding suggested limited application of back muscle atrophy as an indicator of pain.
Back muscle injury and degeneration often occurs after posterior lumbar surgery, and back muscle degeneration may be a cause of back pain after surgery. However, the relationship between back muscle degeneration and back pain remains controversial. In the current study, we aimed to classify back muscle degeneration more precisely using MRI and investigate its relationship with back pain after surgery.
Materials and Methods
1. Patients
In our university hospital, we retrospectively evaluated 84 patients, 50–78 years old (mean±standard deviation:
65.1±7.8 years) who had low back pain and leg pain with lumbar spinal stenosis between January 2005 and April 2013. Patients had low back and leg pain that had per- sisted for at least 3 months. Patients were diagnosed with one or two levels of lumbar spinal stenosis on X-ray and MRI, myelography, and computed tomography after my- elography. Patients who had previously undergone spinal surgery were excluded. We also excluded those with spinal tumors, infections, or acute vertebral fractures of the tho- racic and lumbar spine. Informed consent was obtained from each patient. Details of the patients’ backgrounds are provided in Table 1.
All patients underwent decompression surgery at the level of the stenosis. One-level or two-level decompres- sion was performed. All patients underwent posterior decompressive surgery via a unilateral approach (left or right side). This approach allows surgeons to perform cen- tral and bilateral decompression while only stripping the muscles unilaterally [7].
2. Radiographic evaluation
MRI (1.5 tesla) was evaluated before and 12 months after surgery in all patients. CSA of the multifidus muscle on the approach side was measured using a computer-linked digitizer. In patients with one-level stenosis and decom- pression, we determined the CSA of the multifidus muscle at the level of the corresponding intervertebral disc. In Table 1. Demographic characteristics
Characteristic
No. of patients 84
Sex (male:female) 44:40
Age (yr) 65.1±7.8 (50–78)
Symptom duration (mo) 10.0 (4–24)
Follow-up after surgery (mo) 12
Diabetes mellitus 3
Smoker 4
Pain score before surgery Low back pain
Visual analogue scale 5.1±2.4
Oswestry disability index 40±14 Leg pain
Visual analogue scale 8.6±3.3
Values are presented as mean (range).
patients with two-level stenosis and decompression, we determined the CSA of the multifidus muscle at the center of the mid-vertebra. MRI 12 months after surgery was used to classify muscle degeneration into three types: low intensity in T1-weighted imaging, high intensity in T2- weighted imaging (type 1), high intensity in both T1- and T2-weighted imaging (type 2), and low intensity in both T1- and T2-weighted imaging (type 3). The site of evalu- ation was as mentioned above for the muscle CSA. Evalu- ation of muscle was performed by three surgeons blinded to the condition. Consensus of at least two of the observ- ers was used to determine the type of degeneration.
3. Clinical evaluation
We evaluated the change in low back and leg pain before and 12 months after surgery. To evaluate pain, a visual analogue scale (VAS) score (0, no pain; 10, worst pain) for low back pain and leg pain, and the Oswestry disability index (ODI) for low back pain were recorded before and 12 months after surgery and compared.
4. Statistical analyses
Kruskal-Wallis test was used to compare pain scale data between the three groups, a one-way analysis of varianc with post hoc comparisons was used for follow-up imag- ing data, and Fisher’s test was used for dichotomous or categorical variables. A p<0.05 was considered statistically significant.
Results
Table 1 shows demographic characteristics of the patients before surgery. Fig. 1 shows a representative MRI for each group. MRI revealed muscle degeneration in all patients after surgery (type 1, 6%; type 2, 82%; and type 3, 12%).
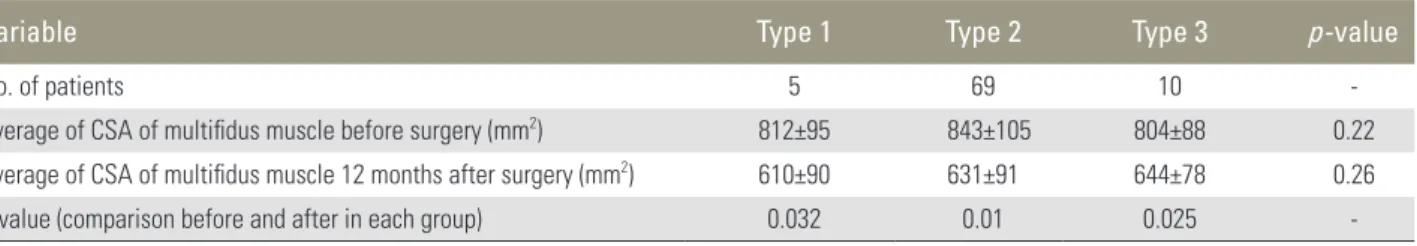
Type 2 was significantly more prevalent compared with types 1 and 3 (p<0.01).The average CSA of the multifidus muscle before surgery was not significantly different be- tween the three groups (p>0.05) (Table 2). The average CSA of the multifidus muscle 12 months after surgery was significantly decreased compared with before surgery in all patients (p<0.01) (Table 2). However, there was no
Fig. 1. Representative magnetic resonance imaging for each type of muscle degeneration.
significant difference in the average CSA of the multifidus muscle after surgery between the three groups (p>0.05) (Table 2).
Before surgery there was no significant difference in the low back pain score as evaluated by VAS or ODI, or leg pain score evaluated by VAS between the three groups (p>0.05) (Table 3). Low back pain evaluated by VAS and ODI, and leg pain evaluated by VAS significantly im- proved after surgery (p<0.01) (Table 3). Low back pain and leg pain were not significantly associated with any of the MRI types of muscle degeneration after surgery (p>0.05) (Table 3).
Discussion
The current study revealed various pathologies of back muscle degeneration after posterior lumbar surgery. Type 2 (fatty) change was most prevalent, and other patients were classified as having type 3 (scar) or type 1 (inflam- mation or water-like) changes. Low back pain was not
associated with any of the MRI types of muscle degenera- tion after surgery.
Posterior lumbar surgery is one of the main approaches to deal with lumbar spine disorders. Clinical investiga- tions have noted postoperative injury to and atrophy of the multifidus muscle [8,9] and the extent of atrophy has been significantly associated with postoperative low back pain and functional disability [9]. In the current study, all patients showed muscle degeneration 12 months after sur- gery. However, low back pain decreased after surgery. In cases of disc herniation or spinal stenosis, we believe that low back pain originates from several structures, includ- ing intervertebral discs and spinal nerve roots. Indeed, Toyone et al. [10] reported that in 40 consecutive patients with disc herniation treated by discectomy, all 40 patients were satisfied with the outcome, and suggested that nerve root compression by lumbar disc herniation might be a cause of low back pain. However, patients in the present study still showed slight low back pain 12 months after surgery, and this pain may have originated from degener- Table 2. Average of CSA of multifidus muscle before and 12 months after surgery
Variable Type 1 Type 2 Type 3 p-value
No. of patients 5 69 10 -
Average of CSA of multifidus muscle before surgery (mm2) 812±95 843±105 804±88 0.22
Average of CSA of multifidus muscle 12 months after surgery (mm2) 610±90 631±91 644±78 0.26
p-value (comparison before and after in each group) 0.032 0.01 0.025 -
CSA, cross-sectional area.
p<0.05 was considered statistically significant.
Table 3. Low back pain and leg pain before and 12 months after surgery
Variable Type 1 Type 2 Type 3 p-value
No. of patients 5 69 10 -
Low back pain (VAS) before surgery 5.5±1.5 6.0±2.3 5.7±2.0 0.16
Low back pain (VAS) 12 mo after surgery 1.8±0.8 2.0±0.5 2.2±0.7 0.23
p-value (comparison before and after in each group) 0.01 0.02 0.032 -
Low back pain (ODI) before surgery 44±12 38±10 42±12 0.22
Low back pain (ODI) 12 mo after surgery 24±8 20±8 26±6 0.10
p-value (comparison before and after in each group) 0.022 0.031 0.04 -
Leg pain (VAS) before surgery 8.5±2.3 9.1±3.3 8.2±3.8 0.09
Leg pain (VAS) 12 mo after surgery 2.0±0.6 1.9±0.7 1.7±0.8 0.20
p-value (comparison before and after in each group) 0.043 0.031 0.024 -
VAS, visual analogue scale; ODI, Oswestry disability index.
A p<0.05 was considered statistically significant.
ated back muscle. The relationship between the extent of back muscle atrophy and postoperative low back pain could not be concluded from the current study.
Presently, type 2 (fatty) muscle degeneration was most prevalent. After posterior surgery in sheep, the main path- ological changes noted in the multifidus were the atrophy of muscle bundles, increase in interstices, and decrease in size and number of nuclei [11]. Meanwhile, changes noted on MRI were a decrease in the CSA of the multifidus and infiltration by fibrotic and fatty tissues [11]. Patients with chronic low back pain have a higher percentage of muscle fatty infiltration compared with healthy controls [12]. However, no association between the fat content of the multifidus muscle and pain duration or intensity has been evident [13]. Furthermore, the extent of fatty change in the multifidus muscle is not significantly related with higher ratings of pain intensity [14]. In the current study, low back pain associated with fatty change (type 2) was not significantly different from pain associated with type 1 or 3 atrophy. This finding indicates a lack of association between the fat change in multifidus muscle and postsur- gical pain.
Some patients were classified as having type 1 (inflam- mation or water-like) or type 3 (scar) changes. To our knowledge, there has been no previous report of MRI evaluation of these muscle degeneration changes. Histo- logical findings including muscle degeneration, balloon- ing of muscle fibers, edema, atrophy, fatty change, and fibrosis and scarring in back muscle from patients who suffered from back pain have been reported [5]. In animal models of posterior lumbar spine surgery, the multifidus muscle has been evaluated histologically and by MRI after surgery [15]. Mainly fatty degeneration occurred. How- ever, necrosis and inflammation and fibrotic change often occur with fatty degeneration [15]. These changes corre- spond to type 1 and 3 changes seen in the current study.
We wondered whether there is an association between type 1 changes and back pain. We had previously con- ducted MRI studies of vertebral bone marrow changes in patients with degenerative lumbar disease [16]. Abnor- malities associated with decreased signal intensity on T1- weighted spin-echo images and increased signal intensity on T2-weighted spin-echo images (Modic type 1) cor- responding to the current type 1 change correlated with segmental hypermobility and low back pain [16]. We have also reported that Modic type 1 endplate abnormalities in discogenic pain patients are related to inflammation and
axonal growth into the abnormal bone marrow induced by cytokines such as tumor necrosis factor-alpha [17].
However, in the current study, low back pain associated with type 1 change was not significantly different from that associated with type 2 and 3 changes. Further study is needed to clarify the relationship between back pain and the type of muscle degeneration.
The current study has some limitations. First, it is a small-sized retrospective study and the number of pa- tients was limited. Second, we used 1.5 T MRI, which limited resolution. Third, the patient population only included those with lumbar spinal stenosis. As mentioned above, there is the possibility that back pain originated from spinal nerves, other structures, and other muscles, such as the longissimus and the iliocostalis. Fourth, we did not examinethe relationship of fatty infiltration to back muscle and back pain before and after surgery. Fatty infiltration to back muscle has been reported to be crucial factor to back pain [18]. Therefore we could not evaluate pain that was purely associated with postsurgical muscle degeneration.
Conclusions
Various pathologies of back muscle degeneration were evident after posterior lumbar surgery. Fatty change was most prevalent, and other patients had scarring or inflam- matory-like changes. However, no type of back muscle degeneration was correlated with back pain after surgery.
Conflict of Interest
No potential conflict of interest relevant to this article was reported.
References
1. Stromqvist B, Fritzell P, Hagg O, Jonss B. Swespine the Swedish Spine Register 2007 reports [Internet].
Falun (Sweden): Swedish Society of Spinal Surgeons;
2007 [cited 2008 Dec 20]. Available from: http://
www.4s.nu/pdf/Report_2007_englishversion.pdf.
2. Kooij A, Meulman JJ. Regression with optimal scal- ing. In: Meulman JJ, Heiser WJ, editors. SPSS catego- ries 13.0.10. Chicago: SPSS; 2004. pp.107–57.
3. Trief PM, Ploutz-Snyder R, Fredrickson BE. Emo- tional health predicts pain and function after fusion:
a prospective multicenter study. Spine (Phila Pa 1976) 2006;31:823-30.
4. Kawaguchi Y, Matsui H, Tsuji H. Back muscle injury after posterior lumbar spine surgery. Part 2: Histo- logic and histochemical analyses in humans. Spine (Phila Pa 1976) 1994;19:2598-602.
5. Sihvonen T, Herno A, Paljarvi L, Airaksinen O, Par- tanen J, Tapaninaho A. Local denervation atrophy of paraspinal muscles in postoperative failed back syn- drome. Spine (Phila Pa 1976) 1993;18:575-81.
6. Motosuneya T, Asazuma T, Tsuji T, Watanabe H, Nakayama Y, Nemoto K. Postoperative change of the cross-sectional area of back musculature after 5 sur- gical procedures as assessed by magnetic resonance imaging. J Spinal Disord Tech 2006;19:318-22.
7. Kinoshita T, Ohki I, Roth KR, Amano K, Moriya H.
Results of degenerative spondylolisthesis treated with posterior decompression alone via a new surgical ap- proach. J Neurosurg 2001;95(1 Suppl):11-6.
8. Tsutsumimoto T, Shimogata M, Ohta H, Misawa H. Mini-open versus conventional open posterior lumbar interbody fusion for the treatment of lumbar degenerative spondylolisthesis: comparison of para- spinal muscle damage and slip reduction. Spine (Phila Pa 1976) 2009;34:1923-8.
9. Fan S, Hu Z, Zhao F, Zhao X, Huang Y, Fang X. Mul- tifidus muscle changes and clinical effects of one- level posterior lumbar interbody fusion: minimally invasive procedure versus conventional open ap- proach. Eur Spine J 2010;19:316-24.
10. Toyone T, Tanaka T, Kato D, Kaneyama R. Low-back pain following surgery for lumbar disc herniation: a prospective study. J Bone Joint Surg Am 2004;86:893- 6.
11. Liu X, Wang Y, Wu X, et al. Impact of surgical ap- proaches on the lumbar multifidus muscle: an ex-
perimental study using sheep as models. J Neurosurg Spine 2010;12:570-6.
12. Kjaer P, Bendix T, Sorensen JS, Korsholm L, Leboeuf- Yde C. Are MRI-defined fat infiltrations in the mul- tifidus muscles associated with low back pain? BMC Med 2007;5:2.
13. Mengiardi B, Schmid MR, Boos N, et al. Fat content of lumbar paraspinal muscles in patients with chronic low back pain and in asymptomatic volunteers: quan- tification with MR spectroscopy. Radiology 2006;240:
786-92.
14. Kader DF, Wardlaw D, Smith FW. Correlation be- tween the MRI changes in the lumbar multifidus muscles and leg pain. Clin Radiol 2000;55:145-9.
15. Hu ZJ, Fang XQ, Zhou ZJ, Wang JY, Zhao FD, Fan SW. Effect and possible mechanism of muscle- splitting approach on multifidus muscle injury and atrophy after posterior lumbar spine surgery. J Bone Joint Surg Am 2013;95:e192.
16. Toyone T, Takahashi K, Kitahara H, Yamagata M, Murakami M, Moriya H. Vertebral bone-marrow changes in degenerative lumbar disc disease: an MRI study of 74 patients with low back pain. J Bone Joint Surg Br 1994;76:757-64.
17. Ohtori S, Inoue G, Ito T, et al. Tumor necrosis factor- immunoreactive cells and PGP 9.5-immunoreac- tive nerve fibers in vertebral endplates of patients with discogenic low back Pain and Modic Type 1 or Type 2 changes on MRI. Spine (Phila Pa 1976) 2006;
31:1026-31.
18. Hebert JJ, Kjaer P, Fritz JM, Walker BF. The relation- ship of lumbar multifidus muscle morphology to previous, current, and future low back pain: a 9-year population-based prospective cohort study. Spine (Phila Pa 1976) 2014;39:1417-25.