INTRODUCTION
Occupational exposure accounts for 17% of adult-onset asth- ma.
1Toluene diisocyanate (TDI) is a commonly used diisocy- anate and is known to be a cause of occupational asthma
Received: July 10, 2018 Revised: October 8, 2018Accepted: October 16, 2018
Corresponding author: Hae-Sim Park, MD, PhD, Department of Allergy and Clin-
ical Immunology, Ajou University School of Medicine, 164 Worldcup-ro, Young- tong-gu, Suwon 16499, Korea.
Tel: 82-31-219-5150, Fax: 82-31-219-5154, E-mail: [email protected]
•The authors have no financial conflicts of interest.
© Copyright: Yonsei University College of Medicine 2018
This is an Open Access article distributed under the terms of the Creative Com- mons Attribution Non-Commercial License (https://creativecommons.org/licenses/
by-nc/4.0) which permits unrestricted non-commercial use, distribution, and repro- duction in any medium, provided the original work is properly cited.
Serum Periostin Levels: A Potential Serologic Marker for Toluene Diisocyanate-Induced Occupational Asthma
Ji-Ho Lee
1, Sang-Ha Kim
1, Youngwoo Choi
2, Hoang Kim Tu Trinh
2, Eun-Mi Yang
2, Ga-Young Ban
3, Yoo Seob Shin
2, Young-Min Ye
2, Kenji Izuhara
4, and Hae-Sim Park
21
Department of Internal Medicine, Yonsei University Wonju College of Medicine, Wonju;
2
Department of Allergy and Clinical Immunology, Ajou University School of Medicine, Suwon;
3
Department of Pulmonary, Allergy and Critical Care Medicine, Kangdong Sacred Heart Hospital, Hallym University College of Medicine, Seoul, Korea;
4
Division of Medical Biochemistry, Department of Biomolecular Sciences, Saga Medical School, Saga, Japan.
Purpose: Toluene diisocyanate (TDI) is a leading cause of occupational asthma (OA). Periostin is a matricellular protein implicat- ed in type 2 immunity-driven asthma. Its pathogenic role in TDI-OA has not been completely elucidated. The present study was performed to investigate the role of periostin in TDI-OA.
Materials and Methods: Serum periostin levels were measured in subjects with TDI-OA, asymptomatic TDI-exposure controls (AECs), non-occupational asthmatics (NAs), and unexposed normal controls (NCs). To understand the mechanism by which TDI induces periostin production, primary small airway epithelial cells (SAECs) were cultured under stimulation of TDI and neu- trophils from asthmatic patients.
Results: Fifty-three subjects with TDI-OA, 71 AECs, 67 NAs, and 83 NCs were enrolled. Serum periostin levels were significantly higher in TDI-OA subjects than in AECs (p=0.001), NAs (p<0.001), and NCs (p<0.001). In TDI-exposed subjects (TDI-OA and AEC), the PC
20methacholine levels were significantly lower in subjects with a higher periostin level than in those with a lower periostin level. TDI exposure did not increase periostin production directly by SAECs; however, periostin production increased significantly after co-culture with TDI and neutrophils, which was suppressed by an antioxidant. In addition, increased release of TGF-β1 was noted from SAECs when exposed to TDI and neutrophils, which was also suppressed by an antioxidant.
Conclusion: These results suggest that an increased periostin level may contribute to the progression of airway inflammation to remodeling in TDI-exposed workers. A high serum periostin level is a potential serologic marker of the phenotype of TDI-OA.
Key Words: Diisocyanate, occupational asthma, periostin, neutrophils, reactive oxygen species
pISSN: 0513-5796 · eISSN: 1976-2437 Yonsei Med J 2018 Dec;59(10):1214-1221
https://doi.org/10.3349/ymj.2018.59.10.1214
(OA).
2Subjects with TDI-induced OA (TDI-OA) usually expe- rience progressive declines in lung function and sustained re- spiratory symptoms even in the absence of additional expo- sure.
3Exposure to TDI can occur in workplaces that produce flexible polyurethane foam and other products.
4Although the incidence of TDI-OA has been declining through protection and regulation policies, use of TDI has not decreased and many workers are still at high risk of TDI-OA.
5TDI has a low molecular weight and is a highly reactive chemical.
6Although many efforts to address the pathogenesis of TDI-OA have been made, its nature is heterogeneous in which various im- munologic and non-immunologic mechanisms are involved.
Periostin is a secreted, 90-kDa extracellular protein with a
structure homologous to adhesion molecule fasciclin I.
7It has
the ability to bind fibronectin, tenascin-c, and collagen and to
constitute subepithelial fibrosis with other extracellular ma- trix proteins.
8Periostin plays an important role in inflamma- tion as a matricellular protein.
9It has autocrine effects in bronchial epithelial cells and paracrine effects in airway fibro- blasts to activate transforming growth factor-β1 (TGF-β1) and type I collagen.
10Periostin has been implicated in various al- lergic diseases, such as asthma, chronic rhinosinusitis with nasal polyp, allergic conjunctivitis, and atopic dermatitis.
11,12However, the role of periostin in the pathogenesis of TDI-OA has not yet been completely elucidated.
As periostin may be involved in the pathogenic mecha- nisms of airway inflammation and remodeling in TDI-OA, this study was conducted to compare serum periostin levels among TDI-OA subjects, asymptomatic TDI-exposure con- trols (AECs), adult non-occupational asthmatics (NAs), and normal controls (NCs) not exposed to TDI and to investigate underlying mechanisms by which periostin is released from airway epithelial cells in TDI-exposed workers.
MATERIALS AND METHODS
Study population
Fifty-three subjects with TDI-OA, 71 AECs, 67 NAs, and 83 NCs were recruited in Ajou University Medical Center (Su- won, South Korea). TDI-OA was defined as the presence of a history of TDI exposure in the workplace and a positive re- sponse to TDI provocation test. AECs were subjects with a history of exposure to TDI in the workplace and no symptoms relating due to asthma. NAs were subjects diagnosed with as- pirin tolerant and non-severe asthma. NAs or NCs did not have a history of exposure to TDI. Blood samples were col- lected 1 week after discontinuation of all asthma medications, including inhaled/systemic corticosteroids and leukotriene receptor antagonists, and were stored at -20°C until used.
Blood sampling was performed at the initial visit of each pa- tient at which time most of the study subjects had been ex- posed to TDI. Atopic status was determined by results of skin prick test with common inhalant allergens (Bencard, Brad- ford, UK), wherein atopy was considered present if the test elicited positive reactions to at least one allergen. Total IgE was measured using the ImmunoCAP system (Thermo Fisher Scientific, Waltham, MA, USA). Informed consent was ob- tained from all patients. This study was approved by the Ethi- cal Review Board of Ajou University Hospital (AJIRB-GEN- SMP-13-108).
Provocation test with methacholine and TDI
Methacholine bronchial provocation test was conducted ac- cording to generally accepted guidelines.
13Doubled doses of methacholine (0.075 mg/mL to 25 mg/mL) were inhaled by the dosimeter method at 5 minute intervals until a fall in forced expiratory volume in 1 s (FEV
1) 20% or more. PC
20level,
a concentration of methacholine in which FEV
1decrease by 20%, was calculated by interpolation from the dose-response curve between methacholine and FEV
1. TDI provocation test was performed following a previously described method.
14Subjects were exposed to TDI (2,4 form:2,6 form=80:20; Sig- ma-Aldrich, St Louis, MO, USA) for 5 to 45 minutes through tidal breathing in a closed room until respiratory symptoms occurred. FEV
1was measured before and 5 hours after the TDI exposure. If a fall in FEV
1was 20% or more, the results of TDI provocation test was considered positive.
TDI-HSA conjugate
TDI-human serum albumin (TDI-HSA) conjugate was kindly provided by Dr. Justin M. Hettick (National Institute for Occu- pational Safety and Health, Morgantown, WV, USA), and 2,6- TDI was conjugated by HSA at different ratios and at a concen- tration of 0.5 mg/mL. Three different ratio (TDI:HSA), 40:1, 10:1 and 5:1, were provided. Conjugation between TDI and HSA, cross-linking, and reactivity were demonstrated.
15Among them, TDI-conjugated HSA at 40:1 was more reactive than the others in enzyme-linked immunosorbent assay (ELI- SA). Therefore, 40:1 TDI-HSA conjugate was used in this study.
Measurement of periostin and other cytokines
Periostin, interleukin-8 (IL-8), and TGF-β1 levels in serum sam- ples and cell culture supernatants were measured by commer- cial ELISA kits (Shino-Test Corporation, Tokyo, Japan; Endogen, Woburn, MA, USA; and R&D Systems, Minneapolis, MN, USA, respectively), following the manufacturers’ instructions. The se- rum levels of myeloperoxidase (MPO) and IL-1β in cell superna- tants were also measured by commercial ELISA kits (Biocheck Inc, Foster City, CA, USA and R&D Systems, respectively).
Measurement of intracellular reactive oxygen species 2’,7’-dichlorodihydrofluorescein diacetate (H2DCFDA) was purchased from Molecular Probes (Eugene, OR, USA) and was used as a fluorescent probe to detect the extent of reactive oxy- gen species (ROS) activation. Isolated neutrophils from asth- matic patients at a concentration of 1×10
5cells/mL were treat- ed with phosphate buffered saline (PBS), TDI-HSA conjugate, and TDI-HSA conjugate with N-Acetyl-L-cysteine (NAC) (Sig- ma-Aldrich) for 24 hours and incubated with 50 μM H2DCF- DA for 30 minutes at 37°C. They were analyzed using a FACS Canto II flow cytometer (BD Biosciences, San Jose, CA, USA).
Isolation of peripheral blood neutrophils
Venous blood was collected from adult asthmatics in BD Vacu-
tainer tubes containing acid citrate dextrose solution (BD Biosci-
ences) and was processed immediately after collection following
a previously described method.
16Blood was layered on Lympho-
prep solution (Axis-Shield, Oslo, Norway), which was then cen-
trifuged at 2000 rpm and 20°C for 25 minutes. The bottom red
layer was mixed with Hank’s balanced salt solution (HBSS) buf-
fer containing 2% dextran (Polysciences, Warrington, PA, USA) and was maintained for 30 minutes at room temperature. The upper layer containing neutrophils was collected, followed by centrifugation at 300 g and 20°C for 8 minutes with HBSS buffer.
The remaining red blood cells were removed by hypotonic lysis.
Isolated neutrophils were maintained in RPMI-1640 medium (Invitrogen, Carlsbad, CA, USA) supplemented with 2% fetal bo- vine serum (FBS). Cell purity was determined by hematoxylin and eosin staining or flow cytometry.
Human airway epithelial cell culture and treatment Three human airway epithelial cells (HAECs), including A549 cells, BEAS-2B cells, and primary small airway epithelial cells (SAECs), were purchased from American type Culture Collec- tion (ATCC, Manassas, VA, USA) and were cultured following previously reported methods.
17A549 and BEAS-2B cells were cultured in RPMI-1640 medium with 10% heat-inactivated FBS, penicillin (100 IU/mL), and streptomycin (50 μg/mL).
SAECs were cultured in Airway Epithelial Cell Basal Medium (ATCC), supplemented with HSA 500 mg/mL, linoleic acid 0.6 mM, lecithin 0.6 mg/mL, L-glutamine 6 mM, extract P 0.4%, epinephrine 1.0 mM, transferrin 5 mg/mL, triiodothyronine 10 nM, hydrocortisone 5 mg/mL, epidermal growth factors 5 ng/mL, and insulin 5 mg/mL. Cells were maintained at 37°C with 5% CO
2in humidified air.
HAECs (1×10
5cells/mL) were treated with 10 μL of 1 μg/mL TDI-HSA conjugate and/or 10 μL of 1 mM NAC for 24 hours.
Isolated neutrophils at 0.5×10
5cells/mL, an optimal count in previous experiments, were co-cultured with HAECs in trans- wells to interfere with direct contact between neutrophils and HAECs. Supernatants were collected and frozen at -80°C until ready for use.
Statistical analysis
Subject characteristics were analyzed using Student’s t test or the Mann-Whitney U test for continuous variables and the chi-square test or Fisher’s exact test for categorical variables.
Analyses among three or more groups were performed using
one-way ANOVA with Bonferroni post hoc test. Correlations between periostin and other cytokines were analyzed by ap- plying Spearman’s rank coefficient (r). Receiver operating curves (ROCs) were used to determine a cutoff value for se- rum periostin levels that differentiated TDI-OA and TDI-ex- posed subjects from healthy controls. Clinical and inflamma- tory parameters were compared by a generalized linear model between subjects with a higher periostin level and those with a lower periostin level. All statistical analyses were performed with SPSS version 23.0 (IBM Corp., Armonk, NY, USA). A p value of less than 0.05 was considered statistically significant.
RESULTS
Characteristics of the study subjects
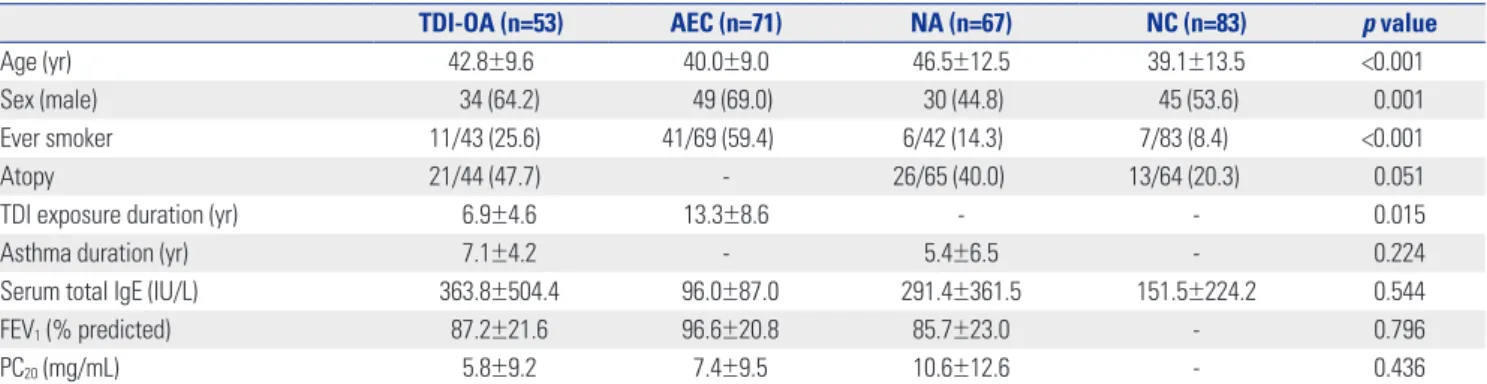
The mean ages of the subjects with TDI-OA, AECs, NAs, and NCs were 42.8±9.6, 40.0±9.0, 46.5±12.5, and 39.1±13.5 years, respectively (p<0.001) (Table 1). The proportions of males among subjects with TDI-OA, AECs, NAs, and NCs were 64.2, 69.0, 44.8, and 53.6%, respectively (p=0.001). The proportion of ever smokers among AECs (59.4%) was significantly higher than those among TDI-OA, NAs, and NCs (25.6, 14.3, and 8.4%, respectively, p<0.001). The duration of TDI exposure was sig- nificantly shorter in subjects with TDI-OA than in AECs (6.9±4.6 vs. 13.3±8.6 years, p=0.015). The serum total IgE levels, FEV
1(%), and PC
20levels were comparable among the groups.
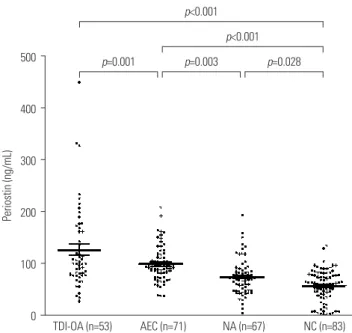
Elevated levels of serum periostin in TDI-OA
The mean serum periostin level was 127.6±79.5 ng/mL in sub- jects with TDI-OA, which was significantly higher than that in AECs, NAs, and NCs (100.9±33.5, 75.3±34.6, and 58.7±29.8 ng/
mL, respectively, all p<0.05) as shown in Fig. 1.
Comparison of clinical and immunologic parameters in subjects with TDI-OA plus AECs
Clinical and immunologic parameters in subjects with TDI-OA plus AECs were analyzed according to a cutoff periostin value
Table 1. Clinical Characteristics of the Study Subjects
TDI-OA (n=53) AEC (n=71) NA (n=67) NC (n=83) p value
Age (yr) 42.8±9.6 40.0±9.0 46.5±12.5 39.1±13.5 <0.001
Sex (male) 34 (64.2) 49 (69.0) 30 (44.8) 45 (53.6) 0.001
Ever smoker 11/43 (25.6) 41/69 (59.4) 6/42 (14.3) 7/83 (8.4) <0.001
Atopy 21/44 (47.7) - 26/65 (40.0) 13/64 (20.3) 0.051
TDI exposure duration (yr) 6.9±4.6 13.3±8.6 - - 0.015
Asthma duration (yr) 7.1±4.2 - 5.4±6.5 - 0.224
Serum total IgE (IU/L) 363.8±504.4 96.0±87.0 291.4±361.5 151.5±224.2 0.544
FEV
1(% predicted) 87.2±21.6 96.6±20.8 85.7±23.0 - 0.796
PC
20(mg/mL) 5.8±9.2 7.4±9.5 10.6±12.6 - 0.436
TDI, toluene diisocyanate;TDI-OA, TDI-induced occupational asthma; AEC, asymptomatic TDI-exposure control; NA, non-occupational asthma; NC, normal healthy control; FEV
1, forced expiratory volume in 1 s; PC
20, concentration of methacholine required to decrease a 20% in FEV
1.
Data are presented as the mean±SD or n (%).
of 116.7 ng/mL, which was calculated from the mean plus 2 standard deviations of the serum periostin level in NCs (Table 2). Subjects with a lower periostin level were predominantly male (75.9% vs. 45.9%, p=0.002) and ever smokers (55.6% vs.
22.6%, p=0.003), compared to those with a higher periostin lev- el. The PC
20methacholine levels were significantly lower in subjects with a higher periostin level than in those with a lower periostin level (1.9±2.5 mg/mL vs. 8.0±10.5 mg/mL, p=0.028).
The serum levels of IL-8, MPO, and TGF-β1 were not signifi- cantly different between the two groups. Serum periostin levels were examined for their correlations with IL-8, MPO, and TGF-β1 levels. No significant correlations were found between periostin and cytokines measured: IL-8 (r=0.135, p=0.122), MPO (r=-0.042, p=0.679), and TGF-β1 (r=-0.032, p=0.761).
The serum periostin level at which AECs and subjects with TDI-OA were differentiated from NCs was examined using ROC analysis. AECs and subjects with TDI-OA were well dis- criminated from NCs at a periostin level of 81.5 ng/mL with area under the curve (AUC) of 0.839, 74.2% sensitivity and 78.4% specificity (p<0.001) (Supplementary Fig. 1A, only on- line). Subjects with TDI-OA were discriminated from NCs at a cutoff periostin value of 89.5 ng/mL with AUC of 0.837, 64.2%
sensitivity and 87.5% specificity (p<0.001) (Supplementary Fig. 1B, only online). However, TDI-OA could not be discrimi- nated from AEC in ROC analysis with a serum periostin (AUC of 0.578, p=0.126).
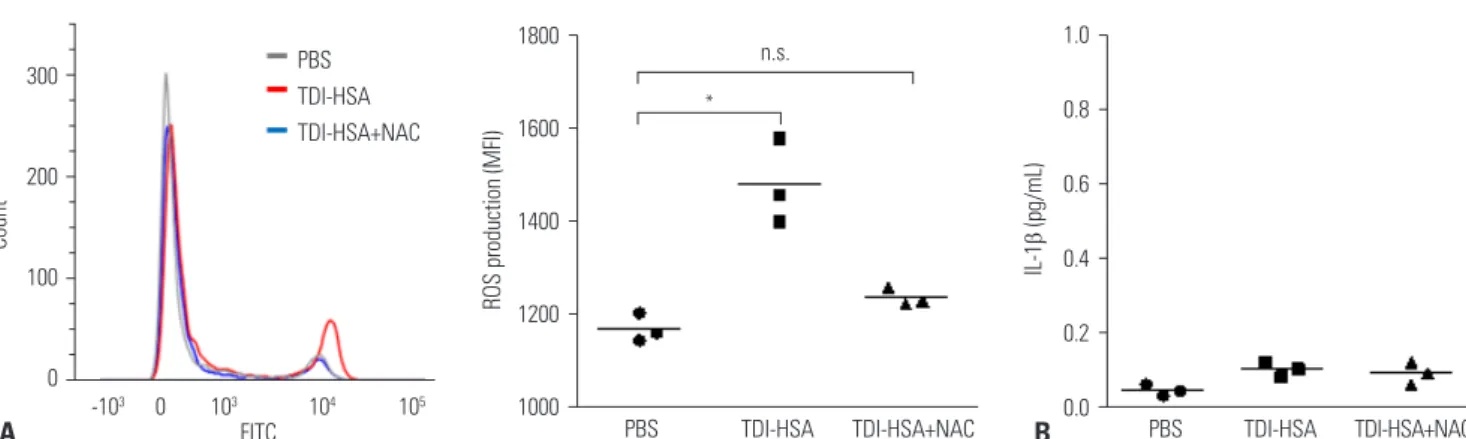
ROS production by neutrophils in response to TDI-HSA conjugate
In asthmatic patients, ROS production by neutrophils in re- sponse to TDI-HSA conjugate was measured by mean fluo- rescence intensity of fluorescent probe H2DCFDA using flow cytometry. ROS production by neutrophils was significantly increased after treatment with TDI-HSA conjugate, compared to treatment with PBS (Fig. 2A). However, NAC suppressed ROS production to a similar extent as that with PBS. No signif- icant effect of TDI-HSA conjugate on IL-1β production by neutrophils was noted (Fig. 2B).
Effect of TDI and neutrophils on immune response in HAECs
Three kinds of HAECs were co-cultured with TDI-HSA conju- gate. Their viability was evaluated by CCK8 assay. No signifi- cant change in viability was detected (Supplementary Fig. 2A, only online). In addition, the release of IL-8 and IL-6 from HAECs was not affected by treatment with TDI-HSA conju- gate (Supplementary Fig. 2B and C, only online).
IL-8 release was significantly increased after co-culture with neutrophils in BEAS-2B cells and SAECs in response to TDI- HSA conjugate (Fig. 3A). Periostin was not detected in cell su- pernatants from A549 and BEAS-2B cells regardless of neutro- phil co-culture and TDI-HSA treatment. In SAECs, periostin was released at a low level without any treatment. Although TDI-HSA conjugate alone did not increase periostin, periostin increased significantly when co-cultured with neutrophils, which was further increased by treatment with TDI-HSA conju- gate. NAC decreased periostin to a similar extent as that in neg- ative controls (Fig. 3B). In addition, co-culture with neutrophils significantly increased TGF-β1 from SAECs, which was further Table 2. Comparison of Clinical and Immunologic Parameters in Terms of Serum Periostin Level in TDI-Exposed Subjects
Serum periostin level
p value*
High (n=37) Low (n=87)
Age (yr) 41.9±8.9 40.9±9.5 0.594
Sex (male) 17 (45.9) 66 (75.9) 0.002
Ever smoker 7/31 (22.6) 45/81 (55.6) 0.003
Atopy 10/17 (58.8) 11/28 (39.3) 0.233
TDI exposure duration (yr) 6.1±5.0 10.1±7.1 0.100
Asthma duration (yr) 7.7±3.6 6.6±4.7 0.521
Serum total IgE (IU/mL) 359.6±405.4 251.6±458.1 0.356 FEV
1(% predicted) 87.1±18.5 89.1±23.1 0.782
PC
20(mg/mL) 1.9±2.5 8.0±10.5 0.028
IL-8 (pg/mL) 53.7±78.5 43.7±49.2 0.405
MPO (ng/mL) 169.7±130.3 162.0±179.5 0.540
TGF- β 1 (ng/mL) 44.3±16.4 48.6±46.6 0.956
TDI, toluene diisocyanate; FEV
1, forced expiratory volume in 1 s; PC
20, con- centration of methacholine required to decrease a 20% in FEV
1; MPO, myelo- peroxidase.
Data are presented as the mean±SD or n (%).
*p value was obtained with an adjustment for age, sex and smoking history.
Fig. 1. Comparison of serum periostin levels in the four study groups (subjects with TDI-OA, AEC, subjects with NA, and NCs). Periostin lev- els were measured using ELISA. Significantly increased serum perios- tin levels were noted in TDI-OA, compared to AEC, NA, and NC. TDI, tol- uene diisocyanate; TDI-OA, TDI-induced occupational asthma; AEC, asymptomatic TDI-exposure control; NA, non-occupational asthma;
NC, healthy normal control. Results are presented as means±SEM.
500
400
300
200
100
0 AEC (n=71)
p=0.001 p=0.003 p=0.028
p<0.001 p<0.001
TDI-OA (n=53) NA (n=67) NC (n=83)
Periostin (ng/mL)
increased by treatment with TDI-HSA. However, NAC remark- ably decreased TGF-β1 (Fig. 3C). In addition, within culture su- pernatants from SAECs, periostin levels were significantly cor- related with IL-8 levels (r=0.941, p<0.001) (Fig. 3D), and TGF-β1 levels were significantly correlated with periostin (r=0.830, p<0.001) (Fig. 3E) and IL-8 levels (r=0.829, p<0.001) (Fig. 3F).
DISCUSSION
In the present study, we found that serum periostin levels were significantly higher in TDI-OA than in AECs, NAs, and NCs.
PC
20methacholine levels were significantly lower in subjects
with a higher periostin level than in those with a lower perios- tin level. TDI exposure did not increase periostin production directly by airway epithelial cells. However, periostin produc- tion by airway epithelial cells increased significantly after co- culture with neutrophils, which were suppressed by an antiox- idant. In addition, TGF-β1 production by airway epithelial cells increased when exposed to TDI and neutrophils, which was also suppressed by an antioxidant. This is the first study to sug- gest that high periostin levels induced by airway epithelial cells may contribute to the progression of airway inflammation leading to airway remodeling in subjects with TDI-OA.
Serum periostin has been regarded as a biomarker for bron- chial asthma, especially in T-helper 2 (Th2)-driven asthma 1800
1600
1400
1200
1000 PBS TDI-HSA TDI-HSA+NAC
ROS production (MFI)
*
n.s.
TDI-HSA+NAC TDI-HSA
PBS 1.0
0.8
0.6
0.4
0.2
0.0
IL-1β (pg/mL)
Fig. 2. TDI-HSA conjugate-induced neutrophil activation according to ROS production. (A) Flow cytometry analysis of ROS production measured by the MFI of fluorescent probe H2DCFDA. (B) There was no significant effect of TDI-HSA conjugate on the production of IL-1 β by neutrophils. *p<0.01 obtained by one-way ANOVA with Bonferroni post hoc test. TDI, toluene diisocyanate; PBS, phosphate buffered saline; TDI-HSA, TDI-human serum albumin; NAC, N-Acetyl-L-cysteine; ROS, reactive oxygen species; MFI, mean fluorescence intensity; H2DCFDA, 2’,7’-dichlorodihydrofluorescein di- acetate; n.s., not significant.
A B
Fig. 3. Effects of TDI-HSA conjugate on the induction of immune responses by neutrophils in airway epithelial cells. Concentrations of (A) IL-8, (B) perios- tin, and (C) TGF- β 1 released from airway epithelial cells in the presence of neutrophils under trans-well. Correlation of periostin with (D) IL-8 and TGF- β 1, as well as with (E) periostin and (F) IL-8. * p<0.05,
†p<0.01,
‡p<0.001 obtained one-way ANOVA with Bonferroni post hoc test. TDI, toluene diisocyanate; TDI- HSA, TDI-human serum albumin; SAEC, small airway epithelial cell; NAC, N-Acetyl-L-cysteine; n.s., not significant; Neu, neutrophils.
A 8000 6000 4000 2000 0
IL-8 (pg/mL)
− + − + + − + − + + − + − + +
− − + + + − − + + + − − + + +
− − − − + − − − − + − − − − + TDI Neu NAC n.s.
n.s.
‡ ‡
n.s.
*‡ ‡
n.s.
*† ‡
A549
SAEC
BEAS-2B
B 10
8 6 4 2 0
Periostin (ng/mL)
− + − + + − + − + + − + − + +
− − + + + − − + + + − − + + +
− − − − + − − − − + − − − − + TDI Neu NAC A549
n.s.
†
‡ ‡
SAEC
BEAS-2B
C 60
40
20
0
TGF-β1 (pg/mL)
− + − + +
− − + + +
− − − − +
TDI Neu NAC n.s.
†
‡ ‡
10 8 6 4 2
0 2000 3000 4000 5000 6000 7000
Periostin (ng/mL)
55 50 45 40 35
30 2 4 6 8 10
TGF-β1 (pg/mL)
55 50 45 40 35
30 2000 3000 4000 5000 6000 7000
TGF-β1 (pg/mL)
r=0.941 p<0.001
r=0.830 p<0.001
r=0.829 p<0.001
IL-8 (pg/mL) E Periostin (ng/mL) F IL-8 (pg/mL)
D 300
200
100
0
Count