• 검색 결과가 없습니다.

Preliminary Results of Polarimetric Characteristics for C-band Quad-Polarization GB-SAR Images Using H/A/$\alpha$ Polarimetric Decomposition Theorem

N/A
N/A
Protected

Academic year: 2021

Share "Preliminary Results of Polarimetric Characteristics for C-band Quad-Polarization GB-SAR Images Using H/A/$\alpha$ Polarimetric Decomposition Theorem"

Copied!
16
0
0

로드 중.... (전체 텍스트 보기)

전체 글

(1)

1. Introduction

Ground-Based Synthetic Aperture Radar (GB- SAR) operates on similar imaging radar principle in microwave frequencies as airborne and spaceborne SAR systems. GB-SAR system has real time capability and flexibility for monitoring in emergency cases such as sudden landslide better than satellite SAR system. Many research papers have been presented using GB-SAR interferometry techniques.

These studies are concentrated to a monitoring of natural hazards, in particular, those phenomena producing ground displacements and the landslides (Tarchi et al., 2003a; Tarchi et al., 2003b; Leva et al., 2003; Luzi et al., 2004) or snow covered slope movement (Luzi et al., 2007; Luzi et al., 2009), and a terrain mapping (Pieraccini et al., 2001; Nico et al., 2004; Nico et al., 2005).

Tarchi et al. (2003a, 2003b) present an application result using a portable Linear SAR (LISA) system

Preliminary Results of Polarimetric Characteristics for C-band Quad-Polarization GB-SAR Images Using

H/A/a a Polarimetric Decomposition Theorem

Moon-Kyung Kang*, Kwang-Eun Kim*

, Hoonyol Lee**, Seong-Jun Cho*, and Jae-Hee Lee*

*Korea Institute of Geoscience and Mineral Resources

**Department of Geophysics, Kangwon National University

Abstract : The main objective of this study is to analyse the polarimetric characteristics of the various terrain targets by ground-based polarimetric SAR system and to confirm the compatible and effective polarimetric analysis method to reveal the polarization properties of different terrain targets by the GB-SAR.

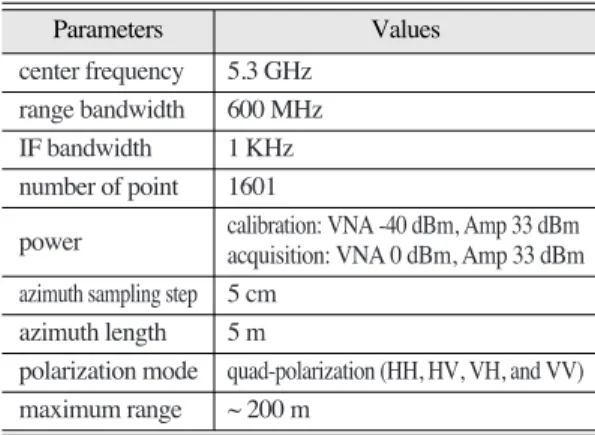
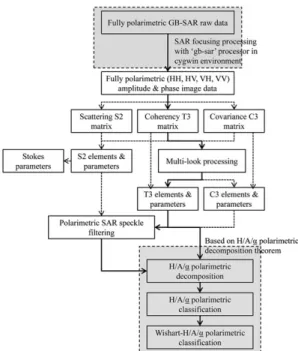
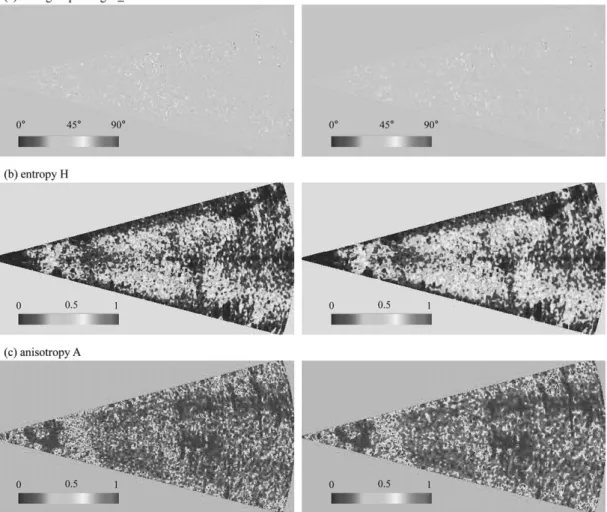
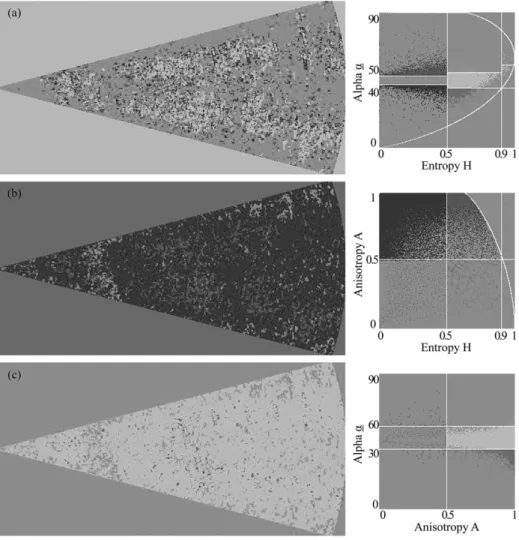
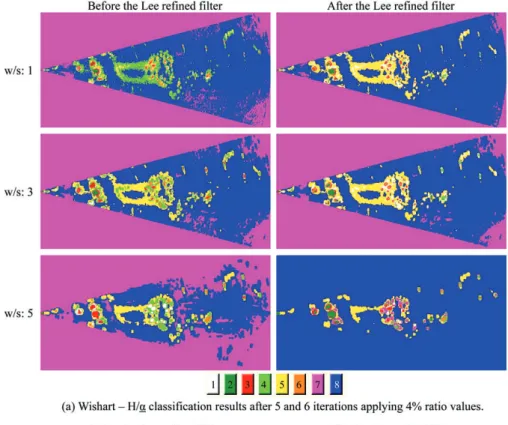
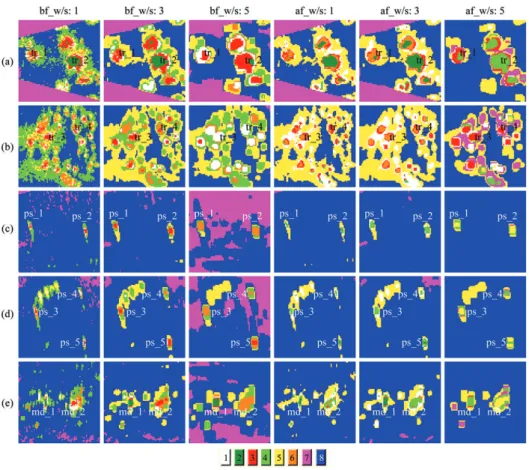
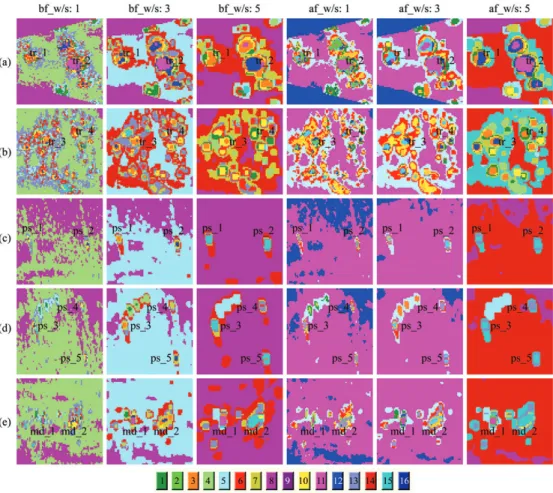
The fully polarimetric GB-SAR data with HH, HV, VH, and VV components were focused using the Deramp-FFT (DF) algorithm. The focused GB-SAR images were processed by the H/A/a polarimetric decomposition and the combined H/a or H/A/a and Wisahrt classification method. The segmented image and distribution graphs in H/a plane using Cloude and Pottier’s method showed a reliable result that this quad-polarization GB-SAR data could be useful to classified corresponding scattering mechanism. The H/a- Wishart and H/A/a-Wishart classification results showed that a natural media and an artificial target were discriminated by the combined classification, in particular, after applying multi-looking and the Lee refined speckle filter.

Key Words : GB-SAR, fully polarimetric SAR, H/A/a polarimetric decomposition.

Received December 18, 2009; Accepted December 24, 2009.

Corresponding Author: Kwang-Eun Kim ([email protected])

(2)

and a multi-temporal deformation maps produced by differential SAR interferometry at Tessina landslide and Ruinon landslide in Italy. Leva et al. (2003) demonstrate that the upper scarp, the debris flow, and the accumulation zone of the landslide have been estimated by the GB-SAR interferometer. Luzi et al.

(2007) report the results of an experiment to evaluate a potential of GB-SAR interferometry to estimate the velocity of an unstable area belonging to a glacier.

And Luzi et al. (2009) present the snow-depth variation measurement result using SAR interferometry and terrestrial laser scanning to evaluate snow mass characteristics. Pieraccini et al.

(2001) propose a GB-SAR interferometry technique for a terrain mapping instead of a conventional instrumentation like aerial surveys. Nico et al. (2004) introduce the problem of terrain mapping by a GB- SAR interferometer and Nico et al. (2005) describe a novel technique for the retrieval of a digital terrain model with a GB-SAR system.

Also GB-SAR systems have been utilized as a monitoring tool for a large artificial structure such as dams, bridges, buildings and so on. Tarchi et al.

(2000) described an application of SAR interferometry aimed to detect structural displacement of buildings. A ground-based SAR system for in field measurement has been able to measure the seasonal movement of a dam applying differential SAR interferometry methods (Tarchi et al., 1999). In addition, it can be used for monitoring for the archaeological investigation and mine detection (Milot and Berges, 1996; Cosgrove et al., 2004). The application researches using SAR polarimetry technique in GB-SAR have been presented to investigate vegetation targets. Zhou et al. (2004) described a broadband ground-based SAR system and its application results for vegetation monitoring.

And Hamasaki et al. (2005) discussed a polarimetric analysis results for a coniferous tree using a

polarmetirc and interferometric GB-SAR system.

To achieve physical or biophysical features information of various targets on the earth’s surface, we need to understand scattering characteristics received from different terrain targets. Many researchers have been interested in classification, decomposition, and modelling methods in recent literature to gain the reliable polarimetric information contained in a polarimetric SAR data. Classification of the different terrain types using a fully polarimetric SAR image is one of the important applications of SAR polarimetry technique that is concerned with control of the polarimetric properties of radar waves and the extraction of target properties from the behaviour of scattered waves from a target.

Cloude and Pottier (1997) proposed an entropy based method for extracting average parameters from a polarimetric SAR image using a smoothing algorithm based on second order statistics. Freeman and Durden (1998) proposed a model-fitting approach that based on three simple scattering mechanisms such as surface, double-bounce, and volume scatterings. Lee et al. (1999) described a combined unsupervised classification method which applied Cloude and Pottier’s decomposition scheme to initially classify a polarimetric SAR image and followed by iterated refinement using the complex Wishart classifier (Lee et al., 1994). Authors presented that the combined method has the advantage that is its effectiveness in automated classification, and in providing interpretation based on scattering mechanism for each class. This combined method could be ignored the physical scattering characteristics of each pixel. So Lee et al.

(2004) also proposed a new unsupervised terrain

classification algorithm preserving polarimetric

scattering characteristics that use a combination of a

scattering model-based decomposition developed by

Freeman and Durden and the complex Wishart

(3)

distribution algorithm.

The entropy (H), alpha ( a), and anisotropy (A) are the principal polarimetric scattering parameters in H/A/ a polarimetric decomposition theorem proposed by Cloude and Pottier. The polarimetric scattering alpha parameter is the main parameter for identifying a dominant scattering mechanism. The entropy H determines a degree of randomness of a scattering process, which can be also interpreted as a degree of statistical disorder. In the limit case, when H=1, the polarization information becomes zero and a target scattering is truly a random noise process and when H=0, the scattering process corresponds to a pure target. The polarimetric anisotropy that measures the relative importance of the second and the third eigenvalues of the decomposition is a parameter complementary to the entropy H.

In this paper, we focused on the analysis and classification of a fully polarimetric SAR image obtained by our GB-SAR system using the H/A/ a polarimetric decomposition theorem for SAR polarimetry applications. We described our recent efforts to extract the dominant scattering properties of various surface media using an unsupervised polarimetric classification method based on the H/A/ a polarimetric decomposition as a preliminary study. This polarimetric decomposition method was applied to classifying of different terrain targets such as trees, grass, a man-made structure, and a permanent scatterer in the study area.

2. Methodology

The Korea Institute of Geoscience and Mineral Resources (KIGAM) and Kangwon National University (KNU) GB-SAR team have been developed a fully polarimetric and interferometric GB-SAR system over the past several years. The

simplified schematic configuration of the GB-SAR system is shown in Fig. 1 (Lee et al., 2007a) and measurement specifications are listed in Table 1. The GB-SAR system consists of two instrument parts which are a radio frequency (RF) system part based on a Vector Network Analyzer (VNA) and a motion controlling part. The employed RF instrumentation composed of a VNA, a power amplifier, and a dual polarization square horn antenna. The network analyzer (Agilent 8362B) operated as a coherent microwave transmitter and receiver to measure the scattering information in the frequency domain from a low frequency 10 MHz to a high frequency up to 20 GHz.

The motion part is a linear horizontal rail 6 meter long where the antennas move for scanning the synthetic aperture ranged 5 meter with 5 ㎝ sampling

Table 1. GB-SAR system measurement characteristics

Parameters Values

center frequency 5.3 GHz range bandwidth 600 MHz IF bandwidth 1 KHz number of point 1601

power calibration: VNA -40 dBm, Amp 33 dBm acquisition: VNA 0 dBm, Amp 33 dBm azimuth sampling step 5 cm

azimuth length 5 m

polarization mode quad-polarization (HH, HV, VH, and VV) maximum range ~ 200 m

Parameters Values

Fig. 1. Configuration of the GB-SAR system (refer to Lee et

al., 2007a).

(4)

step length. And a notebook personal computer controls the VNA, the motion of the antennas, the data recording. The HH, HV, VH, and VV polarization components data can be acquired by a dual polarized square horn antenna that is both transmit and receive available. The advantages of this GB-SAR system are that its capability of measuring a fully polarimetric and interferometric SAR data and a multi-frequency data at C-band (5.3 GHz) and X- band (1 GHz) and its flexibility of a measurement for various natural and artificial targets. Compared to a conventional satellite SAR, the GB-SAR system can be used at any time and any place. This GB-SAR system was operated on several times for a performance assessment of the instruments.

The fully polarimetric SAR data used in this study was obtained at 160 times during 3 days between 3

rd

and 5

th

November, 2008. Incident angles span from 60˚ to 80˚. The outdoor test site was located inside KIGAM field as shown in Fig. 2. Five metallic trihedral corner reflector (side length: 50 cm) was used to obtain a high radar cross section (RCS) reference. Fig. 2 shows a photograph of the scene taken from the radar measurement position where located on 4

th

floor building height. There are a little rise heap area covered with trees and grass, around flat grass field, and several artificial targets such as

wooden geomagnetic observation boxes and metallic poles and panels in the test site.

Fig. 3 shows an overall flowchart for a polarimetric property analysis used in this study. Firstly we applied the ‘gbsar’ processor developed by Kangwon National University for a GB-SAR focusing processing. Lee et al. (2007a, 2007b) already described that the characteristics, advantages, and limitations according to different SAR focusing algorithm such as Deramp-FFT (DF) and Range- Doppler (RD) algorithm and compared to find an efficient SAR focusing method. In this work, the GB- SAR data were focused by DF algorithm and geocoded, and the GB-SAR images were processed for analyzing of polarimetric characteristics related to different terrain targets such as permanent scatterers, trees, grass, and several artificial structures. The amplitude and phase images after the SAR focusing that represented in dB and radian values respectively.

The GB-SAR image has 256×2048 pixels dimension.

After the SAR focusing processing, we used the

Fig. 2. A front view photo of the test site inside KIGAM. Fig. 3. Overall procedure for polarimetric SAR processing.

(5)

open software package, named ‘PolSARpro’ for a polarimetric analysis and classification of the fully polarimetric GB-SAR data. When the amplitude and phase images were inputted as an initial data in the

‘PolSARpro’ processing, the focused amplitude and phase data must be converted into modulus and degree values respectively. As shown in Fig. 3, we applied several processing cases to extract the information related to a polarimetric scattering property and to compare with the results from different processing cases for finding a compatible method to this GB-SAR image. In this paper we present the result processed through the solid line procedure in Fig. 3.

For a polarimetric interpretation, the each HH, HV, and VV polarimetric images were color coded using Pauli or Sinclair color-coding way, which its interpretation is very subjective. A polarimetric color- coded image could be provided indications on polarimetric properties of an observed scene and should be used to perform a polarimetric characterization. And a multi-looking and the Lee refined SAR speckle filtering (Lee et al., 1999) processing were applied for speckle reduction and data compression. The multi-look (1 row×4 columns) SAR data has a dimension of 256 ×512 pixels. And then the multi-looking image was processed by the H/A/ a polarimetric segmentation method and the unsupervised classification combined with H/A/a decomposition and the complex Wishart classifier algorithm before and after speckle filtering processing. In this combined classification case, the H/A/a polarimetric decomposition method to initially classify a polarimetric SAR image by the entropy H and averaged a angle. The medium’s scattering mechanisms characterized by H and a angle are used for classification. The classified results are then used as training sets for the next iteration using the Wishart classifier method.

3. Results

In general a polarimetric color-coded image is used two representations, called Pauli and Lexicographic (Sinclair) color-coding to represent some characteristics of polarimetric SAR data sets. The Pauli color-coding is based on a vector representation of linear combinations of scattering matrix elements.

The polarimetric channels HH+VV, HH-VV, and (HV+VH)/2 are then associated to the blue, red and green colors respectively. In the Sinclair color- coding, a symmetric scattering matrix can be represented under the form of a 3-element target vector whose elements are associated to the polarimetric channels HH, VV and HV. The HH, VV, and HV components can be coded onto the blue, red and green colors respectively in order to build an image whose color indicate their relative magnitude.

Fig. 4 shows a color-coded image corresponding to VV, HV and HH components as red, green, and blue colors respectively. As shown in Fig. 4, we can indicate that the dominant color over trees areas is white and green. White pixels correspond to equal amplitude over all polarimetric channels. And strong signal features appeared at 5 permanent scatterers location as white and pink-magenta color which indicate that HV magnitude is small compared to HH and VV channels. The relative magnitude of HH and VV is hard to appreciate, but it seems that the VV component magnitude is slightly more important than the HH component. Also strong backscattering property appeared at man-made targets such as several geomagnetic measurement boxes and metallic poles. The blue color area close by Ps_3 corner reflector was assumed wet grass area with water. The wet grass area was appeared bright only at a HH polarization amplitude image clearly as shown in Fig.

4(d). Over the grass area, the green color indicates a

dominant HV component, generally characteristics of

(6)

vegetated field.

One of the most important properties in radar polarimetry concerns the roll invariance. The main parameter of the H/A/a polarimetric decomposition for identifying the dominant scattering mechanism is an average alpha a angle, entropy H, and anisotropy A as being a roll-invariant parameter. The entropy and anisotropy are used to characterize media’s scattering heterogeneity, and alpha parameter is the measure of the type of scattering mechanisms from surface (a=0˚), to dipole (a=45˚), and to double bounce (a=90˚). The a parameter is related directly to underlying average physical scattering mechanism, and hence may be used to associate observables with physical properties of the medium. Fig. 5 shows these three roll invariant parameters, average alpha a angle, entropy H, and anisotropy A images that are applied with 3 window size in the decomposition processing

and ones before and after the Lee refined speckle filtering respectively. The alpha parameter images show that the grass and trees areas consisted of medium alpha parameter values (around 45˚) for dipole scattering. And the higher values (red to yellow color pixels) appeared at five corner reflectors which are expected a double bounce scattering characteristic.

The polarimetric scattering anisotropy parameter

can be employed as a source of discrimination only

when H > 0.7. The reason is that for lower entropy,

the second and third eigenvalues are highly affected

by noise. Consequently, the anisotropy is also very

noisy. So the polarimetric anisotropy A could be a

very useful parameter to improve the capability to

distinguish different types of scattering process, when

the polarimetric entropy H increases and has a high

value. The five corner reflectors locations and

Fig. 4. An example of three polarimetric component amplitude images in dB and the corresponding polarimetric color-coded image.

(7)

artificial targets areas where appeared low entropy show high anisotropy values in Fig. 5. A background area which has null value in amplitude and phase image was computed during the decomposition and classification processing. The null value of the background area may affect the classification processing.

Cloude and Pottier (1997) described the 2-D H/a plane where all random scattering mechanisms can be represented for an unsupervised classification scheme. The H and a plane in Fig. 6 is subdivided into nine zones that characterized different scattering behaviour in order to separate the SAR data into basic

Fig. 5. Roll-invariant parameters: The average alpha a angle, entropy H, and anisotropy A parameter images are applied with 3 window size during the decomposition processing and ones before (left) and after (right) the Lee refined speckle filtering.

Fig. 6. Two-dimensional H/a plane (refer to Lee and Pottier,

2009, p. 240).

(8)

scattering mechanisms. Fig. 7 shows the classification images and distribution results in H/ a, H/A, and A/a planes using the 3-D H/A/ a space based on Cloude and Pottier’s method. Fig. 8 and Fig. 9 show the H/ a polarimetric segmentation result and the distribution graph in H/a plane that were classified before and after the Lee refined speckle filter applying 1, 3, and 5 window sizes respectively. As shown in Fig. 8 and Fig. 9, the case one for increasing window size not too large and after a speckle filter that show more better results to discriminate between natural media area and artificial targets.

The H/ a polarimetric classification and distribution result in H/ a plane were separated a pixel element of the GB-SAR image into zone 8 and zone 5 dominantly. The zone 8 and 5 characterize low entropy dipole scattering and medium entropy vegetation scattering respectively. The trees and a part of grass area were classified zone 5 and the whole grass area was segmented on zone 8. Zone 5 would include scattering from vegetated surfaces with anisotropic scatterers and moderated correlation of scatterer orientations. An isolated dipole scatterer

Fig. 7. An example of the H/A/a polarimetric classification results in (a) H/a, (b) H/A, and (c) A/a plane using the Cloude and Pottier’s method applied with 3 window size before the Lee refined speckle filtering processing.

The left images are classification maps and the right distribution results are color coded for each zone.

(9)

would appear in the 8 zone, as would scattering from vegetation with strongly correlated orientation of anisotropic scattering elements. The zone 7 corresponds to low entropy double, or even, bounce scattering events, such as those provided by isolated dielectric and metallic dihedral scatterers. The five permanent scatterers appeared red color pixels in the H/a classification image distributed in zone 7. This segmentation of the H/a plane is offered merely to present a simple unsupervised classification way and to discriminate the geometrical segmentation of physical scattering processes.

The unsupervised classification method based on the H/a and H/A/a decomposition and the complex Wishart classifier algorithm were used to extract the classification information of different terrain types for the GB-SAR image. We examined the combined polarimetric classification increasing a number of iteration, from 1 to 20, and a ratio of pixels switching class between 1% and 20% respectively. Fig. 10 show an example of the unsupervised H/a-Wishart and H/A/a-Wishart classification results when 3 window sizes were applied to extract the main roll invariant H, A, and a parameters presented as shown Fig. 8. The H/A/a polarimetric classification results in H/a before the Lee refined speckle filtering processing. The

used window size is (a) 1, (b) 3, and (c) 5 respectively. The left images are classification maps and the right

distribution results are color coded for each zone.

(10)

in Fig. 5. The result of Fig. 10(a) is that a ratio of pixels switching class with respect to the total pixel number is 4% after 5 and 6 iterations before and after the Lee refined filter respectively. And Fig. 10(b) shows the H/A/a-Wishart classification result after 4 iterations applying 5% ratio value.

The corner reflectors and trees area were classified to different classes clearly after the Lee refined speckle filtering processing. The classification results after the Lee refined speckle filter show better result than ones before the speckle filtering as shown in Fig.

11 and Fig. 12. And the classification result whose

using 3 window sizes in the H/A/a decomposition processing show better than ones of 1 or 5 window sizes. The result using 1 or 5 window size during the decomposition processing that may not show a consistency classification result. In this case study, the effective and optimal procedure is that 1 row by 4 columns for multi-looking, ones after speckle filtering, using 3 window sizes in decomposition processing to extract H, A, and a parameters. The man-made targets such as 5 corner reflectors, wooden observation boxes, and metallic poles were separated clearly from a natural media of trees area in the Fig. 9. The H/A/a polarimetric classification results in H/a after the Lee refined speckle filtering processing. The

used window size is (a) 1, (b) 3, and (c) 5 respectively. The left images are classification maps and the right

distribution results are color coded for each zone.

(11)

Fig. 10. An example of the unsupervised Wishart-H/a and Wishart-H/A/a classification results applying 1,

3, and 5 window size (w/s) in the classification processing.

(12)

optimal case. But there is one problem in these classification results. A background area of the GB- SAR image were also accompanied with this classification processing in particular grass areas which have a low value in an amplitude image were classified same class with a background area.

Fig. 11 and Fig. 12 displays the enlarged images of the Fig. 10 at several example points that represent 5 corner reflectors, 2 man-made targets, and 4 trees positions. And the corresponding values were listed in Table 2. The HH, HV, VH, and VV values are extracted from an amplitude image and T11, T22, T33, and span values computed from T3 coherency matrix. The position for 5 permanent scatterers is

represented ps_1, ps_2, ps_3, ps_4, and ps_5. The md_1 and md_2 are the point for 2 artificial targets and tr_1, tr_2, tr_3, and tr_4 are related to a tree area.

We can see that the 5 permanent scatterers and 2 man-made targets were classified to same class 4 in Fig. 11. The tr_2 position classified in class 4 that may be a role like as a corner reflector and the other trees area divided to class 6. The HH value of 10 positions ranged from 4.1 dB to 26.1 dB and these values did not distinguished by a numerical difference according to natural or artificial media. For example, the ps_2 and tr_3 are similar in HH value but these areas are separated in a different class, class 4 and class 6. And the md_2 and tr_4 also are Fig. 11. The enlarged images of the Wishart-H/a classification result in Fig. 10(a). These images show the class

results at four trees (a, b), five permanent scatterers (c, d), and two artificial structure targets (e)

positions. The ‘bf’ and ‘af’ represent ones of before and after Lee refined filtering processing and these

are applied with 1, 3, and 5 window sizes (w/s) in the classification processing respectively. The

corresponding polarimetric component values of these pixel points are described in Table 2.

(13)

classified a different class even though they has a few numerical difference.

In the case of combined Cloude and Pottier’s

decomposition and complex Wishart classifier method, the final classification result can be different from initial classified result, and pixels of a different Fig. 12. The enlarged images of the Wishart-H/A/a classification result in Fig. 10(b). These images show the class

results at four trees (a, b), five permanent scatterers (c, d), and two artificial structure targets (e) positions.

The ‘bf’ and ‘af’ represent ones of before and after Lee refined filtering processing and these are applied with 1, 3, and 5 window sizes (w/s) in the classification processing respectively. The corresponding polarimetric component values of these pixel points are described in Table 2.

Table 2. The HH, HV, VH, and VV component of the polarimetric image and T11, T22, T33, and span values at 5 permanent scatterers, 2 artificial targets, and 4 trees positions

Value (dB) ps_1 ps_2 ps_3 ps_4 ps_5 md_1 md_2 tr_1 tr_2 tr_3 tr_4

HH 9.670 11.936 7.834 2.902 15.201 26.061 4.090 16.681 23.446 11.427 4.644 HV -20.418 -16.495 -11.788 -19.386 -12.957 -15.144 -12.335 7.674 -7.521 -2.212 -10.753 VH -21.840 -20.111 -14.021 -22.385 -17.274 -11.312 -15.288 5.486 1.691 -5.333 -12.309 VV 7.617 11.539 8.879 1.315 12.561 14.960 10.612 9.292 13.498 -0.242 6.175 T11 20.489 26.398 3.665 7.366 31.108 49.455 18.794 31.665 43.246 20.392 13.881 T22 8.682 10.274 19.742 -7.323 21.206 48.794 18.020 28.886 44.516 19.262 0.877 T33 -49.409 -45.728 -52.629 -55.716 -26.317 -28.579 -36.744 5.043 -0.364 -17.413 -26.680 span 20.766 26.503 19.848 7.511 31.531 52.147 21.435 33.511 46.937 22.874 14.194

Value (dB) ps_1 ps_2 ps_3 ps_4 ps_5 md_1 md_2 tr_1 tr_2 tr_3 tr_4

(14)

scattering mechanism could be mixed together. The Wishart iteration is based on the statistical characteristics of each pixel. Thus a physical scattering characteristic of each pixel are ignored for pixel reassignment during iterations. So we consider that a scattering model based unsupervised classification method proposed by Lee et al. (2004) in the future work. The classification method preserves the purity of dominant polarimetric scattering property of each pixel using a scattering model-based decomposition by Freeman and Durden (1998) combined with the complex Wisahrt distribution. The Freeman and Durden decomposition can be used to separate pixels into scattering categories such as surface, volume, and double bounce scattering. The three-component scattering mechanism model may prove useful in providing features for distinguishing between different surface cover types and in helping to determine the current state of surface cover.

4. Conclusions

The polarimetric characteristics of various terrain targets by ground-based polarimetric SAR system were analysed to confirm a compatible and effective polarimetric analysis method to reveal a polarization property of different terrain targets. In this study we applied the H/A/ a polarimetric classification and the unsupervised classification combined with the polarimetric Wishart classifier algorithm based on the H/A/a polarimetric decomposition theorem. The unsupervised Wishart-H/a and Wishat- H/A/a classification result and the corresponding value of HH, HV, VH, and VV polarimetric components were discussed. The classification result show that the unsupervised classification method can be an effective and useful method to discriminate between a natural and an artificial target even though they have

a few numerical differences in an amplitude value.

We expected that the developed GB-SAR system could be used as a convenient tool for the analysis of polarimetric properties for various terrain targets.

Acknowledgements

This research was supported by a grant (07KLSGC03) from Cutting-edge Urban Development - Korean Land Spatialization Research Project funded by Ministry of Land, transport and Maritime Affairs of Korean government.

References

Cloude, S. R. and E. Pottier, 1997. An Entropy Based Classification Scheme for Land Applications of Polarimetric SAR, IEEE Transactions on Geosciences and Remote Sensing, 35(1): 68- 78.

Cosgrove, R. B., P. Milanfar, and J. Kositsky, 2004.

Trained Detection of Buried Mines in SAR Images via the Deflection-Optimal Criterion, IEEE Transactions on Geoscience and Remote Sensing, 42(11): 2569-2575.

Freeman, A. and S. L. Durden, 1998. A Three- Component Scattering Model for Polarimetric SAR Data, IEEE Transactions on Geosciences and Remote Sensing, 36(3): 963-973.

Hamasaki, T., M. Sato, L. Ferro-Famil, and E.

Pottier, 2005. Natural Objects Monitoring Using Polarimetric Interferometric Ground- Based SAR (GB-SAR) System, International Geoscience and Remote Sensing Symposium 2005, IGARSS 2005 proceedings, 6: 4092- 4095, 25-29 July 2005.

Lee, H., S. -J. Cho, N. -H. Sung, and J. -H. Kim,

(15)

2007a. Development of a GB-SAR (I):

System Configuration and Interferometry, Korean Journal of Remote Sensing, 23(4):

237-245.

Lee, H., S. -J. Cho, N. -H. Sung, and J. -H. Kim, 2007b. Development of a GB-SAR (II):

Focusing Algorithms, Korean Journal of Remote Sensing, 23(4): 247-256.

Lee, J. -S. and E. Pottier, 2009. Polarimetric Radar Imaging from Basics to Applications, CRC Press, Boca Raton, FL, USA.

Lee, J. -S., M. R. Grunes, and G. De Grandi, 1999.

Polarmetric SAR Speckle Filtering and its Implication for Classification, IEEE Transactions on Geoscience and Remote Sensing, 37(5): 2363-2373.

Lee, J. -S., M. R. Grunes, and R. Kwok, 1994.

Classification of Multi-Look Polarimetric SAR Imagery Based on Complex Wishart Distribution, International Journal of Remote Sensing, 15(11): 2299-2311.

Lee, J. -S., M. R. Grunes, E. Pottier, and L. Ferro- Famil, 2004. Unsupervised Terrain Classification Preserving Polarimetric Scattering Characteristics, IEEE Transactions on Geoscience and Remote Sensing, 42(4):

722-731.

Lee, J. -S., M. R. Grunes, T. L. Ainsworth, L. -J. Du, D. L. Schuler, and S. R. Cloude, 1999.

Unsupervised Classification Using Polarimetric Decomposition and the Complex Wishart Classifier, IEEE Transactions on Geoscience and Remote Sensing, 37(5): 2249-2258.

Leva, D., G. Nico, D. Tarchi, J. Fortuny-Guaschi, and A. J. Sieber, 2003. Temporal Analysis of a Landslide by Means of a Ground-Based SAR Interferometer, IEEE Transactions on Geoscience and Remote Sensing, 41(4): 745- 752.

Luzi, G., L. Noferini, D. Mecatti, G. Macaluso, M.

Pieraccini, C. Atzeni, A. Schaffhauser, R.

Fromm, and T. Nagler, 2009. Using a Ground-Based SAR Interferometer and a Terrestrial Laser Scanner to Monitor a Snow- Covered Slope: Results From an Experimental Data Collection in Tyrol (Austria), IEEE Transactions on Geoscience and Remote Sensing, 47(2): 382-393.

Luzi, G., M. Pieraccini, D. Mecatti, L. Noferini, G.

Guidi, F. Moia, and C. Atzeni, 2004. Ground- Based Radar Interferometry for Landslides Monitoring: Atmospheric and Instrumental Decorrelation Sources on Experimental Data, IEEE Transactions on Geoscience and Remote Sensing, 42(11): 2454-2466.

Luzi, G., M. Pieraccini, D. Mecatti, L. Noferini, G.

Macaluso, A. Tamburini, and C. Atzeni, 2007. Monitoring of an Alpine Glacier by Means of Ground-Based SAR Interferometry, IEEE Geoscience and Remote Sensing Letters, 4(3): 495-499.

Millot, P. and A. Berges, 1996. Ground Based S.A.R.

Imaging Tool for the Design of Buried Mine Detectors, the Detection of Abandoned Land Mines: A Humanitarian Imperative Seeking a Technical Solution, EUREL International Conference on, 157-159, 7-9 October 1996, Edinburgh, UK.

Nico, G., D. Leva, G. Antonello, and D. Tarchi, 2004.

Gournd-Based SAR Interferometry for Terrain Mapping: Theory and Sensitivity Analysis, IEEE Transactions on Geoscience and Remote Sensing, 42(6): 1344-1350.

Nico, G., D. Leva, J. Fortuny-Guasch, G. Antonello,

and D. Tarchi, 2005. Generation of Digital

Terrain Models with a Ground-Based SAR

System, IEEE Transactions on Geoscience

and Remote Sensing, 43(1): 45-49.

(16)

Pieraccini, M., G. Luzi, and C. Atzeni, 2001. Terrain Mapping by Ground-Based Interferometric Radar, IEEE Transactions on Geoscience and Remote Sensing, 39(10): 2176-2181.

Tarchi, D., H. Rudolf, G. Luzi, L. Chiarantini, P.

Coppo, and A. J. Sieber, 1999. SAR Interferometry for Structural Changes Detection: a Demonstration Test on a Dam, International Geoscience and Remote Sensing Symposium 1999, IGARSS 1999 proceedings, 3: 1522-1524.

Tarchi, D., H. Rudolf, M. pieraccini, and C. Atzeni, 2000. Remote Monitoring of Buildings Using a Ground-Based SAR: Application to Cultural Heritage Survey, International Journal of Remote Sensing, 21(18): 3545- 3551.

Tarchi, D., N. Casagli, R. Fanti, D. Leva, G. Luzi, A.

Pasuto, M. Pieraccini, and S. Silvano, 2003a.

Landslide Monitoring by Using Ground- Based SAR Interferometry: an Example of Application to the Tessina Landslide in Italy, Engineering Geology, 68: 15-30.

Tarchi, D., N. Casagli, S. Moretti, D. Leva, and A. J.

Sieber, 2003b. Monitoring Landslide Displacement by Using Ground-Based Synthetic Aperture Radar Interferometry:

Application to the Ruinon Landslide in the Italian Alps, Journal of Geophysical Research, 108(B8): 2387, doi:10.1029/

2002JB002204.

Zhou, Z. -S., W. -M. Boerner, and M. Sato, 2004.

Development of a Ground-Based Polarimetric Broadband SAR System for Noninvasive Ground-Truth Validation in Vegetation Monitoring, IEEE Transactions on Geoscience and Remote Sensing, 42(9): 1803-1810.

PolSARpro software: http://envisat.esa.int/polsarpro/

수치

Fig. 1.  Configuration of the GB-SAR system (refer to Lee et al., 2007a).
Fig. 3 shows an overall flowchart for a polarimetric property analysis used in this study
Fig. 5.  Roll-invariant parameters: The average alpha a angle, entropy H, and anisotropy A parameter images are applied with 3 window size during the decomposition processing and ones before (left) and after (right) the Lee refined speckle filtering.
Fig. 7.  An example of the H/A/a polarimetric classification results in (a) H/a, (b) H/A, and (c) A/a plane using the Cloude and Pottier’s method applied with 3 window size before the Lee refined speckle filtering processing.
+4

참조

관련 문서

Since every classical or virtual knot is equivalent to the unknot via a sequence of the extended Reidmeister moves together with the forbidden moves, illustrated in Section 2,

with the experimental C versus t data. If the fit is unsatisfactory, another rate equation is guessed and tested. Integral method is especially useful for fitting simple

This book contains hundreds of complete, working examples illustrating many common Java programming tasks using the core, enterprise, and foun- dation classes APIs.. Java Examples

Development of Design Information Template for Nuclear Power Plants for Electromagnetic Pulse ( EMP ) Effect Analysis. Minyi Kim, Hosun Ryu, Songhae Ye, and

A) Clinical view of the recession defects B) Tunnel preparation with VISTA C) Deepithelialization using a high-speed handpiece at the hard palate. D)

Figure 2 FT-IR data of Polysiloxane-Based Hybrimer after(blue) and before(red) thermal curing.(A) Si-H group, (B) vinyl group.. Figure 3 (top) Transmittance

 store value (read from the Register File during decode) written to the Data Memory.  load value, read from the Data Memory, written to

 The disk arm starts at the first I/O request on the disk, and moves toward the last I/O request on the other end, servicing requests until it gets to the other extreme