443
"J. Korean Soc. Radiol., Vol. 8, No. 7, December 2014"
Soil Samples in
134Cs of the 604, 795 keV Spectrum Analysis
Eunsung Jang
Pusan National University Nuclear Physics and Radiation Technology Research Center
토양시료 속 134Cs의 604, 795 keV 에너지 스펙트럼 분석
장은성
부산대학교 핵과학연구소
Abstract
134Cs radioactive concentration among soil samples is difficult to classify due to the background impact on crust originated natural radioactive nuclide, and overlapping and interfering between peaks. The ways to identify true peaks in gamma-ray spectroscopy are as follows to reduce statistical fluctuation by smoothing based on the fact that the shapes of peak are mostly Gaussian, to inspect the levels of width and height of peaks, to add functions on low-energy trailing phenomena, or 4) to check the peaks after modifying Gaussian function itself. Therefore, it is considered that information and knowledge for spectrum analysis are necessary.
Key Words : Energy spectrum, Peak separate, Gamma-ray Spectrometry
요 약
토양 시료 중에 극미량의 134Cs 방사능 농도는 지각 기원자연방사성 핵종들에 의한 background의 영향 및 피크간 의 중첩 및 간섭으로 구분하기가 어렵다. 감마선 분광학에서 참 피크의 식별은 피크의 모양이 대체로 Gaussian임을 고려하여 smoothing에 의해 통계적 요동을 감소시켜 보거나 피크의 폭이나 솟아오름의 정도를 검사하거나, 저에너 지 tailing 현상에 대한 함수를 추가하거나 Gaussian 함수자체를 변형시켜 확인 할 수 있었다. 그러므로 스펙트럼 분 석에 대한 정보와 지식이 필요할 것으로 사료된다.
중심단어 : 에너지 스펙트럼, 피크분리, 감마선 분광분석.
Ⅰ. INTRODUCTION
세슘동위원소는 핵분열 생성 시, 그 생성비 및 방출 비가 다른 기타 인공핵종들에 비해 높아 환경방사선 감시에 주요한 목적핵종으로 여겨지고 있다. 토양시료 내에 수많은 자연방사성핵종(우라늄 계열, 토륨계열, 악티늄 계열, 우주선기원핵종, 지각기원핵종)들 때문에
혹시 존재할 수도 있는 극미량의 인공방사성핵종들은 검출 할 수 없다는 것이다. 환경방사능 시료에 대한 측정에서 background보다 방사능 농도가 충분히 높을 경우 문제가 없지만 background 농도와 유사한 중복되 는 구역이 발생하여 실제 스펙트럼을 구분하는데 어 려움이 발생한다. 즉, 토양 시료 중에 극미량의 134Cs 방사능 농도는 지각 기원자연방사성 핵종들에 의한 background의 영향 및 피크간의 중첩 및 간섭으로 구 http://dx.doi.org/10.7742/jksr.2014.8.7.443
Corresponding Author: Eunsung Jang E-mail:[email protected] Tel: +82-51-510-1789
양표준시료에서 9개의 피크 중에서 붕괴 율이 80% 이 상인 604, 795 keV에서 스펙트럼의 피크 탐색, 중첩 피 크의 분리, 분석에 필요한 피크 핏팅방법, 불필요한 피 크 제거에 관한 방법을 제시하고자 한다.
Ⅱ. MEASUREMENT METHOD
2.1. 에너지 및 효율 교정용 스펙트럼
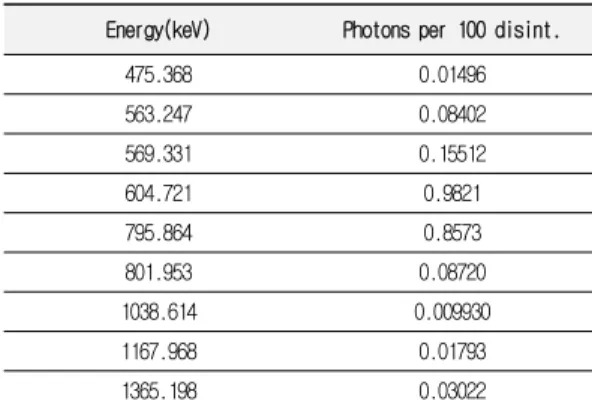
134Cs 표준토양 선원을 사용하여 스펙트럼의 분석을 위해 구체적으로 에너지, 분해능, 효율 등의 교정, 피 크 탐색 한계 설정, 중첩 피크 분리등 교정에 필요한 선원의 정보를 Table 1에 나타내었다. 스펙트럼에는 여 러 정보들이 있으며, 특히 스펙트럼에 나타나는 피크 들의 종류와 피크효율, 분해능, 피크의 모양 등이 있다
[1],[2].
Energy(keV) Photons per 100 disint.
475.368 0.01496
563.247 0.08402
569.331 0.15512
604.721 0.9821
795.864 0.8573
801.953 0.08720
1038.614 0.009930
1167.968 0.01793
1365.198 0.03022
Table 1. 134Cs Gamma Emissions.
2.2. 134Cs 에너지 스펙트럼 측정
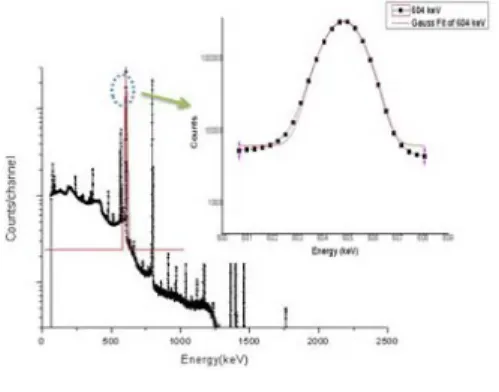
분석하고자 하는 에너지 스펙트럼 및 피크분리 위 해 전 에너지 피크들의 순 면적이 100,000 Counts 이상 이 되도록 측정하였다. Gamma Vision 5.0 프로그램으 로 분석하였다[3],[4]. 134Cs 토양표준시료의 전 에너지 스 펙트럼은 Fig. 1과 같다.
Fig. 1. 134Cs gamma spectrum full energy peak.
Fig1에서 보는 바와 같이 134Cs에서 방출되는 감마선 의 전 에너지 흡수 피크 외에도 Background 감마선인
40K로부터 방출되는 1460 keV, 208TI로부터 방출되는 2614 keV 감마선 피크들도 보인다. 134Cs에서 나타나는 피크들을 자세히 보기 위해 2부분으로 스펙트럼을 연 속으로 나열하였다(Fig. 2).
(a) 470 ~610 keV peak spectrum
(b) 600 ~810 keV peak spectrum
Fig. 2. The deterioration of a 134Cs gamma spectrum : (a),(b).
"J. Korean Soc. Radiol., Vol. 8, No. 7, December 2014"
2.3 피크 분리 및 피크모양
전 에너지 스펙트럼 피크는
에 비례하는 편차 를 갖는 가우스 함수에, 계단식 Background 위에 놓여 진 저 에너지 쪽에 작은 가우스 함수가 더해진 형태로나타난다[5]-[7]. 피크에서 피크의 좌, 우측의 Background
계수는 각각의 채널에 대해 선형적이기 때문에 2차 함 수로 fitting 하여 피크 끝단에서 얻어진 값들을 Background 기준 값으로 하였다(Fig.3).
Fig. 3. Energy Resolution.
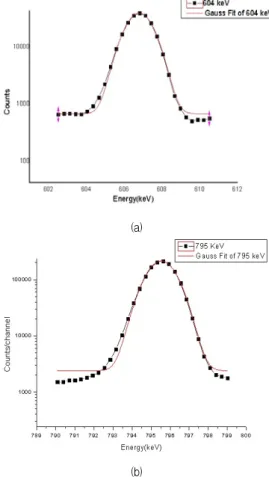
피크의 중심은 분리된 피크에서 채널들의 계수치를 증가한 평균값이며, 면적은 분리한 피크들의 총합이 다. 동일한 방법으로 주요 피크(604,795 keV)들도 분리 하였다(Fig. 4).
(a)
(b)
Fig. 4. 604, 795 keV energy Gaussian peak : (a), (b).
2.4 Background 피크 및 불필요한 피크 제거
Background 피크를 제거하기 위해서는 측정된 피크 에 대해 실제 피크와 거짓 피크의 판별 기준이 필요하
다[8]-[14]. 스펙트럼의 통계적 변동과 알려지지 않은 스
펙트럼을 제거하는 방식으로 fitting시 피크처럼 보이는 부분의 데이터는 제거한 후 fitting하였다.
Fig. 5. 134Cs gamma spectrum with 604 keV peak separate.
Ⅲ. RESULT
134Cs 스펙트럼의 전 에너지 피크는 일반적으로 가 우스 함수 형태를 띠고 있으며, 피크의 저 에너지 쪽 에 검출기의 불순물 준위에 의한 일부 전하의 포획으 로 작은 tail이 존재한다[16]. Fig. 1에서 2차함수로 Fitting 값을 Table 2 에 나타냈다.
Model Gauss
Equation
Value Standard
Error
Y0 2376.15877 68.97476
Xc 604.81906 0.00918
W 1.37279 0.01836
A 571250.18604 6619.04343
Sigma 0.68638
FWHM 1.61633
Height 332019.19796
Table 2. Comparision 134Cs full energy spectrum peak with separate 604 keV peak
791 ~ 800 keV까지 피크를 분리하여 계단형 Background와 가우스 함수 등으로 fitting 한 결과를 Fig.6에 보였다. 그림에서 이어진 선은 데이터를 2차 함수로 fitting한 추세선이며, 측정값이 2차함수에 잘 맞는다. 즉, 스펙트럼의 계수들은 가우스 형태로 분포 하고 있음을 알 수 있다. 측정된 계수에서 가우스 함 수와 Background 합과의 관계를 Fig6에 보였다. Fig6에 서 604, 795 keV 피크영역에서 피크를 주 Gaussian 함 수와 계단형 Background로 하였을 때 fitting값과 측정 치 사이의 차이를 나타낸다.
(a)
(b)
Fig. 6. 604, 795 keV energy peak separation with Background difference : (a),(b).
그 차이는 각 채널에서 측정된 피크와 계산된 피크 가 거의 일치함을 알 수 있다.또한 결과 값들은 표 에 나타내었다. 표에서 계수의 크기나 에너지 영역에 관
%에서 최대 1.2% 이내에서 일치하고 있음을 확인 할 수 있다(Table 3-4 ). 스펙트럼의 분포는 에너지와 상관 없이 가우스 함수 형태의 분포를 갖는다.
Model Gauss
Equation
Value Standard
Error
Y0 6218.76772 623.49242
Xc 604.81933 0.00335
W 1.34979 0.00761
A 557213.83813 3277.50473
Sigma 0.6749
FWHM 1.58926
Height 329377.98785 Table 3. 604 keV Input data Parameters
Model Gauss
Equation
Value Standard
Error
Y0 2398.42921 435.00833
Xc 795.53192 0.00432
W 1.49765 0.00968
A 398044.97192 2638.5878
Sigma 0.74882
FWHM 1.76335
Height 212061.7895 Table 4. 795 keV Input data Parameters
Fig. 7 (a)는 에너지가 604 keV 실제 스펙트럼에서 fitting한 값을 뺀 결과를 보여준다. 피크가 없는 부분에 서 Residual은 채널에서 계수의 통계적 변동 0.03- 0.05 이내에 있음을 알 수 있다.
"J. Korean Soc. Radiol., Vol. 8, No. 7, December 2014"
(a) 604 keV Residual vs. Independent Plot
(b) Residual vs. Independent Plot
Fig. 7. The 134Cs gamma spectrum with select features:
(a),(b) Measured spectrum peak and statistical variability difference (600∼800 keV).
Ⅳ. CONCLUSION
방사선 계측시스템은 자연방사선 환경 속에서 운용 되므로 필연적으로 background의 영향을 받는다. 그런 데 시료의 방사능이 극히 미미할 때는 그 탐색하고자 하는 피크와 background를 구분하기 어려워진다[15]. 그 러므로 감마선 분광학에서 참 피크의 식별은 피크의 모양이 대체로 Gaussian임을 고려하여 smoothing에 의 해 통계적 요둉을 감소시켜 보거나 피크의 폭이나 솟 아오름의 정도를 검사하거나, 저에너지 tailing 현상에 대한 함수를 추가하거나 Gaussian 함수자체를 변형시 켜 확인 할 수 있었다[16]. 또한 상용프로그램사용과 함 께 피크분석에 대한 지식이 필요할 것으로 사료된다.
Reference
[1] Moseong Lee, SangYeon Lee, Gyeongwon Suh, The study of
method of development for simulated HPGe spectrum peak the korean Association for Radiation Protection Conference.
[2] Gyeongwon Suh, Moseong LeeDevelopment of Spectrum for peak search condition setting Symposium of fall on Radiation Protection and Radioactive Waste, p 258 (2004)
[3] ORTEC. Gamma Vision 5.0 Operational Manual.
[4] EG&G ORTEC, 'Modular Pulse-Processing Electronics and Semicondutcor Radiation Detectors' , Oak Ridge, (1988).
[5] Development of Simulation Spectrum for program evaluation of the HPGe detector spectrum analysis, p52-53(2005).
[6] Jongwan Son, Myeongseok Shin, Hejeong Lee, Gyoens Jeong, Minsu Jeong, Sangnyeon Kim, A Development of GUI Full-Energy Absorption Peak Analysis Program forEducational Purpose,2009
[7] Gilmore G and Hemingway JD. Practical Gamma-Ray Spectrometry. John Wiley & Sons 1955:167
[8] Robison DC. A computer program for the determination of accurate gamma-ray line intensities fromgermanium spectra.
Nucl. Instr. and Meth. 1970;78:120-124.
[9] Phillips QW and Marlow KW. Automatic analysisi of gamma-ray spectra from germanium detectors. Nucl.Inst. and Meth.1976;137:525-536.
[10] Routti JT and Prussin SG. Photopeak method for the computer analysis of gamma-ray spectra ftom semiconductor detectors.
Nucl. Inst. and Meth.1969;72:125-142.
[11] Dojo M. A shape function of photopeaks for gamma-ray spectrum analysis with Ge(Li) detectors. Nucl. Instr. and Meth.
1974;115:425-429.
[12] Glenn F. Knoll, Radiation Detection and Measurement. John Wiley & Sons, Inc., USA, 3rd Edition, 2000.
[13] Knolls Atomic Power Laboratory, Nuclides and Isotopes: Chart of the Nuclides. Lockheed Martin, USA< 16th Edition, 2002.
[14] P.W. Nicholson, Nuclear Electronics ( John Wiley & Sons, Inc., New York, 1974). This book is an extensive treatise on the electronics associated with high-resolution detectors. Detailed descriptions are given of detector preamplifiers, puls shaping, rate-related losses, pulse-height analysis and spectral resolution.
[15] H. L Beck, W. J. Cobdon and W. M. Lowder, "Spectrometric techniques for measuring environmental gamma radiation, HASL-150 (1964).
[16] Eunsung Jang. Limits to measurement 134Cs in soil samples,(2014).