•접수 : 2019년 3월 23일 •수정접수 : 2019년 4월 16일 •채택 : 2019년 4월 24일
✽
교신저자 : Seong-Hun Choi, Department of Histology and Anatomy, College of Korean Medicine, Daegu Haany University, 1, Hannydaero, Gyeongsan, Gyeongsangbuk-Do, 38610, Republic of Korea.
전화 : +82-53-819-1872, 팩스 : +82-53-819-1576, 전자우편 : [email protected]
Young-Joon Lee, Department of Preventive Medicine, College of Korean Medicine, Daegu Haany University, 1, Hannydaero, Gyeongsan, Gyeongsangbuk-Do, 38610, Republic of Korea.
전화 : +82-53-819-1296, 팩스 : +82-53-819-1576, 전자우편 :
# These authors contributed equally to this work.
This work was supported by the National Research Foundation of Korea(NRF) and by the Korea of Health & Welfare, Republic of Korea.
Effects of the mixed formulation of sorafenib and blue honeysuckle on the pharmacokinetics profiles of sorafenib
Hyun-Gu Kang
1)†, Su-Jin Kang
1),3)†, Sae-Kwang Ku
1),3), Seong-Hun Choi
1)*, Young-Joon Lee
2)*1)Department of Anatomy and Histology, College of Korean Medicine, Daegu Haany University, Gyeongsan 38610, Republic of Korea
2)Department of Preventive Medicine, College of Korean Medicine, Daegu Haany University, Gyeongsan 38610, Republic of Korea
3)The Medical Research center for Herbal Convergence on Liver Disease, Daegu Haany University, Gyeongsan 38610, Republic of Korea.
Abstract
Objective : This study investigated the effects of concentrated and lyophilized blue honeysuckle powders (BH) on the pharmacokinetics (PK) of sorafenib were observed.
Method : The blood was collected at 0.5 hr before single oral treatment of sorafenib (40 mg/kg) or sorafenib with BH (400, 200 and 100 mg/kg) mixed formulas administration, and 0.5, 1, 2, 3, 4, 6, 8 and 24 hrs after the end of single or mixed formula administration. Plasma concentrations of sorafenib were analyzed using LC-MS/MS methods. Tmax, Cmax, AUC, t1/2 and MRT
inf of sorafenib were analysis as compared with sorafenib single treatment.
Results : Single oral administration of mixed formulas induced significant increases of plasma sorafenib concentrations from 0.5 hr after end of administration throughout all blood collected time points, as compared with sorafenib single formula treated rats, and significant decreases of sorafenib Tmax with increases of Cmax, AUC0-t and AUC
0-inf were detected in sorafenib and BH 400 mg/kg mixed formulation treated rats as compared with sorafenib single formula treated rats, respectively. Inaddition, sorafenib and BH 200 or 100 mg/kg mixed formula treated rats also showed significant increases of sorafenib Cmax, AUC
0-t and AUC
0-inf, respectively.
Conclusions : According to these results, mixed formulation of BH with sorafenib increased the bio- availability of sorafenib through the increment of the absorptions.
Key words : Blue honeysuckle, Hepatic cancer, Pharmacokinetics, Drug-drug interactions, Rat,
Sorafenib.
I. Introduction
Sorafenib (Nexavar
TM)is a kinase inhibitor drug approved for thetreatment of primary kidney cancer(advanced renal cell carcinoma), advanced primary liver cancer (hepatocellular carcinoma)
1,2). It is a small inhibitor of several tyrosine protein kinases, such as vascular endothelial growth factor receptors (VEGFR), platelet-derived growth factor receptors (PDGFR) and Raf family kinases (more avidly C-Raf than B-Raf)
3,4); In many of the molecular pathways, the over activation of protein kinases, such as Raf kinase, platelet-derived growth factor (PDGF), vascular endothelial growth factor (VEGF) receptor 2 and 3 kinases and c Kit the receptor for Stem cell factor, cause cells to become cancerous
5-7). However, various side effects were also reported from patients receiving sorafenib, especially include skin rash, swelling, redness, pain and peeling of the skin on the palms of hands and soles of feet, hypertension, diarrhea, fatigue, reversible posterior leukoencephalopathy syndrome and erythrocytosis
1,8,9), and hypersensitivity to sorafenib or any ingredient in the formulation were known
10-12). Various drug-drug interactions have been evaluated to improve the side effects of sorafenib or to achieve synergic effects
1,13-20). However, interactions of sorafenib with herbal products have not been established except for some restricted natural compounds, interact with warfarin increased risk of bleeding
21)and St. John’s wort (Hypericum perforatum) possible decreased plasma concentrations of sorafinib
1). In addition, we have been observed the possible interactions with Korean traditional polyherbal formulas; we observed that marked increases of oral bioavailability of sorafenib after co-administration of Gongjindan, a famous Korean tonic mixed herbal formulation within 5 min or
with 3.5hr-intervals co- administration,
22,23). Blue honeysuckle (Berries of Lonicera caerulea L.,Caprifoliaceae) is a traditional deciduous shrub used in folk medicine in northern Russia,China,and Japan, but its fruits are little known as edible berries in North America and Europe, and also in Korea
24). The berries are a rich source of ascorbic acid and polyphenols, particularly anthocyanins, flavonoids and low molecular weight phenolic acids
24,25). These compounds have been reported to have multiple biological activities including strong antioxidant activity and anti-inflammatory properties
24). Recently, oral administration of blue honeysuckle was reported to protect oxidative damage in mice against ionizing radiation
26), ameliorates abnormal lipid and glucose metabolism in rats
27), hepatoprotective effects
28), anti-inflammatory effects
29,30). Especially blue honeysuckle extracts have showed the strongest antioxidant potent among 12 types of colored berries
31), and phenolic rich extract of BH has been revealed to have anti-inflammatory and wound-healing effects in vitro and in vivo
29)and skin protective effects to ultraviolet- induced damages
32,33)with less toxicity
34).
In the present study, the effects of blue honeysuckle concentrated and lyophilized powders (BH) on the pharmacokinetics of sorafenib were observed in rats after mixed formulation as sorafenib 40 and BH 400, 200 and 100 mg/kg concentrations.
II. Material and methods
1. Animals and husbandry
Forty male SPF/VAF Outbred Crl:CD [SD] rats
(6-wk old upon receipt; OrientBio, Seungnam,
Korea) were used after acclimatization for 10
days. Animals were allocated five per
polycarbonate cage in a temperature (20-25℃) and humidity (40-45%) controlled room. Light : dark cycle was 12 hr : 12 hr and feed (Samyang, Korea) and water were supplied free to access.
After 10 days of acclimatization, four groups of 5 rats each were selected based on the body weights. All animals were marked by picric acid, and overnight fasted (about 18 hrs; water was not restricted) before treatment, and further fasted during 3 hrs after end of treatment. Animal experiments were conducted according to the national regulations of the usage and welfare of laboratory animals, and approved by the Institutional Animal Care and Use Committee in Daegu Haany University (Gyeongsan, Gyeongbuk, Korea; Approval No. DHU2014-079).
2. Test articles
Deep purple colored solution of concentrated blue honeysuckle, about 63 brix, was supplied by H&K Bioscience Co., Ltd. (Seoul, Korea) and used as same as our previous single oral dose toxicity test
34)in this experiment. The brief process for making BH was as follows. 200 g of 63 brix concentrated blue honeysuckle solutions supplied by H&K Bioscience was diluted into 25 brix using distilled water, and then completely lyophilized by programmable freeze dryer (Operon FDB-5503, Kimpo, Korea). Total 124.40 g (yield = 62.2%) of BH was acquired. At proximate analysis of BH by Association of Official Analytical Chemists (AOAC)
35)methods, BH contains energy 380 kcal/100 ml, carbohydrate 93 g/100 ml, sugar 41 g/100 ml, protein 2 g/100 ml, sodium 20 mg/100 ml, but it did not contains total lipids (0 mg/100 ml), saturated lipids (0 mg/100 ml), trans-fat (0 mg/100 ml), cholesterol (0 mg/100 ml), respectively. In addition, phytochemical analysis of BH reveals that it contains 4.54 ± 0.09% of betaine by high performance liquid
chromatography (HPLC), 210.63 ± 23.65 mg gallic acid equivalents (GAE)/g of total phenols by Folin-Ciocalteu colorimetric method
36), 159.30 ± 12.51 mg catechin equivalents (CE)/g of total flavonoids by a modified colorimetric method
37)and 133.57 ± 4.06 mg malvidin-3- O-glucoside equivalents (M3GE)/g of total antocyanins by a modified pH differential method
38), respectively. In addition, white powder of sorafenib (Jeil Pharm. Co., Yongin, Korea) was used as control drug. Both drugs are well dissolved (up to 40 mg/ml solutions in BH and upto 4 mg/ml solutions in sorafenib) in distilled water as vehicle, respectively.
3. Test article formulation and administration
Four groups of 5 rats each were used in this study as follows. The dosages of sorafenib 40 mg/kg were selected, considering the clinical dosage in human and body surface of rats. Single formula of sorafenib was prepared as dissolved in distilled water (4 mg/ml concentration), and each mixed formula consisted of sorafenib and BH was prepared by dissolved of approximate amounts of sorafenib (40 mg/kg) and BH (400, 200 or 100 mg/kg) in distilled water. Sorafenib single formula and all three types of mixed formula consisted of sorafenib and BH were once orally administered, in a volume of 10 ml/kg, respectively.
4. Plasma collections
All rats were anesthetized with 2 to 3%
isoflurane (Hana Pharm. Co., Hwasung, Korea)
in the mixture of 70% N
2O and 28.5% O
2, and
blood samples (0.5 ml) were collected into 50 IU
heparinized 0.7 ml Eppendorf tubes through the
orbital plexus at 30 min before treatment (as a
control), 30 min, 1, 2, 3, 4, 6, 8 and 24 hrs
after end of single oral administration of
sorafenib single or mixed formula with three different dosages of BH, respectively. Blood samples were immediately centrifuged for 10 min at 13,000 rpm and about 0.3 ml aliquots of plasma were stored in a -150 ℃ deep freezer until analysis of sorafenib.
5. Sample preparation and calibrations
Primary stock solution, 1.0 mg/ml of sorafenib in 90% acetonitrile (Sigma-Aldrich, St. Louise, MO, USA) mixtures with distilled water and internal standard working solution, carbamazepine (Sigma-Aldrich, St. Louise, MO, USA) 500 ng/ml in acetonitrile were prepared.
Working standard solutions were prepared by dilution with acetonitrile. All standard solutions were stored at -20℃ in the dark when not in use, and calibrated the standard samples as 100 μl of blank plasma; working standard solutions and internal standard working solution were mixed with 100 μl of acetonitrile. In addition, 100 μl of sample plasma and internal standard working solution were mixed with 200 μl of acetonitrile. The mixtures were mixed by vortex-mixing and centrifuged at 12,000 rpm for 10 min at 4 ℃. Clear supernatants (150 μl) were directly transferred to injection vials and the aliquot (5 μl) was injected into the LC-MS/
MS system
22,23).
6. LC-MS/MS conditions
Concentrations of sorafenib in the rat plasma samples were determined using LC-MS/MS method. Chromatographic analysis was performed using an Agilent 1100 Series HPLC (Agilent Technologies, Santa Clara, CA, USA) equipped with on-line degasser, binary pump, autosampler and column compartment. Separation of the analyte from potentially interfering material was achieved at ambient temperature using Waters
Symmetry
TMC
18columns (2.1×50 mm, 3.5 μm) (Waters Corp., Milford, MA, USA). The mobile phase used for the chromatographic separation was composed of 25% distilled water (0.1% formic acid)/75% acetonitrile, and was delivered isocratically at a flow rate of 0.30 ml/min. The column effluent was monitored using an API 2000 triple-quadruple mass-spectometric detector (Applied Biosystems, Foster City, CA, USA). The instrument was equipped with an electrospray interface in positive ion mode, and controlled by the Analyst version 1.4.1, Quadratic (1/x
2, no Iterate) software (Applied Biosystems, Foster City, CA, USA). Samples were introduced to the interface through a Turbo IonSpray with the temperature set at 300 °C. A high positive voltage of 5.5 kV was applied to the ion spray. Nitrogen was used as the nebulizer gas, curtain gas, and collision gas with the settings of 20, 20, and 4, respectively. The multiple reaction monitoring (MRM) detection method was employed for the detection of sorafenib; the transitions monitored were carbamazepine (IS): m/z 237>194 (Retention time: 0.56 min), sorafenib: 465>252 (Retention time: 0.85 min). Calibration curves of sorafenib were quadratic over the ranges studied with r
2> 0.999. The lower limit of quantification of the sorafenib in the rat plasma was 40 ng/ml
22,23).
7. Pharmacokinetic analysis
The plasma concentration data was analyzed
using a noncompartmental method on commercial
pharmacokinetics data analyzer programs (PK
solutions2.0; Summit, Montrose, CO, USA)
39,40).
The elimination rate constant (K
el) was calculated
by the log-linear regression of sorafenib
concentration data during the elimination phase,
and the terminal half-life (t
1/2) was calculated by
0.693/K
el. The peak concentration (Cmax) and
time to reach the peak concentration (Tmax) of
sorafenib in the plasma were obtained by visual
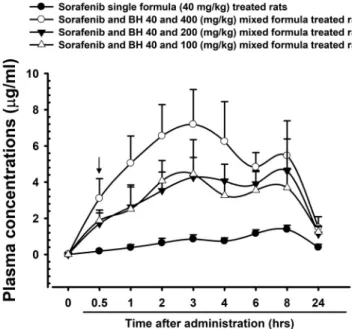
Figure 1. Plasma concentrations of sorafenib after single oral administration of sorafenib single or mixed formulas with BH 400, 200 or 100 mg.kg in male Rats. Sorafenib was detected from 30 min to 24 hrs after end of
administration in sorafenib single formula and all three different concentrations of mixed formulas with BH administered rats, respectively. Single oral administration of mixed formulas consisted of sorafenib 40 mg/kg and
BH 400, 200 or 100 mg/kg induced significant (p<0.01) increases of plasma sorafenib concentrations, from 30 min after end of administration throughout all blood collected time points, as compared with sorafenib 40 mg/kg single formula treated rats, respectively (arrow). Values are expressed as mean ± SD of five rats (μg/ml). BH = Blue honeysuckle (fruit parts of Lonicera caerulea L., Caprifoliaceae) concentrated and lyophilized powder (H&K
Bioscience Co., Ltd., Seoul, Korea) inspection of the data in the concentration-time
curve. The area under the plasma concentration- time curve (AUC
0-t) from time zero to the time of the last measured concentration (C
last) was calculated using the linear trapezoidal rule
41). The AUC zero to infinity (AUC
0-inf) was obtained by adding AUC
0-tand the extrapolated area was determined by C
last/K
el. The mean residence time infinity (MRT
inf) was calculated by dividing the first moment of AUC (AUMC
0-inf) by AUC
0-inf.
8. Statistical analyses
All the means are presented with their standard deviation (SD) of five rats (Mean ± SD of five rat plasma sorafenib concentrations). The pharmacokinetic parameters were compared using a non-parametric comparison test, Mann- Whitney U (MW) test, on the SPSS for Windows
(Release 14.0K, SPSS Inc., Chicago, IL, USA). A p-value < 0.05 was considered statistically significant.
III. Results
1. Changes on the plasma concentrations of sorafenib
Sorafenib was detected from 30 min to 24 hrs
after end of administration in sorafenib single
formula and all three different concentrations of
mixed formulas with BH administered rats,
respectively. Single oral administration of mixed
formulas consisted of sorafenib 40 mg/kg and BH
400, 200 or 100 mg/kg induced significant (p<0.01)
increases of plasma sorafenib concentrations, from
30 min after end of administration throughout all
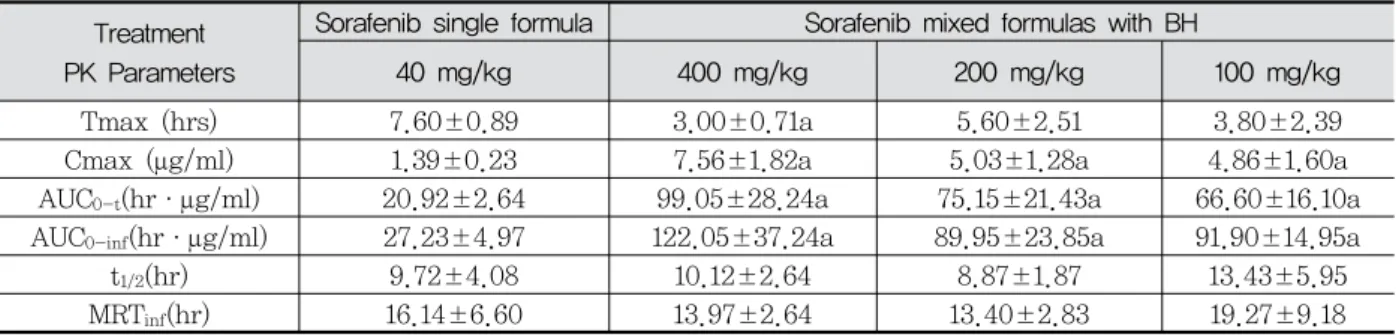
Table 1. Pharmacokinetic parameters of sorafenib after single oral administration of sorafenib single or mixed formulas with BH 40, 20 or 10 mg/ml in male rats
Treatment PK Parameters
Sorafenib single formula Sorafenib mixed formulas with BH
40 mg/kg 400 mg/kg 200 mg/kg 100 mg/kg
Tmax (hrs) 7.60±0.89 3.00±0.71a 5.60±2.51 3.80±2.39
Cmax (μg/ml) 1.39±0.23 7.56±1.82a 5.03±1.28a 4.86±1.60a
AUC
0-t(hr·μg/ml) 20.92±2.64 99.05±28.24a 75.15±21.43a 66.60±16.10a
AUC
0-inf(hr·μg/ml) 27.23±4.97 122.05±37.24a 89.95±23.85a 91.90±14.95a
t
1/2(hr) 9.72±4.08 10.12±2.64 8.87±1.87 13.43±5.95
MRT
inf(hr) 16.14±6.60 13.97±2.64 13.40±2.83 19.27±9.18
Values are expressed as mean ± S.D. of five rats. BH = Blue honeysuckle (fruit parts of Lonicera caerulea L., Caprifoliaceae) concentrated and lyophilized powder (H&K Bioscience Co., Ltd., Seoul, Korea). Cmax: The peak plasma concentration, Tmax: Time to reach Cmax, AUC
0-t: The total area under the plasma concentration-time curve from time zero to time measured, AUC
0-inf: The total area under the plasma concentration-time curve from time zero to time infinity, t
1/2: Half life, MRT
inf: Mean residence to time infinity.
ap<0.01 as compared with sorafenib single formula administered rats.
blood collected time points, as compared with sorafenib 40 mg/kg single formula treated rats, respectively (Fig 1).
2. Changes on the Tmax of sorafenib
The Tmax of sorafenib was significantly (p
<0.01) decreased as -60.53% points in sorafenib and BH 400 mg/kg mixed formula treated rats (3.00±0.71 hr) as compared with sorafenib single formula treated rats (7.60±0.89 hr). In addition, the Tmax of sorafenib were non- significantly changed as -26.32 and -50.00%
points in sorafenib and BH 200 or 100 mg/kg mixed formula treated rats as compared with sorafenib single formula treated rats; they were detected as 5.60±2.51 and 3.80±2.39 hr in sorafenib and BH 200 or 100 mg/kg mixed formula treated rats, respectively (Table 1).
3. Changes on the Cmax of sorafenib
The Cmax of sorafenib were significantly (p
<0.01) increased as 444.38, 262.25 and 250.43%
points in sorafenib and BH 400, 200 or 100 mg/kg mixed formula treated rats as compared with sorafenib single formula treated rats,
respectively. They were detected as 7.56±1.82, 5.03±1.28 and 4.86±1.60 μg/ml in sorafenib and BH 400, 200 or 100 mg/kg mixed formula treated rats, and as 1.39±0.23 μg/ml in sorafenib single formula treated rats, in this experiment (Table 1).
4. Changes on the AUC of sorafenib
The AUC
0-tof sorafenib were significantly (p
<0.01) increased as 373.45, 259.20 and 218.34%
points in sorafenib and all three different
concentrations of BH mixed formula treated rats
as compared with sorafenib single formula
treated rats, respectively. They were detected as
99.05±28.24, 75.15±21.43 and 66.60±16.10
hr·μg/ml in sorafenib and BH 400, 200 or 100
mg/kg mixed formula treated rats, and as
20.92±2.64 hr·μg/ml in sorafenib single
formula treated rats, in this experiment. In
addition, the AUC0-inf of sorafenib were also
significantly (p<0.01) increased as 348.28,
230.37 and 237.55% points in sorafenib and all
three different concentrations of BH mixed
formula treated rats as compared with sorafenib
single formula treated rats, respectively. They
were detected as 122.05±37.24, 89.95±23.85
and 91.90±14.95 hr·μg/ml in sorafenib and BH 400, 200 or 100 mg/kg mixed formula treated rats, and as 27.23±4.97 hr·μg/ml in sorafenib single formula treated rats, in this experiment.
(Table 1).
5. Changes on the t
1/2of sorafenib
The t
1/2of sorafenib were non-significantly decreased as 4.11, -8.76 and 38.22% points in sorafenib and all three different concentrations of BH mixed formula treated rats as compared with sorafenib single formula treated rats, respectively. They were detected as 10.12±2.64, 8.87±1.87 and 13.43±5.95 hr in sorafenib and BH 400, 200 or 100 mg/kg mixed formula treated rats, and as 9.72±4.08 hr in sorafenib single formula treated rats, in our experiment (Table 1).
6. Changes on the MRTinf of sorafenib
The MRT
infof sorafenib were non-significantly decreased as -13.44, -16.97 and 19.38% points in sorafenib and all three different concentrations of BH mixed formula treated rats as compared with sorafenib single formula treated rats, respectively. They were detected as 13.97±3.81, 13.40±2.83 and 19.27±9.18 hr in sorafenib and BH 400 , 200 or 100 mg/kg mixed formula treated rats, and as 16.14±6.60 hr in sorafenib single formula treated rats, in our experiment (Table 1).
IV. Discussion
As results of single oral administration of mixed formulas consisted of sorafenib and BH 400, 200 or 100 mg/kg, significant (p<0.01) increases of plasma sorafenib concentrations were demonstrated from 30 min after end of administration
throughout all blood collected time points as compared with those of sorafenib 40 mg/kg single formula treated rats. Significant (p<0.01) decreases of sorafenib Tmax with increases of Cmax, AUC
0-tand AUC
0-infwere detected in sorafenib and BH 400 mg/kg mixed formulation treated rats as compared with sorafenib 40 mg/kg single formula treated rats, respectively.
In addition, sorafenib and BH 200 or 100 mg/kg mixed formula treatment also showed significant (p<0.01) increases of sorafenib Cmax, AUC
0-tand AUC
0-infas compared with sorafenib 40 mg/kg single formula treated rats, respectively.
These findings are considered as direct evidences that mixed formulation with BH significantly increased the oral bioavailability of sorafenib through increase of the absorptions, regardless of BH concentrations - 400, 200 and 100 mg/kg, and suggesting the mixed formulation of BH and sorafenib should be avoided as the integrative medicine for hepatic cancer.
The relative oral bioavailability of sorafenib was known as 38-49% after oral administration
18,42)