고
고추 추재 재배 배에 에서 서 토 토성 성별 별 토 토양 양수 수분 분,, 토 토양 양온 온도 도,, 무 무기 기태 태질 질소 소 변 변화 화에 에 따
따른 른 C CO O
22배 배출 출량 량 평 평가 가
Evaluation of CO
2Emission to Changes of Soil
Water Content, Soil Temperature and Mineral N with Different Soil Texture in Pepper Cultivation
김건엽*·송범헌1·홍석영·고병구·노기안·심교문·장용선
Gun-Yeob Kim,
*Beom-Heon Song
1, Suk-Young Hong, Byong-Gu Ko, Kee-An Roh, Kyo-Moon Shim, Yong-Seon Zhang
농촌진흥청 국립농업과학원, 1충북대학교 식물자원학과
National Academy of Agricultural Science(NAAS), RDA, Suin-ro 150, Gwonseon-gu, Suwon-si 441-707, Korea
1
Chungbuk National University, Cheongju 361-763, Korea
Several researchers have proposed models or equations to predict soil CO
2flux from more readily available biotic and abiotic measurement. Tree commonly used abiotic variables were N mineral and soil temperature and soil water content. This study was conducted to determine CO
2emission to mineral N, soil water content and soil temperature with clay loam and sandy loam in pepper cultivation in 2004~2005.
CO
2flux in the upland with different levels of soil water potential was measured at least once in two weeks during the cropping period in the pepper cultivation plots. Soil water potential in the clay loam and sandy loam soils was established at -30kPa and -50kPa by measuring the soil gravimetric water content with two replications. CO
2emission rate from the differently managed plots was highly correlation coefficient to between the mineral N (R=0.830
**, 0.876
**) and soil temperature (r
2=0.793
**, 0.804
**) in the clay loam and sandy loam, respectively. However, the relationships between CO
2emission and soil water content were non-significant. CO
2emissions at sandy loam soils was lower to 21~37% than at clay loam soils for both soil water conditions without differences in yield. At difference levels of soil water conditions, CO
2emission at - 50kPa decreased to 37.5% in comparison with that at -30kPa. From the path analysis as to contribution factors of GHGs, it appeared that contribution rate was in the order of soil temperature (54.9%), mineral N (32.7%), and soil moisture content (12.4%).
Key words: CO
2emission, Soil water potential, Mineral N, Soil temperature, Soil texture서 언
산업혁명 이전인 1750년에 대기의 CO2 농도는 수천 년 동안 280±10 ppm이었다. 그때부터 계속 증가하여 1999년에는 367 ppm에 도달하였다. 현재의 대기 CO2 증가는 인위적인 CO2배출이 그 원인이다. 경작지 토 양은 탄소순환과 CO2를 C로 전환시키는 토양 미생물 에 의해 토양유기물 분해와 식물뿌리 호흡을 통해 대 기로 탄소를 배출시키는 역할을 하며 기후변화를 일 으키는 요인을 제공하는 중요한 탄소배출원 중 하나 이다.
농경지 생태계에서 언급하는 CO2는 정반대의 의미 를 지닌 크게 2가지 플럭스로 구분할 수 있으며, 이는 광합성에 의한 작물의 CO2흡수와 뿌리, 줄기, 토양호 흡에 의한 CO2배출로 나눌 수 있다. 토양호흡에 의한 CO2배 출 에 영 향 을 주 는 요 인 은 토 양 온 도 (Buyanovsky 등, 1986; Kutsch 등, 1997; Rochette 등, 1995), 토양수분 (Akinremi 등, 1999; Buyanovsky 등, 1986; Kutsch 등, 1997), 토성 (Bouma 등, 2000), 토양유기물탄소 (Lou 등, 2003), 무기태질소(Xu 등, 2004; Ginovart 등, 2005), 그리고 pH (Reth 등, 2005) 등이다.
질소시비와 유기물 토양 투입에 대한 탄소 연구는 주로 작물에 의한 탄소흡수 관계를 평가하는데 제한 되어 있으며, 토양 중 질소시비에 의해 토양에서 CO2 접 수 : 2008. 10. 4 수 리 : 2008. 11. 30
*연락저자 : Phone: +82312900240, E-mail: [email protected]
배출의 증가와 작물 잔사의 분해 촉진과 관련된 연구 는 미미하였다. 토양 중 질소 시비량의 증가에 따라 토양 중 CO2배출량도 동시에 증가하며 (Mansson 등, 2003; Xu 등, 2004)는 질소질 비료시용에 의한 CO2배 출 시험에서 CO2배출량은 토양 중 무기태 질소인 NH4+에 의해 가장 CO2배출이 크다고 하였다.
토양 pH값이 클수록 토양 중 미생물 활성도가 크기 때문에 토양 호흡과의 상관관계가 크다 (Andersson 등, 2001; Hall et al., 1997; Sitaula 등, 1995)고 하였다.
밭에서는 토양수분, 무기태질소 (NH4+-N, NO3--N), 토양온도 등의 변화에 따라 CO2의 배출량이 달라지기 때문에 온실가스를 저감할 수 있는 요건이 이들 요소 들이라고 감안할 때 이들에 대한 농경지에서 CO2배출 의 평가가 필요하므로 본 연구에서는 고추재배에서 토성별로 CO2배출 양상을 구명하고, CO2배출에 영향 을 주는 요인의 변화에 따른 CO2배출을 평가하고자 하였다.
재료 및 방법
본 시험은 수원시에 위치한 국립농업과학원의 시험 포장에서 수행하였다. 시험 토양은 고평통 식양토 (37
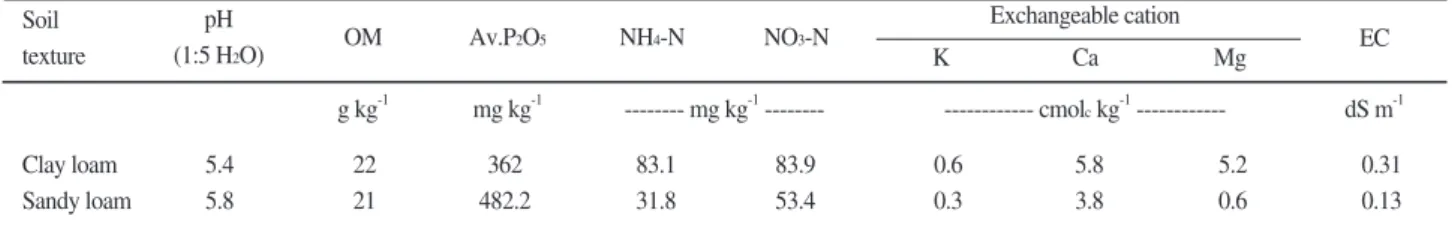
˚15′27.68″N, 126˚59′16.05″E)와 본량통 사양토 (37˚15′38.47″N, 126˚59′20.64″E)에서 유기물 함 량이 각각 22, 21 g kg-1로서 특성은 표 1과 같고 농촌 진흥청 토양화학분석법 (NIAST, 1988)에 준하였다.
고추 (마니따)를 2004년에는 2월 22일에 파종하고 5 월 12일에 정식하였다. 2005년에는 2월 22일에 파종하 고 5월 15일에 정식에 정식하였다. 재식거리는 60×40
㎝, 시험구 면적은 64 ㎡이였으며, 시험구 배치는 22 요인시험으로 하였다.
시비는 농촌진흥청 (2006)작물별 시비처방기준에 의 한 표준시비방법으로 하였다. PK 처리구는 질소를 시 용하지 않고 P2O5-K2O를 112-149 kg ha-1, NPK+돈분 퇴비 처리구는 N-P2O5-K2O를 190-112-149 kg ha-1로 N은 3회 분시, P2O5는 전량 기비, K2O는 2회 분시 하 였고, 돈분퇴비 15,000 kg ha-1을 시용하였다.
고추 재배 시 토양수분함량에 따른 적정 관개시점 은 -30kPa으로 알려져 있다. 본 시험에서는 토양수분 의 효율성 검정을 위해 식양토와 사양토에 각 관수시
점 을 -30kPa와 -50kPa 두 처 리 를 두 었 으 며 , tensiometer로 토양수분을 측정하였다. 관수방법은 점 적관수로 비 가림 재배를 하였다. 토양수분 장력 -30 kPa과 -50 kPa에 해당하는 토양 중량수분 함량은 Eom 등 (1995)의 방법을 이용하였다. 토양온도 측정 은 Hydraprobe (Stevens-water社)를 고추의 근권인 토양 깊이 20 ㎝에 설치하여 측정하였다. 토양의 무기 태 질소는 원소자동분석기(Automatic analyer;
FIAstar 5000)로 NH4+-N과 NO3--N을 분석하였다.
고추 정식 한 달 후부터 1주 간격으로 토양에서 배 출되는 CO2가스를 포집·측정하였다. CO2 배출량은 soda lime (NaOH와 Ca(OH)2)법 (Kleber, 1997)을 사 용하였으며, soda lime에 흡수된 CO2 양을 칭량하였 다. 크기가 2∼5㎜ (Merck catalogue No. 6839.
soda)의 과립형 soda lime을 100℃에서 24시간 건조시 킨 다음, 40g을 칭량하여 플라스틱 접시에 넣고 토양 표면으로부터 2∼3 cm 높이에 설치된 삼각대에 담아 서 스테인레스 원통 chamber를 씌워 7일간 노출 시 켰다. 스테인레스 원통 chamber는 직경 23 ㎝ (밑면 적 415.5㎠), 높이 31 ㎝인 부피 10ℓ로 제작하였다. 7 일 후 soda lime을 100℃, 24시간 건조 시킨 후 CO2의 양 (g CO2 m-2 d-1)을 계산하였다. 보정계수 (보정계 수는 CO2+H2O/CO2가 1.4)와 재배기간 일수를 곱하여 재배기간 동안 CO2흡수된 양으로 환산하는 중량법으 로 측정하였다.
CO2의 양 (g CO2 m-2 d-1)은 Tesarova와 Gloser (1976)의 방법에 의하여 3.5∼23.8g CO2 m-2 d-1에서 측정값이 인정되며 그 외에 범위를 벗어난 값은 측정 오차로 간주하고 있다.
온실가스 기여도 평가는 SPSS를 이용하여 다중회 귀 분석하였다.
CO2배출에 대한 요인별 기여율은 관여하는 요인인 독립변수 (무기태질소, 토양수분함량, 토양온도)들의 상관계수 값에 이들 각 각의 표준편회귀계수로 곱하 여 백분율로 환산하였다.
결과 및 고찰
토양수분, 토양온도 및 토양의 무기태질소 (NH4+- N+NO3--N) 함량과 CO2 배출량의 경시적 변화는 그
˚
Soil texture
Clay loam Sandy loam
5.4 22 362 83.1 83.9 0.6 5.8 5.2 0.31
5.8 21 482.2 31.8 53.4 0.3 3.8 0.6 0.13
Mg EC Ca
K
Exchangeable cation NO3-N
NH4-N Av.P2O5
OM
g kg-1 mg kg-1 --- mg kg-1--- --- cmolckg-1--- dS m-1 pH
(1:5 H2O)
Table 1. Chemical properties of the soil used in the experiment.
림 1과 같다. 식양토에서의 CO2 배출량은 -30 kPa에 서는 1주째(6월25일∼7월3일) 가장 많았고, 2∼3주째 (7월4일∼7월18일) 가장 낮았으며, 4∼6주째(7월19일
∼8월11일) 다시 많아졌다가 점차 감소하는 경향이었 다. -50 kPa 에서는 1∼2주째(6월25일∼7월10일) 높 았다가 3∼4주째(7월11일∼7월28일)에는 감소하였으 며 5∼6주째(7월31일∼8월11일)에 가장 많았다가 그 이후에는 급격히 감소하였다. 사양토에서 CO2 배출량 은 -30 kPa에서는 1∼3주에 비하여 4∼8주까지 더 많 아졌다가 급격히 감소한데 비하여 -50 kPa에서는 1주 째에 가장 많았다가 계속 감소하는 경향이었다. 이러 한 CO2 배출량의 변화는 토양온도 및 무기태 질소 함 량의 변화와 비슷한 경향이었으며, -30 kPa 에서는 토양수분과는 반대의 경향을 보였지만 -50 kPa에서는 토양수분과 일정한 경향을 보이지 않았다. CO2 배출 량은 어느 시기에서나 사양토보다는 식양토에서 더 많았다.
표 2에서 사양토보다 식양토에서 토양 CO2 배출량 이 높았다. 작물 생육기간 중 식양토 -30 kPa과 -50 kPa 처리구에서 적산 토양수분 함량은 각 각 458.1과
442.0%, 적산온도는 271.1과 258.7℃ 그리고 토양 중 무기태 질소의 적산량은 904.8과 477.2 mg kg-1로 나 타났다. 사양토는 토양수분 함량이 263.6과 246.3%, 토양온도는 268.8과 251.7℃, 그리고 토양 중 무기태질 소의 적산량은 1010.9과 463.9 mg kg℃로 나타났다.
토성별 토양수분 변화와 CO2배출량은 그림 2와 같 다. 고추 재배 전 기간 중 CO2 총 배출량은 토성별 토양수분 장력 -30kPa와 -50kPa에서 사양토보다 식 양토에서 높았고, 수분함량이 많을수록 CO2 배출량이 많았다.
고추 포장에서 CO2 배출량, 토양수분, 무기태질소 및 토양온도와의 관계는 그림 3과 같다. 토성별 CO2 배출량과 토양수분, 토양온도 그리고 무기태질소를 회귀분석 한 결과, 토양온도와 무기태 질소에서 식양 토는 68.9%와 76.7%, 그리고 사양토에서는 62.9%와 64.6%로 CO2 배출 경시적 변이를 설명할 수 있었다.
CO2 배출량과 토양수분함량과는 상관관계가 없었다.
CO2 배출량과 토양온도 및 무기태질소의 상관계수는 식양토에서 0.830**, 0.876**, 사양토에서 0.793**, 0.804**
로 상관은 고도로 유의하였다.
Fig. 1. Changes of CO2emission, soil water contents, soil temperature, and N mineral in clay and sandy loam upland soils.
(Values are the mean of three replications measured between 9:00 a.m. and 11:00 a.m. at sampling dates).
CO2emission (tonne ha-1) Soil water content (%) Soil temperature (℃) Mineral N (mg kg-1)
20.8 458.1 271.1 904.8
13.0 442.0 258.7 477.2
16.4 263.6 268.8 1010.9
8.2 246.3 251.7 463.9 -50 kPa -30 kPa
-50 kPa -30 kPa
Clay loam Sandy loam
Table 2. Accumulated amount of CO2emission, soil water content, soil temperature, and mineral N.
Piao 등 (2000)은 CO2배출은 토양수분과는 상관관 계가 없고, 오히려 대기 온도와 상관이 높다고 하였으 며, 기온이 10 씩 증가함에 따라 토양으로부터 배출되 는 CO2양은 1.5∼3배 증가 한다 (Parada 등, 1983;
Norstadt 등, 1984)는 보고도 있다. Lou 등 (2003)은 토양 CO2 배출 플럭스가 토양수분 보다 토양 온도 및 토양 유기탄소와 밀접한 관계가 있다고 하였다.
Lohila 등 (2003)은 토성별 (피트, 식양토, 사양토), 보리, 토마토, 목초 등 작물별로 토양의 CO2 배출에 대한 연구에서 토양의 CO2 배출은 피트토양에서 가장 높고, 사양토와 식양토에서는 비슷하거나, 식양토에서 약간 높다고 하였다. Koizumi 등 (1999)은 사양토는 토양호흡과 토양수분과의 관계에서 정의 상관관계가
나타나고, 토양호흡과 토양온도는 유의성이 없다고 하였다. 반면에 식양토는 CO2 배출과 토양온도 사이 에는 정의 상관관계 있고 토양수분과는 부의 관계가 있다고 하였다.
Mansson 등 (2003)은 질소 시비량이 증가함에 따라 토양 중 CO2 배출량도 증가한다고 하였으며, Xu (2004)는 질소질 비료시용에 의한 CO2 배출량 변화 연구에서 CO2 배출량은 토양 중 무기태 질소인 NH4- N이 증가함에 따라 CO2 배출이 크게 증가하였다고 하였다.
이상의 결과를 종합하여 볼 때, CO2배출량은 토양수 분의 영향보다 토양 중 토양온도와 무기태 질소의 영 향을 더 많이 받았으나, 토양수분의 적산함량은 CO2 배출의 총량에는 영향을 주는 것으로 나타났다.
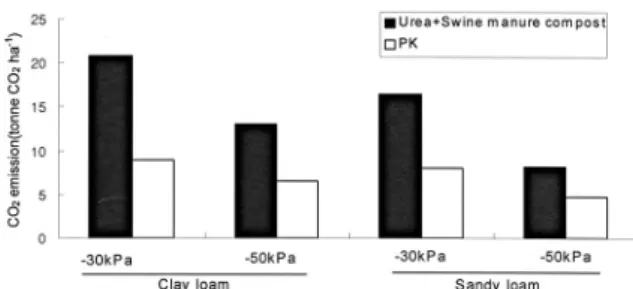
고추 생육기간 중 정식 후 1주일부터 2차 홍 고추 수확까지 143일 (재배기간 2년 평균)간의 CO2의 총 배출량을 토양 토성에 따라 수분장력별로 처리하여 비교한 결과는 그림 4와 같이 나타났다. 토성에 따른 CO2배출량은 식양토는 16.4∼20.8 tonne CO2 ha-1로 나타났고, 사양토는 8.2∼13.0 tonne CO2 ha-1로 나타 났다. 토양수분 장력 -30kPa에서는 13.0∼20.8 tonne CO2 ha-1로 나타났고, -50kPa에서는 8.2∼16.4 tonne CO2 ha-1로 나타났다. 토성별로는 식양토보다 사양토 에서 21.2∼36.9%가 저감되었다. 이러한 결과는 Koizumi 등 (1999)이 CO2 배출량이 사양토 (300mg Fig. 2. Relationship between CO2emission and different levels
of soil water contents in clay and sandy loam soils.
Fig. 3. Correlations between CO2emissions and soil water contents, soil temperature, and N mineral in clay and sandy loam soils.
CO2 m-2 hr-1)보다 식양토 (500mg CO2 m-2 hr-1)에서 더 많다고 한 보고와 일치하였다. Dilustro 등 (2005) 의 혼합소나무림 토양에서 CO2 총 배출량이 사양토 (2.71 μ㏖ m-2 s-1)가 식양토 (3.96 μ㏖ m-2 s-1)에 비해 배출량이 적다고 한 보고와 일치하였다.
이상과 같이 CO2 배출량은 -30kPa에 비해 -50kPa 에서 식양토 37.5%, 사양토는 50.0% 저감되었으며, 고추재배에서 과다관개를 피하면 CO2 배출량을 저감 할 수 있었다.
CO2 배출에 대한 기여도 평가 결과, CO2 배출에 대 한 3개의 독립변수 (무기태질소, 토양수분함량, 토양 온도)에 의해 식양토에서 84.6%, 사양토 72.3%를 설 명할 수 있었다. CO2 배출에 대한 각 요인의 기여율 은 토양온도 (식양토: 46.6%, 사양토: 69.7%), 무기 태질소 (39.3%, 26.2%), 토양수분함량 (14.1%, 4.1%) 순으로 나타났다. 즉, 토양온도가 CO2 배출에 가장 영 향을 미치는 요인으로 분석 되었다(표 3).
CO2 배출과 토양온도의 관계에서 Lou 등 (2003)은 토양 CO2 배출은 토양 수분보다 토양온도와 토양 유 기 탄소가 더 많은 기여를 한다고 하였다.
적 요
시험포장은 수원시에 위치한 국립농업과학원의 기후
변화생태과 시험포장에서 고추를 재배하여 식양토와 사양토의 2개 토성을 대상으로 각 관수시점을 -30kPa 와 -50kPa에서 온실가스배출에 관여하는 요인인 토양 수분, 토양온도, 토양 중 무기태질소를 측정하여, CO2 배출 간의 관계와 배출 특성을 구명하고자 하였다. 본 시험의 연구 결과, 토양의 CO2배출량과 무기태질소 그리고 토양온도에서 높은 상관관계가 있었으나, 토 양수분과는 상관을 보이지 않았다. 그리고 CO2 배출 량과 토양수분함량과는 상관관계가 없었다. CO2 배출 량과 토양온도 및 무기태질소의 상관계수는 식양토에 서 0.830**, 0.876**, 사양토에서 0.793**, 0.804**로 상관은 고도로 유의하였다.
고추 재배기간 143일간 CO2의 작기종합 배출량을 토양 토성에 따라 수분장력별로 처리하여 비교한 결 과, 수분장력이 식양토에서 -30kPa에 비해 -50kPa에 서 37.5%, 사양토는 50.0% 저감되었으며, 식양토에 비해 사양토에서 21.2∼36.9% (-30kPa∼-50kPa) 저 감되었다.
고추밭에서 온실가스배출에 관여하는 무기태질소, 토양수분함량, 토양온도 등의 요인들 중 온실가스배 출에 어느 정도 영향을 주는가를 정량적으로 분석하 기위하여, CO2배출에 대한 기여도를 평가하였다. CO2 배출에 대한 각 요인들 간의 기여도는 토양온도 (식 양토; 46.6, 사양토; 69.7%), 무기태질소 (39.3, 26.2%), 토양수분함량 (14.1, 4.1%) 순으로 나타나, CO2배출에 관여하는 요인 중 가장 영향을 미치는 요 인은 토양온도로 나타났다.
인 용 문 헌
Akinremi, O. O., S. M. McGinn, and H. D. J. McLean, 1999. Effects of soil temperature and moisture on soil respiration in barley and fallow plots. Can. J. Soil Sci. 79:5-13.
Andersson, S., S. I. Nilsson, 2001. Influence of pH and temperature on microbial activity, substrate availability and leaching of dissolved organic carbon in a mor humus. Soil Biology and Biochemistry, 33:1181-1191.
Fig. 4. Amount of CO2emissions at different soil water contents in clay and sandy loam soils.
Factors
Soil water contents (a) Soil temperature (b) Nmineral(c)
Multiple correlation coefficient(R) R-square
Multiple regression equation
0.067 0.512**
0.440**
0.920 0.846
0.155 0.673**
0.280* 0.850 0.723
0.194 0.837**
0.821**
0.227 0.880**
0.795**
14.1 46.6 39.3
4.1 69.6 26.2 Sandy
loam Clay
loam Sandy
loam Clay
loam Sandy
loam Clay
loam
Standardized coefficient(β)
*p<.05, **p<.01
Pearson correlation coefficient (r) Contribution rate (%) Table. 3. Multiple regression analysis for contribution factors to CO2in clay and sandy loam soils.
Clay loam; y=-11.809a+59.499b+5.215c-59.756 Sandy loam; y= 20.874a+38.337b+6.464c-83.242
Bouma, Tjeerd J., David R. Bryla, 2000. On the assessment of root and soil respiration for soils of different textures: interactions with soil moisture contents and soil CO2concentrations. Plant and Soil 227:215-221.
Buyanovsky G. A., Buyanovsky, G.H. Wagner, C. J. Gantzer, 1986.
Soil respiration in a winter wheat ecosystem, Soil Sci. Soc. Am. J.
50:338-344.
Dilustro, J., B. Collins, L. Duncan and C. Crawford. 2005. Moisture and soil texture effects on soil CO2efflux components in southeastern mixed pine forests. Forest Ecology and Management 204:85-95.
Eom, Ki-Cheol., Kwan-Cheol Song, Kwan-Shig Ryu, 1995.
Equations to Estimate the Soil Water Characteristics Curve Using Scaling Factor, J. Korean Soc. Soil Sci. Fert. 28:227-232.
Ginovart, M., Daniel Lopez, Anna Gras. 2005. Individual-based modeling of microbial activity to study mineralization of C and N and nitrification process in soil. Nonlinear Analysis: Real applications 6:773-795.
Hall, J. M., E. Paterson, K. Killham, 1997. The effect of elevated CO2concentration and soil pH on the relationship between plant growth and rhizosphere denitrification potential. Global Change Biol. 4, 209.
Kleber, M., 1997. Carbon exchange in humid grassland soils, University Hohenheim. 1-264.
Koizumi, H., Markku Kontturi, Shigeru Mariko, Toshie Nakadai, Yukiko Bekku, Timo Mela, 1999. Soil Respiration in Three Soil Types in Agricultural Ecosystems in Finland. Acta Agriculturae Scandinavica, Section B - Plant Soil Science, 49:65-74.
Kutsch, Werner L., Ludger Kappen, 1997. Aspects of carbon and nitrogen cycling in soils of the Bornhoved Lake district - Ⅱ.
Modeling the influence of temperature increase on soil respiration and organic carbon content in arable soils under different management. Biogeochemistry. 39:207-224.
Lohila, A., Mika Aurela, Kristiina Regina & Tuomas Laurila. 2003.
Soil and total ecosystem respiration in agricultural fields: effect of soil and crop type. plant and soil 251:303-317.
Lou, Y., Zhongpei Li and Taolin Zhang. 2003. Carbon Dioxide Flux in a Subtropical Agricultural Soil of China. 149:281-293.
Mansson, KF, U. Falkengren-Grerup, 2003. The effect of nitrogen deposition on nitrification, carbon and nitrogen mineralisation and litter C:N ratios in oak (Quercus robur L.) forests. Forest ecology and management 179:455-467
Norstadt, Fred A., Lynn K. Porter, 1984. Soil gases and temperaures: a beef cattle feedlot compared to alfalfa, Soil Sci.
Soc, Am. J. 48:783-789.
Parada, C. B., A. Long, S. N. Davis, 1983. Stable-isotope composition of soil carbon dioxide in the Tucson Basin, Arizona, U.S.A. Isotope geoscience. 1:219-236.
Piao, H. C., Y. Y. Wu, Y. T. Hong, Z. Y. Yuan, 2000. Soil-released carbon dioxide from microbial biomass carbon in the cultivated soils of karst areas of southwest China. Biol. Fertil. Soils 31:422- 426.
Rochette, P., Raymond L. Desjardins, Elizabeth Pattey, Robert Lessard, 1995. Crop net carbon dioxide exchange rate and radiation use efficiency in soybean. Agron. J. 87:22-28.
Reth, S., Markus Reichstein, Eva Falge. 2005. The effect of soil water content, soil temperature, soil pH-value and the root mass on soil CO2efflux A modified model. 268:21-33.
Sitaula, Bishal K., Lars R. Bakken, Gunnar Abrahamsen, 1995. N- Fertilization and soil acidification effects on N2O and CO2 emission from temperature pine forst soil. soil biol. biochem.
27:1401-1408.
Xu, X., Hua Ouyang, Guangmin Cao, Zhiyong Pei and Caiping Zhou. 2004. Nitrogen Deposition and carbon sequestration in alpine meadows. Biogeochemistry 71:353-369.
농촌진흥청, 2006, 작물별 시비처방 기준. 광문당 57-58.
˚