Enhanced Production of Cellobiase by a Marine Bacterium, Cellulophaga lytica LBH-14, in Pilot-Scaled Bioreactor Using Rice Bran
Wa Cao 1 , Hung-Woo Kim 1 , Jianhong Li 2 and Jin-Woo Lee 1,3 *
1 BK21 Bio-Silver Program of Dong-A, Busan 604-714, Korea
2 College of plant Science & Technology, Huazhong Agricultural University, Wuhan, Hubei 430070, China
3 Department of Biotechnology, College of Natural Resources and Life Science, Dong-A University, Busan 604-714, Korea Received January 4, 2013 /Revised March 29, 2013 /Accepted April 16, 2013
The aim of this work was to establish the optimal conditions for the production of cellobiase by a marine bacterium, Cellulophaga lytica LBH-14, using response-surface methodology (RSM). The optimal conditions of rice bran, ammonium chloride, and the initial pH of the medium for cell growth were 100.0 g/l, 5.00 g/l, and 7.0, respectively, whereas those for the production of cellobiase were 91.1 g/l, 9.02 g/l, and 6.6, respectively. The optimal concentrations of K 2 HPO 4 , NaCl, MgSO 4∙7H2 O, and (NH 4 ) 2 SO 4 for cell growth were 6.25, 0.62, 0.28, and 0.42 g/l, respectively, whereas those for the pro- duction of cellobiase were 4.46, 0.36, 0.27, and 0.73 g/l, respectively. The optimal temperatures for cell growth and for the production of cellobiase by C. lytica LBH-14 were 35 and 25℃, respectively. The maximal production of cellobiase in a 100 L bioreactor under optimized conditions in this study was 92.3 U/ml, which was 5.4 times higher than that before optimization. In this study, rice bran and am- monium chloride were developed as carbon and nitrogen sources for the production of cellobiase by C. lytica LBH-14. The time for the production of cellobiase by the marine bacterium with submerged fermentations was reduced from 7 to 3 days, which resulted in enhanced productivity of cellobiase and a decrease in its production cost. This study found that the optimal conditions for the production of cellobiase were different from those of CMCase by C. lytica LBH-14.
Key words : Celluophaga lytica, cellobiase, marine microorganism, rice bran, optimization
*Corresponding author
*Tel:+82-51-200-7593, Fax:+82-51-200-7505
*E-mail: [email protected]
This is an Open-Access article distributed under the terms of the Creative Commons Attribution Non-Commercial License (http://creativecommons.org/licenses/by-nc/3.0) which permits unrestricted non-commercial use, distribution, and reproduction in any medium, provided the original work is properly cited.
Journal of Life Science 2013 Vol. 23. No. 4. 542~553 DOI : http://dx.doi.org/10.5352/JLS.2013.23.4.542
Introduction
Conversion of cellulosic materials to fermentable sugars represents a major challenge in global efforts to utilize re- newable resources [3]. Complete enzymatic hydrolysis of cellulose requires the synergistic action of three types of en- zymes: endoglucanses (carboxymethylcellulase, EC 3.2.1.4), exoglucanases (avicelase, EC 3.2.1.91), and cellobiases (β- glucosidase, EC 3.2.1.21) [2]. Most commercial cellulases have been produced by Aspergillus and Trichoderma species with solid-state cultures [32]. However, the most widely used cellulases by T. reesei are poor in cellobiase, which thus restricts the conversion of cellulosic materials to glucose [6].
Poor activity of cellobiase in cellulases produced by T.
reesei restricted the conversion of cellobiose to glucose, and
the accumulated cellobiose caused severe feedback in- hibition to the activities of β -1,4-endoglucanase and β- 1,4-exoglucanase in cellulase system [26]. Cellobiases hydro- lyzed β-glycosidic bonds between glucose and aryl or alkyl aglycone or olygosaccharides, which resulted in production of glucose and reduced inhibition of cellobiose and allowed enhanced functions of endoglucganase and exoglucanase [2, 27]. Supplementing cellobiase produced by Aspergillus niger greatly reduced the inhibitory effect caused by cellobiose, and the hydrolysis yield was improved to 83.9% with en- hanced cellobiase activity [5, 9, 32].
Enzymes produced by marine microorganisms can pro- vide numerous advantages over traditional enzymes due to the severe and wide range of environments [18, 20, 28].
Production of carboxymethylcellulase (CMCase) by a marine
bacterium, Cellulophaga lytica had been reported [10]. In this
study, the optimal conditions for the production of cellobiase
by C. lytica were established using response surface method-
ology [16, 25]. The optimization of culture medium by the
traditional “one-factor-at-a-time” method requires a consid-
erable amount of work and time. An alternative strategy is
a statistical approach, for example, RSM involving a mini-
mum number of experiments for a large number of factors [24].
Materials and Methods Production of cellobiase by C. lytica LBH-14
Starter cultures of C. lytica LBH-14 were prepared by transferring cells from agar slants to 50 ml of medium in 250 ml Erlenmeyer flasks [10]. The resulting cultures were incubated at 30℃ for 2 days under aerobic conditions. Each starter culture was used as an inoculum for 150 ml of me- dium in 500 ml Erlenmeyer flasks. The main culture was carried out in a medium containing 20 g/l carbon source, 2.5 g/l nitrogen source, 5.0 g/l K 2 HPO 4 , 1.0 g/l NaCl, 0.2 g/l MgSO 4 ·7H 2 O, and 0.6 g/l (NH 4 ) 2 SO 4 at 30℃ for 3 days under aerobic conditions. Batch fermentations for pro- duction of cellobiase by C. lytica LBH-14 were performed in a 100 l bioreactor (Ko-Biotech Co., Korea). Working vol- umes of 100 l bioreactors were 70 l and inoculum sizes of batch were 5% (v/v). Agitation was provided by three six-flat-blade impellers. Samples were periodically with- drawn from the cultures to examine cell growth and pro- duction of cellobiase.
Experimental design for optimization for production of cellobiase
The rice bran (X 1 ), ammonium chloride (X 2 ), and initial pH of the medium (X 3 ) were chosen as the independent vari- ables of the first experiment for optimization and cell growth (Y 1 ) and cellobiase (Y 2 ) were used as a dependent output variable. The interrelationships of the variables were de- termined by fitting the second degree polynomial equation to data obtained from 20 experiments using mean values of the triplicates of each experiment conducted trice at differ- ent occasions. The model constructed as a response function of the variables on cell growth and production of CMCase was a second-order polynomial as follows (Eq. 1).
Y = ß 0 + ∑ßi X i + ∑ß ii X i 2 + ∑ß ij X i X j (1) Where, Y is the measured response (cell growth as meas- ured dry cells weight or production of cellobiase), ß 0 , ß i , and ß ij are the regression coefficients, and X i and X j are the factors under study. For three variable systems, the model equation is given below (Eq. 2). Regression analysis and estimation of the coefficient were performed using the statistical soft- ware, Design-Expert (Version 7.1.6, Stat-Ease Inc.,
Minneapolis, USA). The contribution of individual parame- ters and their quadratic and interactive effects on cell growth and production of cellobiase were determined.
Y = ß 0 + ß 1 X 1 + ß 2 X 2 + ß 3 X 3 + ß 11 X 1 2 + ß 22 X 2 2 + ß 33 X 3 2
+ ß 12 X 1 X 2 + ß 13 X 1 X 3 + ß 23 X 2 X 3 (2) The K 2 HPO 4 (X 1 ), NaCl (X 2 ), MgSO4․7H 2 O (X 3 ), and (NH 4 ) 2 SO 4 (X 4 ) were also chosen as the independent varia- bles of the second experiment, and each variable was des- ignated as −1, 0, and 1, respectively. Cell growth (Y 1 ’ ) and cellobiase (Y 2 ’ ) were used as dependent output variables. For four variable systems, the model equation is given below (Eq. 3).
Y = ß 0 + ß 1 X 1 + ß 2 X 2 + ß 3 X 3 + ß 4 X 4 + ß 11 X 1 2 + ß 22 X 2 2
+ ß 33 X 3 2 + ß 44 X 4 2 + ß 12 X 1 X 2 + ß 13 X 1 X 3 + ß 14 X 1 X 4
+ ß 23 X 2 X 3 + ß 24 X 2 X 4 + ß 34 X 3 X 4 (3) Analytical methods
Dry cells weight was measured by directly weighing the biomass after drying to a constant weight at 100-105℃, after collection of cells by centrifugation at 12,000× g for 10 min.
Activity of cellobiase produced by C. lytica LBH-14 was de- termined based on the release of reducing sugar from cello- biose using the 3,5-dinitrosalicylic acid (DNS) method, as de- scribed in the previous report [15]. Glucose (Sigma-Aldrich, UK) was used to prepare a calibration curve. One unit of each cellulase was defined as the amount of enzyme that released 1µmol of reducing sugar equivalent to glucose per minute under the assay conditions.
Results and Discussion
Effect of carbon and nitrogen sources on production of cellobiase
The effect of carbon and nitrogen sources on cell growth
and the production of cellobiase by C. lytica LBH-14 was
investigated. Carbon sources tested for the production of cel-
lobiase were 20.0 g/l glucose, fructose, maltose, sucrose, rice
bran, and rice hulls. Nitrogen sources were 2.5 g/l malt ex-
tract, peptone, tryptone, yeast extract, ammonium chloride,
and ammonium nitrate. Initial pH of the medium and cul-
tural temperature were 6.8 and 30℃. Production of cello-
biase from 36 combinations with 6 carbon sources and 6 ni-
trogen sources ranged from 6.7 to 17.2 U/ml. Maltose and
tryptone were found to be the best combination of carbon
0 1 2 3
Malt extract Peptone Tryptone
Yeast extract A.C
A.N
co Glu ru seF se Ma cto seS lto ro uc ic seR ra e b
n Ric
ulls e h
D ry c e lls w
e ig h t (g /l )
itr N
og s en ou es rc
bo Car ou n s s rce
A
0 5 10 15 20 25
lt Ma tra ex ct
pto Pe ne
pto Try ne
as Ye xtr t e
t ac A.C
A.N
co Glu ru seF se Ma cto seS lto ro uc ic seR ra e b
n Ric
ulls e h
C e llo
b ia s e ( U /m
l)
itr N
og en ou s es rc
bo Car ou n s s rce
B
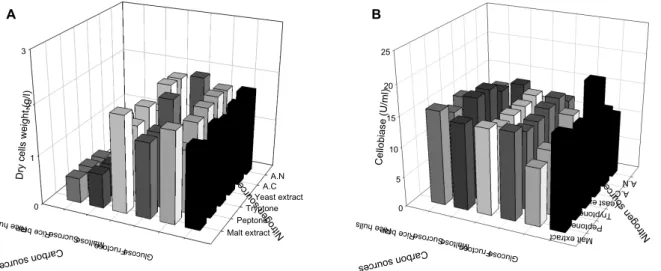
Fig. 1. Effect of carbon and nitrogen sources on cell growth (A) and production of cellobiase (B) by C. lytica LBH-14.
and nitrogen sources for cell growth of C. lytica LBH-14, whereas glucose and yeast extract were the best combination for production of CMCase, as shown in Fig. 1. However, a combination of rice bran and ammonium chloride was chosen for next examination based on their cost and availability. Cell mass and production of cellobiase from 20.0 g/l glucose and 2.5 g/l yeast extract were 1.51 g/l and 17.2 U/ml, whereas those from 20.0 g/l rice bran and 5.0 g/l ammonium chloride were 0.69 g/l and 10.1 U/ml.
The best carbon source for the production of cellobiase produced by Trichoderma reesei ZU-02 was cellulose, whereas those by Streptomyces sp. MDS were carboxymethylcellulose (CMC) and xylan [26, 30]. Wheat straw was reported to be the best carbon source for the production of cellobiase by Cellomons sp. [7]. The composition of the rice bran used in this study was as follows: 48.0% carbohydrate, 6.9% fiber, 14.9% crude lipid, 13.1% crude protein, 7.6% ash, and 9.5%
water. All strains investigated to date for production of cel- lulases are inducible by cellulose, lactose or sophorose, and repressible by glucose, which are reasons why the best car- bon sources for the production of cellulases by bacterial and fungal strains are rice hulls, rice bran or wheat bran [7, 8, 17, 19]. Induction, synthesis, and secretion of the β-glucanase appear to be closely associated [29].
Optimization of rice bran, ammonium chloride, and initial pH for production of cellobiase
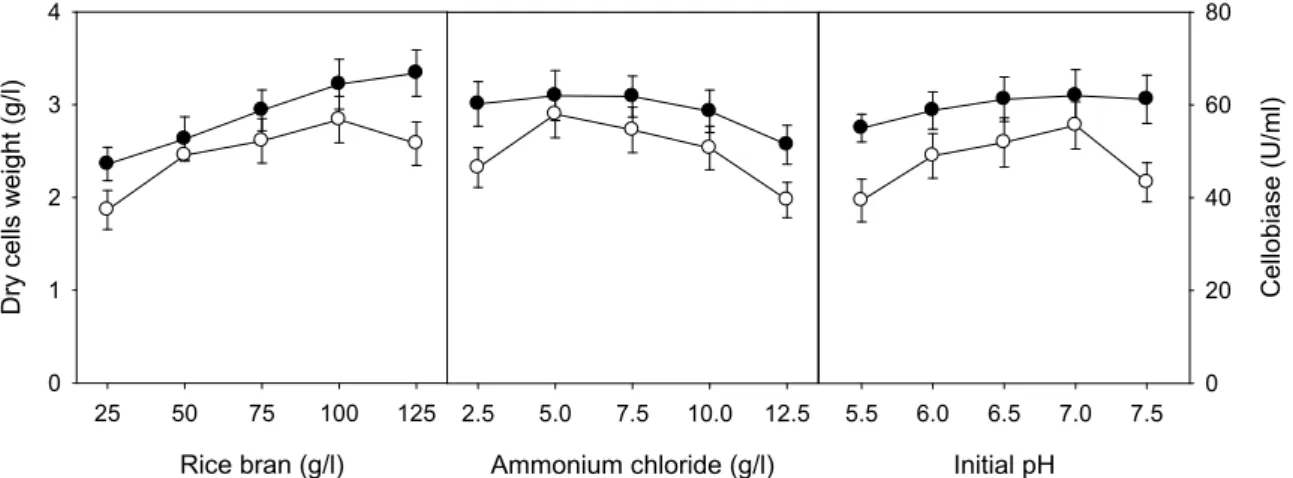
The effect of rice bran, ammonium chloride, and initial pH of the medium on cell growth and the production of cellobiase by C. lytica LBH-14 was investigated using
one-factor-at-a-time experiment. Concentrations of rice bran and ammonium chloride ranged from 25 to 125 g/l and from 2.5 to 12.5 g/l. The initial pH of the medium ranged from 5.5 to 7.5. Composition of basic medium and culture con- ditions were 75.0 g/l rice bran, 7.5 g/l ammonium chloride, initial pH of 6.5, and temperature of 30℃. The optimal con- ditions of rice bran, ammonium chloride, and initial pH for cell growth of C. lytica LBH-14 were 125.0 g/l, 5.0 g/l, and 7.5, respectively, whereas those for production of cellobiase were 100.0 g/l, 5.0 g/l, and 7.0, as shown in Fig. 2. The optimal conditions for cell growth of C. lytica LBH-14 were found to be different from those for production of cellobiase.
Based on results from one-factor-at-a-time experiment, the simultaneous effect of rice bran, ammonium chloride, and initial pH of the medium on cell growth and the production of cellobiase by C. lytica LBH-14 was investigated using re- sponse surface methodology (RSM). The coded values of minimum and maximum ranges of rice bran (X 1 ), ammo- nium chloride (X 2 ), and initial pH of the medium (X 3 ) were 50.0 and 100.0 g/l, 5.0 and 10.0 g/l, and 6.0 and 7.0, respectively. Cell mass, measured as dry cells weight (DCW), and production of cellobiase from 20 different con- ditions ranged from 2.36 to 3.16 g/l and from 45.6 to 62.2 U/ml, as shown in Table 1.
The model F-value of 23.45 from the analysis of variance
(ANOVA) of cell growth implied that this model was sig-
nificant, as shown in Table 2. There was only a 0.01% chance
that a “Model F-value” could occur to die to noise. The P
values were used as a tool to check the significance of each
of the coefficients, which, in turn were necessary to under-
Rice bran (g/l)
25 50 75 100 125
D ry c e lls w e ig h t (g /l )
0 1 2 3 4
Ammonium chloride (g/l) 2.5 5.0 7.5 10.0 12.5
Initial pH
5.5 6.0 6.5 7.0 7.5
C e llo b ia s e ( U /m l)
0 20 40 60 80
Fig. 2. Effect of rice bran, ammonium chloride, and initial pH of the medium on cell growth ( ● ) and production of cellobiase (○) by C. lytica LBH-14.
Table 1. Central composite design and determined response values (Y
1and Y
2were DCW and cellobiase, respectively)
Run X
1X
2X
3Y
1(g/l) Y
2(U/ml)
1 75.0 7.5 6.5 2.99 55.4
2 50.0 10.0 6.0 2.36 45.6
3 50.0 5.0 7.0 2.67 55.2
4 75.0 7.5 6.5 3.04 55.8
5 75.0 7.5 6.5 3.10 55.3
6 75.0 7.5 6.5 3.02 55.0
7 50.0 5.0 6.0 2.58 48.6
8 117.0 7.5 6.5 3.16 57.1
9 100.0 5.0 6.0 3.22 55.6
10 75.0 11.7 6.5 2.73 50.6
11 75.0 7.5 6.5 2.95 54.2
12 100.0 10.0 7.0 3.08 59.4
13 33.0 7.5 6.5 2.51 48.5
14 100.0 5.0 7.0 3.31 62.2
15 50.0 10.0 7.0 2.44 52.2
16 75.0 7.5 5.7 2.88 50.4
17 100.0 10.0 6.0 3.06 51.7
18 75.0 3.3 6.5 2.96 53.9
19 75.0 7.5 6.5 2.90 54.3
20 75.0 7.5 7.3 2.92 57.7
stand the pattern of the mutual interactions between the test variables. The smaller the magnitude of the P value, the more significant is the corresponding coefficient. The ANOVA indicated that this model and the model terms of X 1 and X 1 2 (“probe > F” less 0.0001) were highly significant and the model term of X 2 (“probe > F” less 0.0500) was sig- nificant for cell growth of C. lytica LBH-14. The regression equation obtained from ANOVA indicated that the multiple correlation coefficient of R 2 was 0.9511. The model can ex- plain 95.11% variation in the response. The value of the ad- justed determination coefficient (Adj. R 2 =0.9070) was very
high to advocate for a high significance of this model [18].
The predicted determination of coefficient of 0.8368 was in
reasonable agreement with the Adj. R 2 of 0.9070. From the
statistical results obtained, it was shown that the above mod-
els were adequate to predict the cell growth of C. lytica
LBH-14 within the range of variables studied. Multiple re-
gression analysis of the experimental data gave the follow-
ing second-order polynomial equation in terms of coded fac-
tors (Eq. 4). The optimal conditions of rice bran, ammonium
chloride, and initial pH of the medium for cell growth ex-
tracted by Design Expert Software were 100.0 g/l, 5.00 g/l,
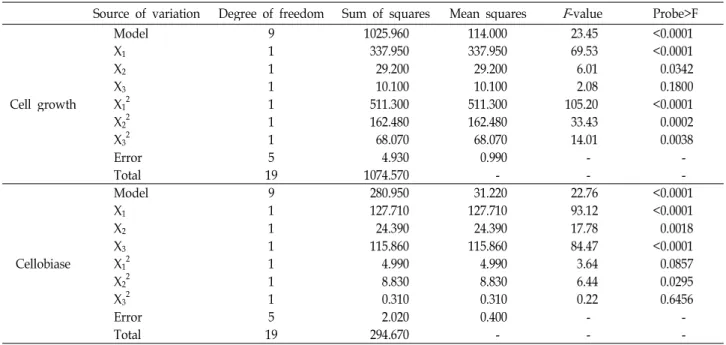
Table 2. Parameter estimates and analysis of variance (ANOVA) of the design for cell growth production of cellobiase by C. lytica LBH-14
Source of variation Degree of freedom Sum of squares Mean squares F -value Probe>F
Cell growth
Model 9 1025.960 114.000 23.45 <0.0001
X
11 337.950 337.950 69.53 <0.0001
X
21 29.200 29.200 6.01 0.0342
X
31 10.100 10.100 2.08 0.1800
X
121 511.300 511.300 105.20 <0.0001
X
221 162.480 162.480 33.43 0.0002
X
321 68.070 68.070 14.01 0.0038
Error 5 4.930 0.990 - -
Total 19 1074.570 - - -
Cellobiase
Model 9 280.950 31.220 22.76 <0.0001
X
11 127.710 127.710 93.12 <0.0001
X
21 24.390 24.390 17.78 0.0018
X
31 115.860 115.860 84.47 <0.0001
X
121 4.990 4.990 3.64 0.0857
X
221 8.830 8.830 6.44 0.0295
X
321 0.310 0.310 0.22 0.6456
Error 5 2.020 0.400 - -
Total 19 294.670 - - -
and 7.0, respectively. The maximum cell growth of 3.15 g/l was predicted by this model.
Y 1 = 3.05 + 0.09X 1 –0.02X 2 + 0.02X 3 –0.01X 1 X 2
+ 0.01X 1 X 3 –0.01X 2 X 3 –0.02X 1 2 –0.01X 2 2 –0.02X 3 2 (4) The model F-value of 22.76 from the ANOVA of pro- duction of cellobiase implied that this model was also significant. The ANOVA indicated that this model and the model terms of X 1 and X 3 were highly significant and those of X 2 and X 2 2 were significant for the production of cellobiase by C. lytica LBH-14. The regression equation obtained from ANOVA indicated that the multiple correlation coefficient of R 2 was 0.9698. The value of the adjusted determination coefficient (Adj. R 2 =0.9426) was high to advocate for a high significance of this model. The predicted determination of coefficient of 0.8621 was also in reasonable agreement with the Adj. R 2 of 0.9426. Multiple regression analysis of the ex- perimental data gave the following second-order polynomial equation in terms of coded factors (Eq. 5). The optimal con- ditions of rice bran, ammonium chloride, and initial pH of the medium for production of cellobiase were 91.1 g/l, 9.02 g/l, and 6.6, respectively. The maximum production of cello- biase of 55.6 U/ml was predicted by this model.
Y 2 = 54.61 + 0.88X 1 + 1.62X 2 + 0.93X 3 + 0.04X 1 X 2 + 0.14X 1 X 3
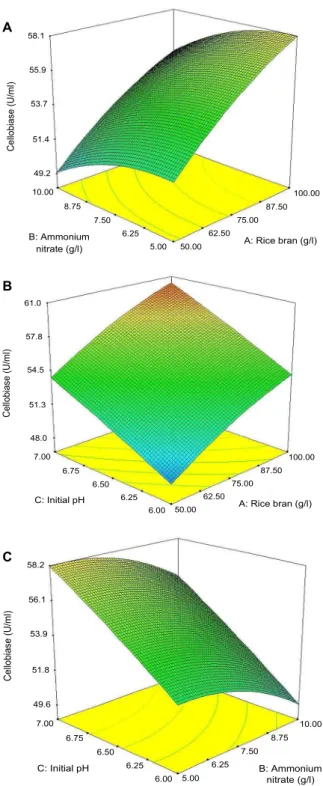
+ 0.01X 2 X 3 –0.64X 1 2 –1.22X 2 2 –1.10X 3 2 (5) The three-dimensional response surface was generated to
study the interaction among three factors tested and to visu- alize the combined effects of factors on the response of the production of cellobiase by C. lytica LBH-14, as shown Fig.
3. When the effect of two factors was plotted, the other two factors were set at the coded value zero, which were 75.0 g/l rice bran, 7.5 g/l ammonium chloride, and initial pH of 6.5. This kind of graphical visualization allows the rela- tionships between the experimental levels of each factor and the response to be investigated, and the type of interactions between test variables to be determined, which is necessary to establish the optimal conditions for production of cellobiase. In contrast to the circular shapes, the elliptical nature of curves indicates more significant mutual inter- actions between variables. The most significant combination of variables on production of cellobiase was rice bran and initial pH (“Probe > F”=0.4946). P value of combined effect of rice bran and ammonium chloride was 0.8506 and that of ammonium chloride and initial pH was 0.9499.
Optimization of salts in medium for production of cellobiase
The optimal concentrations of salts in the medium for cell growth and the production of cellobiase by C. lytica LBH-14 were also investigated using one-factor-at-a-time experiments.
Carbon and nitrogen sources and initial pH of the medium
were 91.1 g/l rice bran, 9.02 g/l ammonium chloride and
6.6, which were previously optimized in this study.
C e llo b ia s e (U /m l)
58.155.9
53.7
51.4
49.2
10.00 8.75
7.50 6.25
5.00 50.00 62.50
75.00 87.50
100.00
B: Ammonium
nitrate (g/l) A: Rice bran (g/l)
A
C e llo b ia se (U /m l)
61.0
57.8
54.5
51.3
48.0
7.00 6.75
6.50 6.25
6.00 50.00 62.50
75.00 87.50
100.00
C: Initial pH A: Rice bran (g/l)
B
C e llo b ia se (U /m l)
58.2
56.1
53.9
51.8
49.6
7.00 6.75
6.50 6.25
6.00 5.00 6.25
7.50 8.75
10.00
C: Initial pH B: Ammonium
nitrate (g/l)
C
Fig. 3. Three-dimensional response surface of production of cel- lobiase by C. lytica LBH-14 as functions of rice bran and ammonium chloride (A), rice bran and initial pH (B), and ammonium chloride and initial pH (C).
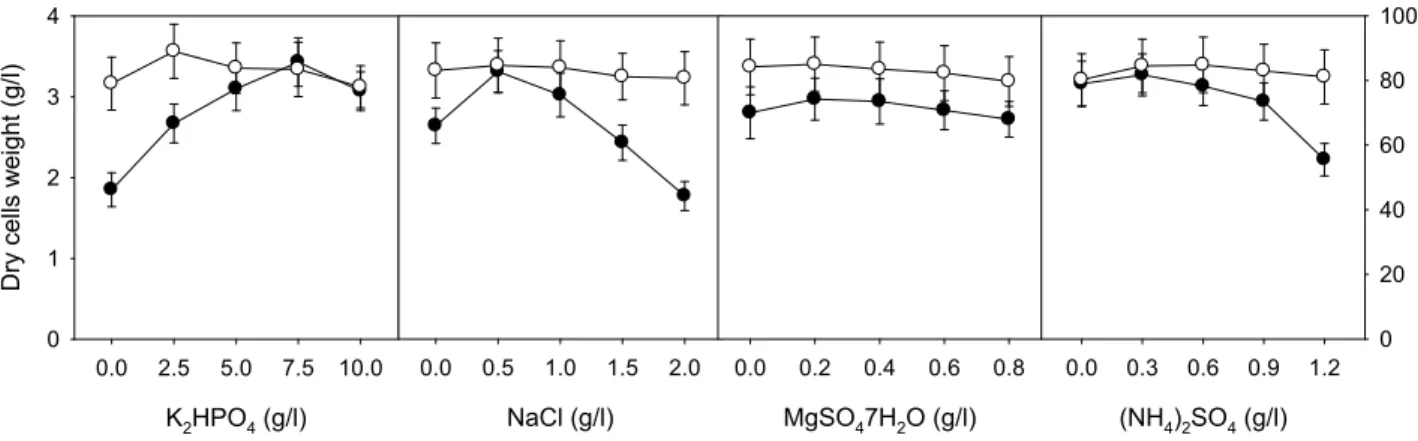
Concentrations of K 2 HPO 4 , NaCl, MgSO 4 ․7H 2 O, and (NH 4 ) 2 SO 4 ranged from 0.0 to 10.0 g/l, from 0.0 to 2.0 g/l, from 0.0 to 0.8 g/l, and from 0.0 to 1.2 g/l, respectively.
Concentrations of K 2 HPO 4 , NaCl, MgSO 4 ․7H 2 O, and (NH 4 ) 2 SO 4 in the basic medium were 5.0, 1.0, 0.4, and 0.6
g/l, respectively. The optimal concentrations of K 2 HPO 4 , NaCl, MgSO 4 ․7H 2 O, and (NH 4 ) 2 SO 4 for cell growth of C.
lytica LBH-14 were 7.5, 0.5, 0.2, and 0.3 g/l, respectively, whereas those for production of cellobiase were 2.5, 0.5, 0.2, and 0.6 g/l, as shown in Fig. 4. The optimal concentrations of salts in the medium for cell growth were also different from those for production of cellobiase. Based on results from one-factor-at-a-time experiment, the optimal concen- trations of salts in the medium for cell growth and the pro- duction of cellobiase by C. lytica LBH-14 were also inves- tigated using RSM. The coded values of minimum and max- imum ranges of K 2 HPO 4 (X 1 ), NaCl (X 2 ), MgSO 4 ․ 7H2 O (X 3 ), and (NH 4 ) 2 SO 4 (X 4 ) were 2.5 and 7.5 g/l, 0.25 and 0.75 g/l, 0.25 and 0.75 g/l, and 0.3 and 0.9 g/l, respectively. Cell mass and production of cellobiase from 30 different conditions ranged from 2.79 to 3.17 g/l, from 82.1 to 84.6 U/ml, as shown in Table 3.
The model F-value of 9.88 from the ANOVA of cell growth implied that this model was significant, as shown in Table 4. The ANOVA indicated that this model and the model terms of X 1 2 and X 3 2 were highly significant (“probe
> F” less 0.0001) and those of X 1 , X 2 , X 3 , X 4, X 2 2 and X 4 2 were significant (“probe > F” less 0.0500) for cell growth of C.
lytica LBH-14. The regression equation obtained from ANOVA indicated that the multiple correlation coefficient of R 2 was 0.9021. The value of the adjusted determination coefficient (Adj. R 2 =0.8108) was very high to advocate for a high significance of this model. The predicted determi- nation of coefficient of 0.5141 was in reasonable agreement with the Adj. R 2 of 0.8108. Multiple regression analysis of the experimental data gave the following second-order poly- nomial equation in terms of coded factors (Eq. 6). The opti- mal concentrations of K 2 HPO 4 , NaCl, MgSO 4 ․ 7H2 O, and (NH 4 ) 2 SO 4 for cell growth were 6.25, 0.62, 0.28, and 0.42 g/l, respectively. The maximum cell growth of 3.57 g/l was pre- dicted by this model.
Y 1 ’ = 3.56 + 0.01X 1 +0.01X 2 –0.01X 3 –0.01X 4 –0.01X 1 2
–0.01X 2 2 –0.01X 3 2 –0.01X 4 2 (6)
The model F-value of 13.87 from the ANOVA of pro-
duction of cellobiase implied that this model was also
significant. The ANOVA indicated that this model and the
model terms of X 2 , X 3 , and X 1 2 were highly significant and
that of X 4 , X 2 2 , X 3 2 , and X 4 2 were significant for then pro-
duction of cellobiase by C. lytica LBH-14. The regression
equation obtained from ANOVA indicated that the multiple
K
2HPO
4(g/l) 0.0 2.5 5.0 7.5 10.0
D ry c e lls w e ig h t (g /l )
0 1 2 3 4
NaCl (g/l) 0.0 0.5 1.0 1.5 2.0
MgSO
47H
2O (g/l) 0.0 0.2 0.4 0.6 0.8
(NH
4)
2SO
4(g/l) 0.0 0.3 0.6 0.9 1.2
C e llo b ia s e ( U /m l)
0 20 40 60 80 100
Fig. 4. Effect of K
2HPO
4, NaCl, MgSO4․7H
2O, and (NH
4)
2SO
4on cell growth ( ● ) and production of cellobiase (○) by C. lytica LBH-14.
Table 3. Central composite design and determined response values (Y
1and Y
2were DCW and cellobiase, respectively)
Run X
1X
2X
3X
4Y
1(g/l) Y
2(U/ml)
1 2.5 0.25 0.3 0.3 2.89 83.9
2 7.5 0.25 0.3 0.9 3.00 83.1
3 5.0 0.50 0.2 0.6 3.10 84.1
4 7.5 0.75 0.3 0.3 3.25 83.0
5 2.5 0.75 0.1 0.9 2.97 83.7
6 5.0 0.50 0.0 0.6 3.06 84.1
7 5.0 1.00 0.2 0.6 3.10 83.9
8 5.0 0.50 0.2 0.6 3.15 84.3
9 2.5 0.75 0.3 0.9 2.98 83.5
10 5.0 0.50 0.2 0.6 3.17 84.5
11 7.5 0.25 0.1 0.9 2.98 83.3
12 7.5 0.75 0.1 0.9 3.16 83.0
13 2.5 0.75 0.1 0.3 3.05 83.8
14 2.5 0.25 0.1 0.9 2.79 84.0
15 5.0 0.50 0.2 0.6 3.18 84.4
16 2.5 0.25 0.3 0.9 2.81 83.8
17 5.0 0.50 0.2 0.6 3.09 84.0
18 5.0 0.00 0.2 0.6 2.96 84.1
19 5.0 0.50 0.2 1.2 2.88 83.3
20 5.0 0.50 0.4 0.6 3.07 84.6
21 7.5 0.75 0.3 0.9 3.17 82.8
22 7.5 0.25 0.1 0.3 3.07 83.4
23 7.5 0.75 0.1 0.3 3.24 83.1
24 2.5 0.25 0.1 0.3 2.88 84.1
25 2.5 0.75 0.3 0.3 3.06 83.7
26 5.0 0.50 0.2 0.6 3.12 83.9
27 7.5 0.25 0.3 0.3 3.08 83.2
28 5.0 0.50 0.2 0.0 3.11 83.0
29 0.0 0.50 0.2 0.6 2.79 83.1
30 10.0 0.50 0.2 0.6 3.10 82.1
correlation coefficient of R 2 was 0.9021. The value of the ad- justed determination coefficient (Adj. R 2 =0.8108) was very high to advocate for a high significance of this model. The predicted determination of coefficient of 0.5141 was in rea-
sonable agreement with the Adj. R 2 of 0.8108. Multiple re-
gression analysis of the experimental data gave the follow-
ing second-order polynomial equation in terms of coded fac-
tors (Eq. 7). The optimal concentrations of K 2 HPO 4 , NaCl,
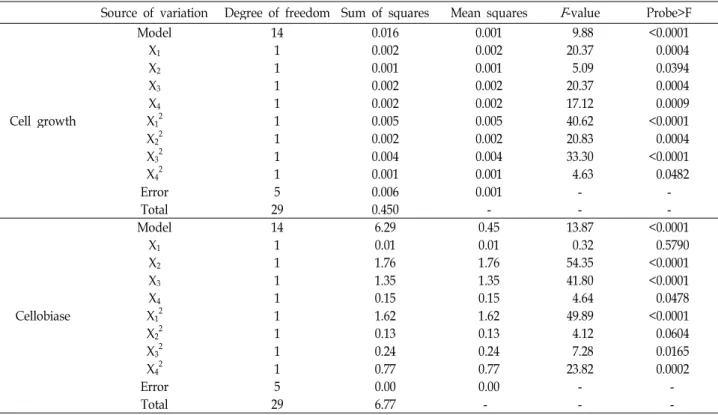
Table 4. Parameter estimates and analysis of variance (ANOVA) of the design for cell growth and production of cellobiase by C. lytica LBH-14
Source of variation Degree of freedom Sum of squares Mean squares F -value Probe>F
Cell growth
Model 14 0.016 0.001 9.88 <0.0001
X
11 0.002 0.002 20.37 0.0004
X
21 0.001 0.001 5.09 0.0394
X
31 0.002 0.002 20.37 0.0004
X
41 0.002 0.002 17.12 0.0009
X
121 0.005 0.005 40.62 <0.0001
X
221 0.002 0.002 20.83 0.0004
X
321 0.004 0.004 33.30 <0.0001
X
421 0.001 0.001 4.63 0.0482
Error 5 0.006 0.001 - -
Total 29 0.450 - - -
Cellobiase
Model 14 6.29 0.45 13.87 <0.0001
X
11 0.01 0.01 0.32 0.5790
X
21 1.76 1.76 54.35 <0.0001
X
31 1.35 1.35 41.80 <0.0001
X
41 0.15 0.15 4.64 0.0478
X
121 1.62 1.62 49.89 <0.0001
X
221 0.13 0.13 4.12 0.0604
X
321 0.24 0.24 7.28 0.0165
X
421 0.77 0.77 23.82 0.0002
Error 5 0.00 0.00 - -
Total 29 6.77 - - -
MgSO 4 ․7H 2 O, and (NH 4 ) 2 SO 4 for production of cellobiase were 4.16, 0.36, 0.27, and 0.73 g/l, respectively. The max- imum production of cellobiase of 84.4 U/ml was predicted by this model.
Y 2 ’ = 82.8 + 0.45X 1 –2.45X 2 + 1.08X 3 + 3.60X 4 + 0.05X 1 · X 2
+ 0.01X 1 · X 3 –0.13X 1 · X 4 +0.70X 2 · X 3 –0.580.01X 2 · X 4
–0.04X 1 2 + 1.12X 2 2 –1.48X 3 2 –1.86X 4 2 (7) Analysis using the statistical method indicated that the most significant factor for cell growth was K 2 HPO 4 . However, that for production of cellobiase was NaCl and MgSO 4 ․7H 2 O. Potassium phosphate is one of major salts in the medium for productions of microbial polysaccharides and enzymes as well as a well-known ingredient in buffer solutions [13, 23]. Sodium chloride was reported to be used as a physiological modulator of biosynthetic pathway of bio- polymers [12, 24]. Magnesium sulfate added to media assists with spore germination and initial growth of A. fisheri, which results in 1.9 fold increased production of xylanase [31].
Sulphur starvation affected the level of proteins more than nitrogen deprivation, which was coupled with the accumu- lation of glutamine, asparagine and serine, additionally, a decrease in both glutathione and cysteine levels [4].
Effect of temperature on production of cellobiase
The effect of temperature on cell growth and the pro- duction of cellobiase by C. lytica LBH-14 was examined.
Carbon and nitrogen sources and initial pH of the medium were 91.0 g/l rice bran, 9.02 g/l ammonium chloride and 6.6. And concentrations of K 2 HPO 4 , NaCl, MgSO 4 ․7H 2 O, and (NH 4 ) 2 SO 4 were 4.16, 0.36, 0.27, and 0.73 g/l, respectively, which were optimized in this study. The temperature for cell growth and production of cellobiase ranged from 20 to 40℃. The optimal temperature for cell growth of C. lytica LBH-14 was found to be 35℃, whereas those for production of cellobiase were 25℃, as shown in Fig. 5. The cell growth and production of cellobiase at 35℃ were 3.18 g/l and 79.3 U/ml, whereas those at 25℃ were 2.45 g/l and 91.7 U/ml.
The optimal temperatures for the production of cellobiase by A. niger was 30℃ and those for the production of filter paperase (FPase) by T. reesei QM9414 and T. reesei MCG77 from rice bran in solid-state fermentation were 30 and 25℃, respectively [1, 21]. The optimal temperature for production of CMCase by C. lytica LBH-14 had been reported to be 25℃
[10]. The optimal temperature for production of cellobiase was the same as that of CMCase by C. lytica LBH-14.
However, those of cellobiase and CMCase were different
Table 5. Comparison of optimal conditions using two experimental methods for cell growth and production of cellobiase by C.
lytica LBH-14
Scale Optimal conditions One factor at a time experiment Response surface method
DCW Cellobiase DCW Cellobiase
Flask scale 1
Rice bran (g/l) 125 100 100.0 91.1
Ammonium nitrate (g/l) 5.0 5.0 5.00 9.02
Initial pH 7.0 7.0 7.0 6.6
Maximal production 3.84 g/l 58.0 U/ml 3.15 g/l 55.6 U/ml
Flask scale 2
K
2HPO
4(g/l) 7.5 2.5 6.25 4.16
NaCl (g/l) 0.5 0.5 0.62 0.36
MgSO4․7H
2O (g/l) 0.2 0.2 0.28 0.27
(NH
4)
2SO
4(g/l) 0.3 0.6 0.42 0.73
Maximal production 3.43 g/l 84.8 U/ml 3.57 g/L 84.4 U/ml
Flask scale 3
Temperature (℃) 35 25 - -
Maximal production 3.18 g/l 91.7 U/ml - -
Temperature (
oC)
25 30 35 40 45
D ry c e lls w e ig h t (g /l )
0 1 2 3 4
c e llo b ia s e ( U /m l)
0 30 60 90 120
c
b b
a
ab a a
a b
c
Fig. 5. Effect of temperature on cell growth and production of cellobiase by C. lytica LBH-14 ( ■ , DCW and □ , cello- biase).
from that for cell growth of C. lytica LBH-14. The optimal temperatures for cell growth of B. amyloliquefaciens and B.
subtilis subsp. subtilis were 32 and 35℃, respectively, where- as those for production of CMCase were 37 and 30℃, re- spectively [14, 22].
Mass production of cellobiase under optimized conditions
Batch culture for the production of cellobiase by C. lytica LBH-14 was performed in a 100 l bioreactor under optimized conditions in this study. Carbon and nitrogen source was 91.1 g/l rice bran and 9.02 g/l ammonium chloride. The ini- tial pH and cultural temperature were 6.6 and 25℃.
Agitation speed and aeration rate of a 100 l bioreactor were 200 rpm and 1.0 vvm. The pH in the medium dramatically decreased until 30 h of cultivation, and then gradually
Time (h)
0 12 24 36 48 60 72
pH
5.0 5.5 6.0 6.5
DO (%)
0 20 40 60 80 100
Dry cells weight (g/l)
0 1 2 3 4 5
cellobiase (U/ml)
0 30 60 90 120 150
Fig. 6. Pilot-scaled production of cellobiase by C. lytica LBH-14 in a 100 l bioreactor ( ● , pH; ■ , DO; ▲ , DCW; and ○, cellobiase).
increased at approximately 6.3 thereafter, as shown in Fig.
6. Decrease in pH might result from accumulated production of organic acids from substrates in the medium, which were used as precursors for biosynthetic pathway for cell growth.
Dissolved oxygen in the medium also dramatically decreased until 18 h and gradually increased after 42 h. Cell growth of C. lytica LBH-14 rapidly increased until 30 h.
Production of cellobiase started after a dramatic decrease in the concentration of dissolved oxygen at 9 h. The production of cellobiase by C. lytica LBH-14 appeared to be paralleled with cell growth.
A major constrain in enzymatic saccharification of cellu- losic materials for fermentable sugars is the cost of cellu- lases and low productivity [33]. Corncob had been used for production of cellobiase, but cost for pretreatment of corn- cob was too expensive to apply commercially [32].
Production of cellobiase from many forms of lignocellulo-
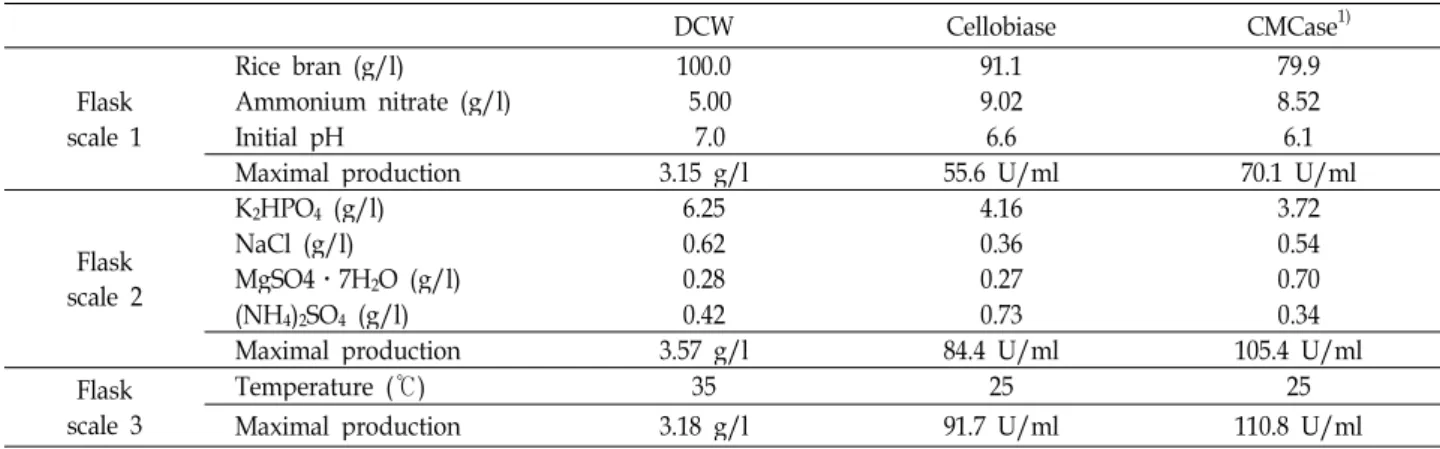
Table 6. Comparison of optimal conditions for cell growth and production of cellobiase and CMCase by C. lytica LBH-14
DCW Cellobiase CMCase
1)Flask scale 1
Rice bran (g/l) 100.0 91.1 79.9
Ammonium nitrate (g/l) 5.00 9.02 8.52
Initial pH 7.0 6.6 6.1
Maximal production 3.15 g/l 55.6 U/ml 70.1 U/ml
Flask scale 2
K
2HPO
4(g/l) 6.25 4.16 3.72
NaCl (g/l) 0.62 0.36 0.54
MgSO4․7H
2O (g/l) 0.28 0.27 0.70
(NH
4)
2SO
4(g/l) 0.42 0.73 0.34
Maximal production 3.57 g/l 84.4 U/ml 105.4 U/ml
Flask scale 3
Temperature (℃) 35 25 25
Maximal production 3.18 g/l 91.7 U/ml 110.8 U/ml
1)