• 검색 결과가 없습니다.

Isolation and Identification of Lipolytic Enzyme Producing Pseudomonas sp. OME and Optimization of Cultural Conditions

N/A
N/A
Protected

Academic year: 2021

Share "Isolation and Identification of Lipolytic Enzyme Producing Pseudomonas sp. OME and Optimization of Cultural Conditions"

Copied!
8
0
0

로드 중.... (전체 텍스트 보기)

전체 글

(1)

Isolation and Identification of Lipolytic Enzyme Producing Pseudomonas sp.

OME and Optimization of Cultural Conditions

G. Satheesh kumar

1,2

*, T. Kiran Reddy

2

, B. Madhavi

2

, P. Charan Teja

2

, M. Subhosh Chandra

3

and Yong Lark Choi

3

*

1

Department of Microbiology, Acharya Nagarjuna University, Nagarjuna nagar 522-510, Guntur, India

2

Department of Virology, Sri Venkateswara University, Tirupati 517-502, India

3

Department of Biotechnology, College of Natural Resources and Life Science, Dong-a University 840, Hadan-Dong, Saha-gu, Busan 604-714, Korea Received February 16, 2010 /Accepted April 15, 2010

Lipolytic enzyme-producing bacteria were isolated from edible oil mill effluents on tributyrin agar medium. The shake-flask-scale studies yielded a promising isolate and it was identified as Pseudomonas sp. An OME using various microbiological observations such as cultural, microscopic, and biochemical tests was undertaken and confirmed using PIBWIN bacterial identification software. Lipolytic enzyme production was screened with oils such as sunflower, caster, coconut, tributyrin, and olive. Amongst these, olive oil showed an increased lipase production 6.1 U/ml. In view of the highest lipolytic en- zyme production with olive oil, further optimizations were carried out using olive oil as a carbon source. Lipolytic enzyme production was optimized by a conventional ‘one variable at a time’ ap- proach and the significant factors were further analyzed statistically using response surface method- ology (RSM). The effect of physical factors such as incubation time, temperature, initial medium pH, and nutritional factors such as concentration of olive oil and yeast extract were examined for lipase production. Lipolytic enzyme secretion was strongly affected by three variables (incubation time, con- centration of yeast extract and olive oil). Therefore, the interaction of these three factors was further optimized using response surface methodology. The optimized conditions of lipase production using response surface methodology yielded a maximum of 9.62 U/ml with optimum conditions for in- cubation, yeast extract and olive oil concentrations were found to be 48 hr, 0.3 g. and 0.9 ml. respectively.

Key words : Oil mill effluents (OME), isolation, lipolytic enzyme, identification, Pseudomonas sp. OME, RSM, optimization

*Corresponding author Phone: +91-970-104-2538 E-mail: [email protected]

Phone: +82-51-200-7585; Fax: +82-51-200-6536 E-mail: [email protected]

Introduction

Historically, the selection of microorganisms that produce exoenzymes has been empirical, starting with samples from very diverse environmental sources. Lipases are ubiquitous in nature and are produced by various plants, animals and microorganisms. Lipases of microbial origin, mainly bacte- rial and fungal, represent the most widely used class of en- zymes in biotechnological applications and organic chemistry.

Microbial lipases have been the subject of many important studies because of their availability and the large number of reactions they catalyze. Lipases (E.C. 3.1.1.3) are enzymes that are primarily responsible for the hydrolysis of acylglycerides. The industrial importance is the hydrolysis of vegetable oils, such as olive oil or coconut oil, to produce

fatty acids and glycerol, both of which find widespread ap-

plications, especially in soaps and detergents, others such

as in cosmetics, pharmaceuticals, food, organic synthesis,

dairy, fat and oil modification [1,8,15,17,22]. Most research

has concentrated on extracellular lipases that are produced

by many different microbial species. Although a number of

lipase-producing bacterial sources are available, only a few

are commercially exploited as wild or recombinant strains

[9,18]. The potent isolates of the genus belonging to

Achromobacter, Alcaligenes, Arthrobacter, Bacillus, Burkholderia,

Chromobacterium and Pseudomonas are most extensively used

for lipase porudction [9]. Of these, the lipases from

Pseudomonas bacteria are widely used for a variety of bio-

technological applications [2,9,19]. The synthesis and secre-

tion of lipases by bacteria is influenced by a variety of envi-

ronmental factors like ions, carbon sources, or presence of

non-metabolizable polysaccharides. The secretion pathway

is known for Pseudomonas lipases with P. aeruginosa lipase

using a two-step mechanism and P. fluorescens lipase using

(2)

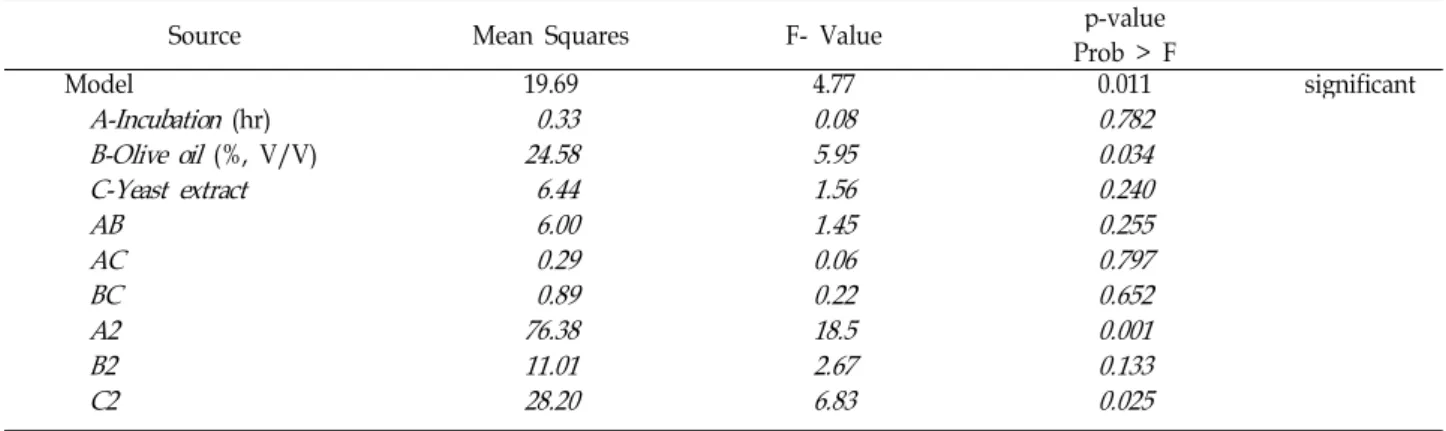
a one-step mechanism [9]. Optimization of cultivation con- ditions is expected to improve the enzyme production. In order to attain higher enzyme titres, a number of factors need to be optimized, including a suitable organism and the process [10,12]. The optimization of physical and nutritional factors for submerged and solid state enzyme production is an important problem in the development of economically feasible bioprocesses. Combinatorial interactions of medium components with the production of the desired enzyme are numerous and the optimum processes may be developed using an effective experimental design procedure. RSM which is a collection of statistical techniques for designing experiments, building models, evaluating the effects of fac- tors and searching for the optimum conditions, has success- fully been used in the optimization of bioprocesses [4,5,6,11,20,26]. The goal of present study is to achieve a high level of lipolytic enzyme lipase production by newly isolated promising Pseudomonas sp. OME by optimization of physical and nutritional factors using a statistical experimental design.

Materials and Methods

Screening and selection of high lipase producing bacterial isolate

Lipolytic bacteria were isolated from oil mill effluents around Tirupati, India. The ability to produce extracellular lipase was determined by culturing the bacterial isolates on tributyrin agar medium at 37

o

C for 24-48 hr [13]. A total of 9 bacterial colonies were selected (designated as OME i.e.

oil mill effluent I to IX) and tested for enzyme production in shake-flask-scale studies.

Fermentation

The liquid broth (yeast extract 2.5 g/l, K

2

HPO

4

1.0 g/l, MgSO

4

.7H

2

O 0.05 g/l) was amended with olive oil (1%, v/v) and the final pH adjusted to 7.0. The 50 ml liquid broth me- dium was prepared in 250 ml Erlenmeyer flask and autoclaved at 121

o

C for 15 min. The 5 hr old cultures (0.2 OD

600 nm

) in- oculated at 5% (v/v) and the flasks were incubated at 30

o

C for 48 hr with 120 rpm in an orbital shaking incubator.

Measurement of bacterial growth and assay of lipase activity

The bacterial growth in the fermented broth medium was determined using a spectrophotometer at 600 nm. The lipase

activity in the fermented broth medium was measured by centrifugation of fermented culture at 10,000 rpm for 15 min at 4

o

C and the crude centrifugal supernatant was used as enzyme source. Determination of lipase activity was done by the titrimetric method [14,16]. The emulsion of olive oil (10%, v/v) was prepared in arabic gum (5%) in sodium phosphate buffer (0.1 mol/l pH 7.0). The assay mixture con- tained 2 ml of emulsified olive oil as substrate and appropri- ately diluted enzyme in phosphate buffer (0.1 M, pH 7.0) at 50°C for 30 min and the enzyme activity was stopped immediately by incubating into boiling water bath for 3 min.

Phenolpthalein indicator added to the hydrolyzed mixture and titrated against 0.05 M NaOH solution. One unit of li- pase activity was defined as 1.0 µmol of fatty acid liberated per min.

Statistical analysis

Data presented are the averages of three replicates. The statistical analysis for standard deviation was carried out us- ing Instat+v3.33 and SPSS 10.0 soft-ware packages.

Identification of bacterial isolate

Amongst the primary isolates, the promising one selected by plate assay and shake flask culture was used for identification. The selected promising bacterial culture used for preliminary microbiological studies such as cultural, mi- croscopic and biochemical observations.

Optimization of lipase production by ‘one variable at a time’

The factors were studied by modifying the medium com-

position according to the conditions and factors, which were

studied. The effect of different oils such as sun flower, caster,

coconut, tributyrin and olive on lipase production was

screened in shake-flask-scale culture studies by supplement-

ing oils at 1% to the liquid medium and the enzyme ex-

traction and assay carried out as described above. The effect

of different physical and nutritional factors for lipase pro-

duction by Pseudomonas sp. OME was investigated by cultur-

ing in liquid broth supplemented with 1% olive oil at 30

o

C

under shaking condition, during cultivation lipase activity

was monitored. The effect of incubation period on lipase

production was observed at regular 12 hr interval, over a

period of 72 hr. In the view of maximum lipase production

with olive oil at 48 hr of incubation, further optimizations

were carried out at this point. The effect of incubation tem-

(3)

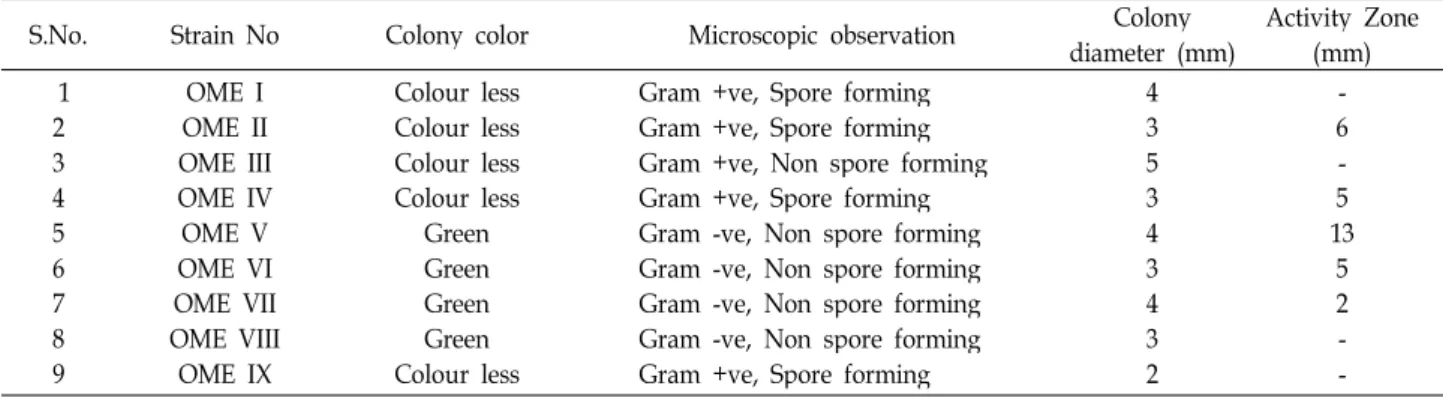
Table 1. The colony, microscopic and plate assay characteristics of selected bacterial isolates for lipase production

S.No. Strain No Colony color Microscopic observation Colony

diameter (mm) Activity Zone (mm) 1

2 3 4 5 6 7 8 9

OME I OME II OME III OME IV OME V OME VI OME VII OME VIII OME IX

Colour less Colour less Colour less Colour less

Green Green Green Green Colour less

Gram +ve, Spore forming Gram +ve, Spore forming Gram +ve, Non spore forming Gram +ve, Spore forming Gram -ve, Non spore forming Gram -ve, Non spore forming Gram -ve, Non spore forming Gram -ve, Non spore forming Gram +ve, Spore forming

4 3 5 3 4 3 4 3 2

- 6 - 5 13 5

2 - - perature from 30-50

o

C and the effect of initial medium pH

was determined by preparing the Luria broth medium in buffer solution (0.1 M) from 4-8. The effect nutritional factors such as concentration of olive oil (0.3-1.6) and yeast extract (0.1-0.5) on lipase production was screened.

Experimental design using RSM

The significant factors influencing lipase production from

‘one variable at a time’ method was further optimized by RSM. Three factors selected from ‘one variable at a time’

approach, were further optimized and used in designing the experiment: Incubation time (A), Olive oil (B) and Yeast ex- tract concentration (C). The ranges of the variables inves- tigated in this study are given in Table 4. A central compo- site quadratic design containing 20 experiments (20 runs) was generated using Design-Exeper

®

software (7.1.6 ver- sion), lipase production was taken as an independent varia- ble or response.

The results of RSM were used to fit a second order plynominal equation (1) as it represents the behaviour of response [12].

Y=β

o

1

A+β

2

B+β

3

C+β

1

β

1

A

2

2

β

2

B

2

3

β

3

C

2

1

β

2

AB+β

1

β

3

AC+β

2

β

3

BC (1) Y=response variable, β

o

=intercept, β

1,

β

2,

β

3,

=linear coeeficients, β

1

β

1

, β

2

β

2

, β

3

β

3

=Suqared coeeficients, β

1

β

2

, β

1

β

3

, β

2

β

3

=interaction coeficients, and A, B, C, A

2

, B

2

, C

2

, AB, AC, BC=level of independent variables.

Results and Discussion

Screening, selection and identification of potent bacterial isolate

The bacterial isolates used in this study were isolated from oil mill effluent samples. The bacterial cultures were

grown on tributyrin agar medium 24-48 hr at 30
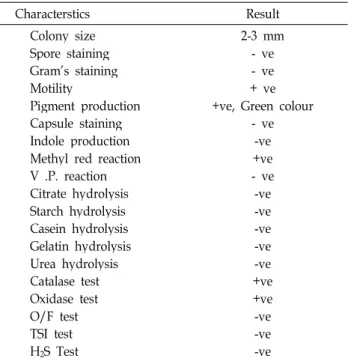
o

C and the formation of clear hydrolysis zone gave an indication of lip- olytic enzyme producing cultures (Fig. 1). Amongst 9 iso- lates selected and they were designated as OME (oil mill effluent) I to OME IX. The cultural, microscopic and plate assay characteristics of lipolytic enzyme producing bacterial isolates were given in Table 1. The flask scale culture studies resulted one of the promising bacterial isolate (OME V) with lipase production 5.6 U/ml and it was used for further stud- ies (Fig. 2). The selected bacterial isolate was identified by cultural, microscopic and biochemical tests as Pseudomonas sp. OME using PIBWIN (Probabilistic Identification of Bacteria for Windows) bacterial identification software with identification score 64%, the results of these observations are given in Table 2 [3].

Optimized conditions by ‘One variable at time method’

The results of lipase production and bacterial growth with

Fig. 1. Screening of lipase production by selected bacterial

isolates using tributyrin agar plate assay method.

(4)

0.00 1.00 2.00 3.00 4.00 5.00 6.00

OME I

OME II

OME III

OME IV

OME V

OME VI

OME VII

OME VIII

OME IX Bacterial isolates

Lipase activity

0 0.5 1 1.5 2 2.5 3 3.5 4

bacterial growth

Lipase production (U/ml) bacterial growth (OD at 600nm)

Fig. 2. Screening and selection of promising isolate for lipase production by flask scale culture. OME, Oil mill effluent.

Table 2. Macroscopic and microscopic and certain biochemical tests performed to promising bacterial isolate

Characterstics Result

Colony size Spore staining Gram’s staining Motility

Pigment production Capsule staining Indole production Methyl red reaction V .P. reaction Citrate hydrolysis Starch hydrolysis Casein hydrolysis Gelatin hydrolysis Urea hydrolysis Catalase test Oxidase test O/F test TSI test H

2

S Test

2-3 mm - ve - ve +ve, Green colour + ve

- ve -ve +ve - ve -ve -ve -ve -ve -ve +ve +ve -ve -ve -ve

different oils such as sunfloweroil, castor oil, coconut oil, tributyrin oil and olive oil by Pseudomonas sp. OME shown in Fig 3. High yield of lipase found with olive oil, th ideal substrate for inducing the enzyme production by Pseudomonas sp. OME. The effect of physical factors such as incubation time, temperature and initial medium pH on lipolytic en- zyme production was shown in Table 3. The enzyme pro- duction was increased with incubation time from 12-48 hrand further increase decreased the enzyme activity. The optimum incubation temperature and initial medium pH for enzyme production was found to be at 30

o

C and pH 7 re-

0 1 2 3 4 5 6 7

sunflower oil

Caster oil Coconut oil

Tributyrin oil

Olive oil Bacterial isolates

Lipase activity

0 0.5 1 1.5 2 2.5 3 3.5 4

Bacterial growth

Lipase production (U/ml) Bacterial growth (OD at 600 nm)

Different oils

Fig. 3. Bacterial growth and lipase production using differ- ent oils by Pseudomonas fluorescence .

Table 3. Effect of incubation time, temperature and initial medium pH on lipase production

Incubation time (hr) U/ml SDE

12.0 24.0 36.0 48.0 60.0 72.0

0 1.5 4.5 6.8 3.1 2.7

0 0.08 0.14 0.18 0.11 0.07

Temperaure (

o

C) U/ml SDE

30 40 50

6.8 2.1 0

0.22 0.12 0.00

Initial medium pH U/ml SDE

4 5 6 7 8

0 2.4 4.2 7.7 0

0.00 0.08 0.12 0.24 0.00 Values in the table are means of 3 replicates ±SDE, standard deviation error.

spectively, with ~7 U/ml (Table 3). The optimum nutritional

factors for olive oil and yeast extract concentration found

to be at 1.2 and 0.3% (Table 4). The data suggested that the

incubation period and the concentrations of olive oil and

yeast extract was significantly influenced enzyme pro-

duction when incubation temperature and medium pH kept

constant.

(5)

Table 5. The level of factors chosen for the central composite quadratic design for lipase production

Factor Units Low Actual (Coded) High Actual (Coded)

Incubation time : A Olive oil : B Yeast extract : C

%, v/v hr

%, w/v

24 (-1.0) 0.5 (-1.0) 0.1 (-1.0)

72(1.0) 1.6 (1.0) 0.5 (1.0)

Table 6. The central composite quadratic design for lipase production for three independent factors

Run Order Incubation time Olive oil Yeast extract Actual value Predicted value 1 2

3 4 5 6 7 8 10 9 11 12 13 14 15 16 17 18 19 20

0.00 1.00 -1.00 0.00 -1.00 -1.68 0.00 0.00 0.00 1.00 0.00 1.00 0.00 -1.00 0.00 1.00 1.00 0.00 -1.00 0.00

-1.00 0.00 0.00 1.00 1.00 1.57 0.00 0.00 -1.28 0.00 0.00 1.00 0.00 -1.00 -0.57 -1.00 1.00 -0.57 -1.00 0.00

0.00 1.00 0.00 1.00 -1.00 0.00 0.00 -0.50 -0.50 0.00 1.00 1.00 -1.50 -1.00 -1.00 0.00 -1.00 0.00 0.00 1.00

9.25 3.20 9.15 6.85 5.52 9.15 0.00 11.2 2.10 4.53 8.68 4.35 1.12 2.24 9.19 3.14 4.23 9.12 9.48 3.14

9.58 2.94 9.58 7.16 4.59 8.98 1.49 8.69 5.87 5.63 8.30 4.70 3.82 0.70 8.40 2.88 2.45 8.40 9.58 1.93 Table 4. Effect of yeast extract and olive oil concentration on

lipase production

Olive oil concentration (%, v/v) U/ml SDE 0.3 0.6

1.2 1.6

5.1 6.3 7.1 6.2

0.11 0.02 0.07 0.18 Yeast extract concentration (%, w/v) U/ml SDE

0.1 0.2 0.3 0.4 0.5

3.3 5.1 7.1 7.0 6.8

0.14 0.08 0.11 0.06 0.13 Values in the table are means of 3 replicates ± SDE, stand- ard deviation error.

Optimization of lipase production by ‘RSM’ (Multivariate analysis)

The response surface graphs were prepared for the gen- erated experimental data for lipolytic enzyme production.

Overall significant model terms could be explained as the maximum enzyme production. In the interaction studies of incubation time, olive and yeast extract concentration, a peak in lipase production (9.3 U/ml) was attained with incubation

time 48 h, oilive oil concentration 0.9% and the yeast extract

concentration 0.3% by Pseudomonas sp. OME. The sig-

nificance of regression equation was determined by compar-

ing the F value of the model equation and the lack of fit

with the tabulated F value. Regression analysis was per-

formed to fit the response (lipase production) with the ex-

perimental data. The values of the analysis of variance

(ANOVA) for the fitted model are given in Table 6. The co-

efficient of determination (R

2

) for lipase production, as a

function of independent variables, was 81%, which indicated

that the model correlated well with the measured data and

was statistically significant. The probability of the model

equation implying that the model is significant. ANOVA for

the three variables indicated that lipolytic enzyme pro-

duction could be described well by a polynomial model with

a relatively high coefficient of determination. The quadratic

model for predicting the optimal point is expressed in equa-

tion (1), and the model predicted the response satisfactorily

for enzyme production. The interaction between factor A

(incubation time, h), factor B (olive oil, %) and factor C (yeast

extract, %) on lipase production was shown in response sur-

face graphs. The interaction between factor A and factor B

(6)

Table 7. Analysis of variance and regression coefficient of the model representing relationship between lipase production

Source Mean Squares F- Value p-value

Prob > F Model

A-Incubation (hr) B-Olive oil (%, V/V) C-Yeast extract AB

AC BC A2 B2 C2

19.69 0.33 24.58 6.44 6.00 0.29 0.89 76.38 11.01 28.20

4.77 0.08 5.95 1.56 1.45 0.06 0.22 18.5 2.67 6.83

0.011 0.782 0.034 0.240 0.255 0.797 0.652 0.001 0.133 0.025

significant

R

2

=81%

Fig. 4. Response surface for lipase production. The inter- action between concentration of olive oil (%) and incubation time (hr).

Fig. 5. Response surface for lipase production. The inter- action between concentration of yeast extract (%) and incubation time (hr).

Fig. 6. Response surface for lipase production. The inter- action between concentration of yeast extract (%) and olive oil (%).

was shown in Fig. 4, the interaction between factor A and factor C was shown in Fig. 5, the interaction between factor B and factor C was shown in Fig. 6.

Final equation in terms of coded factors:

Lipase activity = 9.58-0.18 A +1.41 B +0.76 C -2.97 A2 -1.14 B2

-2.05 C2 -0.87 AB -0.19 AC +0.33 BC

With the advent of new frontiers in biotechnology, the

spectrum of lipase application has extended in many other

fields. Many different bacterial species produce lipases

which hydrolyze esters of glycerol with preferably long-

chain fatty acids. They act at the interface generated by a

hydrophobic lipid substrate in a hydrophilic aqueous

medium. A characteristic property of lipases is called inter-

facial activation, meaning a sharp increase in lipase activity

observed when the substrate starts to form an emulsion,

(7)

thereby presenting to the enzyme an interfacial area [9]. The lipase production in the optimized medium, such as wild-type strain of Pseudomonas fluorescens isolated from soil with 1.4 U/ml [24], a low-cost medium has been developed for growth and lipase production (8.3 U/ml) from Bacillus THL027 at 65

o

C and pH 7.0 [7]. The ‘one variable at a time’

approach for optimizing microbial products may be effective in some situations, but is inadequate as it is a time consum- ing process and it further neglects the interaction between variables and does not guarantee attaining optimal points [23]. The statistical design is efficient and effective because it provides a good coverage of the experimental space with as few measurements as possible. The collection of statistical techniques for experiment design, model development, eval- uation factors, and optimum conditions search. Thus the use of RSM in biotechnological processes is gaining immense im- portance for the optimization of enzyme production and sev- eral other processes [20,21,25]. Production of lipase using various oils was found to have several advantages, such as higher productivity as well as lower operational and capital costs. Because the cost of the enzyme is the major factor for broad application, approaches that either decrease the me- dium cost or increase production efficiency should be investigated. Since lipase production on a variety of edible oils, the cost of lipase production can be reduced greatly.

In conclusion the current demand of lipases with im- proved properties has initiated a continuous search for mi- croorganisms producing novel lipases for industrial applications. Statistical optimization of the enzyme pro- duction is required to overcome the limitations of classical empirical method and proved to be a powerful and useful tool for the optimization of enzymes.

Acknowledgment

This study was supported by the Dong-A University re- search fund.

References

1. Arbige, M. V. and W. H. Pitcher. 1989. Industrial enzymol- ogy: a look towards the future. Trends in Biotechnol. 7, 330-335.

2. Beisson, F., A. Tiss, C. Rivière, and R. Verger. 2000. Methods for lipase detection and assay: a critical review. Eur. J. Lipid Sci. Technol. 133-153

3. Bryant, T. N. 2004. PIBWin-software for probabilistic identification. J. Appl. Microbiololgy 97, 1326-7.

4. Chandrika, L. P. and S. Fereidoon. 2005. Optimization of extraction of phenolic compounds from wheat using re- sponse surface methodology. Food Chem. 93, 47-56.

5. Chen, F., T. Y. Cai, G. H. Zhao, X. J. Liao, L. Y. Guo, and X. S. Hu. 2005. Optimizing conditions for the purification of crude octacosanol extract from rice bran wax by molec- ular distillation analyzed using response surface method- ology, J. Food. Eng. 70, 47-53.

6. Dey, G., G. A. Mitra, R. Banerjee, and B. R. Maiti. 2001.

Enhanced production of amylase by optimization of nutri- tional constituents using response surface methodology.

Biochem. Eng. J. 7, 227-231.

7. Dharmsthiti, S. and S. Luchai. 1999. Production, purification and characterization of thermophilic lipase from Bacillus sp.

THL027. FEMS Microbiol. Lett . 179, 241-246.

8. Ghosh, P. K., R. K. Saxena, R. Gupta, R. P. Yadav and S.

Davidson. 1996. Microbial lipases: Production and applications. Science Prog. 79, 19-157.

9. Jaeger, K. E., S. Ransac, B. W. Dijkstra, C. Colson, M. van Heuvel, and O. Misset. 1994. Bacterial lipases. FEMS Microbiol. Rev. 15, 29-63

10. Kanlaykrit, W., K. Ishimatsu, M. Nakao, and S. Hayashida.

1987. Characteristics of raw starch-digesting glucoamylase from thermophilic Rhizomucor pusilus . J. Ferment. Technol. 65, 379-385.

11. Kristo, E., C. G. Biliaderis, and N. Tzanetakis. 2003.

Modelling of the acidification process and rheological prop- erties of milk fermented with a yogurt starter culture using response surface methodology. Food Chem. 83, 437-446.

12. Kumar, S. and T. Satyanarayana. 2001. Medium opti- mization for glucoamylase production by a yeast, Pichia sub- pelliculosa ABWF 64, in submerged cultivation. World J.

Microbiol. Biotechnol . 17, 83-87.

13. Lawerence, R. C., T. F. Fryer, and B. Reiter. 1967. Rapid method for the quantitative estimation of microbial lipases.

Nature 213, 1264-1265.

14. Lotrakul, P. and S. Dharmsthiti. 1997. Purification and char- acterization of lipase from Aeromonas sobria LP004. J.

Biotechnol . 54, 113-120.

15. Macrae, A. R. and R. C. Hammond. 1985. Present and future applications of lipases. Biotechnol. Gen. Engin. Rev. 3, 193- 217.

16. Naka, Y. and T. Nakamura. 1992. The effects of serum albu- min and related amino acids on pancreatic lipase and bile salts inhibited microbial lipases. Biosci. Biotechno. Biochem.

56, 1066-1070.

17. Nielsen, T. 1985. Industrial application possibilities of lipase. Fat Sci. Technol. 87, 15-19.

18. Palekar, A., P. T. Vasudevan, and S. Yan. 2000. Purification of lipase: a review. Biocatal. Biotransform. 18, 177-200.

19. Pandey, A., S. Benjamin, C. R. Soccol, P. Nigam, N. Krieger and U. T. Soccol. 1999. The realm of microbial lipases in biotechnology. Biotechnol. Appl. Biochem. 29, 119-131 20. Park, Y. S., S. W. Kang, J. S. Lee, S. I. Hong, and S. W.

Kim. 2002. Xylanase production in solid state fermentation

by Aspergillus niger mutant using statistical experimental

(8)

design. Appl. Microbiol. Biotechnol. 58, 761-766.

21. Rao, J. L. U. M. and T. Satyanarayana. 2003. Statistical opti- mization of a high maltose-forming, hyperthermostable and Ca2+-independent a-amylase production by an extreme thermophile Geobacillus thermoleovorans using response sur- face methodology. J. Appl. Microbiol. 95, 712-718.

22. Seitz, E. W. 1974. Industrial applications of microbial li- pases-A review. J. Am. Oil Chem. Soc. 51, 12-16.

23. Strobel, R. and G. Sullivan. 1999. Experimental design for improvement of fermentation. In Manual of Industrial Microbiology and Biotechnology. In Demain, A. L. and J.

E. Davies (eds.), pp. 80-93, Washington, ASM press.

초록:지방분해효소 생산균 Pseudomonas sp. OME 의 분리 동정 및 배양조건 최적화

G. Satheesh kumar

1,2

*, T. Kiran Reddy

2

, B. Madhavi

2

, P. Charan Teja

2

, M. Subhosh Chandra

3

and Yong Lark Choi

3

*

(

1

Acharya Nagarjuna 대학교 미생물학과,

2

Sri Venkateswara 대학교 바이러스학과,

3

동아대학교 생명공학과) 폐식용유에서 지방분해효소를 생산하는 세균을 분리하였고, PIBWIN 세균동정 방법으로 생리 생화학적 특성을

조사하여 확인한 결과 Pseudomonas sp. OME로 동정하였다. 여러 기질로 지방분해효소 생산을 조사한 결과 올리브

유에서 6.1 U/ml의 생산력을 나타내었다. 물리적 인자인 배양시간, 온도. pH 및 올리브유와 효모 추출액의 영양인 자에 의한 지방분해효소 생산 조건을 조사 하였다. 효소의 분비는 배양시간. 올리브유 와 효모 추출액의 농도에 강한 영향을 받았으며, RSM을 이용한 최적화는 이들 인자를 가지고 조사하였다. RSM을 이용한 지방분해효소 생산은 배양시간. 올리브유와 효모 추출액의 농도가 48 hr, 0.3 g, 및 0.9 ml에서 최적 생산조건을 나타냈다.

24. Sztajer, H., I. Maliszewska, and J. Wieczorek. 1988.

Production of exogenous lipases by bacteria, fungi, and actinomycetes. Enzyme Microb. Technol. 10, 492-497.

25. Vohra, A. and T. Satyanarayana. 2002. Statistical optimizatio n of the medium components by response surface methodol ogy to enhance phytase production by Pichia anomala . Proces s Biochem. 37, 999-1004.

26. Wejse, P. L., K. Ingvorsen, and K. K. Mortensen. 2003.

Xylanase production by a novel halophilic bacterium in-

creased 20-fold by response surface methodology. Enzyme

Microb. Technol. 32, 721-727.

수치

Fig. 1. Screening of lipase production by selected bacterial isolates using tributyrin agar plate assay method.
Fig. 3. Bacterial growth and lipase production using differ- differ-ent oils by Pseudomonas fluorescence .
Table 5. The level of factors chosen for the central composite quadratic design for lipase production
Fig. 4. Response surface for lipase production. The inter- inter-action between concentration of olive oil (%) and incubation time (hr).

참조

관련 문서