Next Generation Sequencing and Bioinformatics
Ki-Bong Kim*
Department of Biomedical Technology, Sangmyung University, Cheonan 330-720, Korea Received March 17, 2015 /Revised March 22, 2015 /Accepted March 22, 2015
With the ongoing development of next-generation sequencing (NGS) platforms and advancements in the latest bioinformatics tools at an unprecedented pace, the ultimate goal of sequencing the human genome for less than $1,000 can be feasible in the near future. The rapid technological advances in NGS have brought about increasing demands for statistical methods and bioinformatics tools for the analysis and management of NGS data. Even in the early stages of the commercial availability of NGS platforms, a large number of applications or tools already existed for analyzing, interpreting, and visu- alizing NGS data. However, the availability of this plethora of NGS data presents a significant chal- lenge for storage, analyses, and data management. Intrinsically, the analysis of NGS data includes the alignment of sequence reads to a reference, base-calling, and/or polymorphism detection, de novo as- sembly from paired or unpaired reads, structural variant detection, and genome browsing. While the NGS technologies have allowed a massive increase in available raw sequence data, a number of new informatics challenges and difficulties must be addressed to improve the current state and fulfill the promise of genome research. This review aims to provide an overview of major NGS technologies and bioinformatics tools for NGS data analyses.
Key words :
Base-calling, bioinformatics tools, de novo assembly, next generation sequencing, poly- morphism detection
*Corresponding author
*Tel : +82-41-550-5377, Fax : +82-41-550-5184
*E-mail : [email protected]
This is an Open-Access article distributed under the terms of the Creative Commons Attribution Non-Commercial License (http://creativecommons.org/licenses/by-nc/3.0) which permits unrestricted non-commercial use, distribution, and reproduction in any medium, provided the original work is properly cited.
Journal of Life Science 2015 Vol. 25. No. 3. 357~367 DOI : http://dx.doi.org/10.5352/JLS.2015.25.3.357
Introduction
The advent of next generation sequencing (NGS) has al- lowed an explosion in sequencing whole genomes of a wide range of organisms, with immense biological implications.
NGS technologies, coupled with additional technological ad- vances, have allowed sequencing genomes at much lower costs and much higher throughput than conventional se- quencing method and have transformed the landscape of ge- nomics [46]. In this context, they have lately provided insight into whole-genome characterization of a wide range of organisms. In the post-genomic era, new technologies have revealed an outbreak of prerequisite genomic sequences and supporting data to understand genome wide functional reg- ulation of gene expression and metabolic pathways re- construction [19]. For the future direction, we need the in-depth genome sequence information and analysis for most of the mammals, including human to fully understand
genome variation of economic traits, genetic susceptibility to diseases, and pharmacogenomics of drug response.
Recently, tremendous success has been achieved in the fields of decoding human genome, technological advancement of new era of human genome applications, toward personal- ized genomes and discovery of rare variants, leveraging ge- nome sequencing to impact on cancer researches and mam- malian evolution and population structure. The horizons and expectations have broadened due to the technological advances in the field of genomics, especially the high throughput NGS and its wide range of applications [43].
Most NGS platforms are based on various implementa-
tions of cyclic-array sequencing that sequences a dense array
of DNA features by iterative cycles of enzymatic manipu-
lation and imaging-based data collection [38]. The repre-
sentative NGS platforms that are based on this sequencing
technology include Roche’s 454, Illumina’s Genome Analyz-
er, ABI (Applied Biosystems)’s SOLiD and the Heliscope
from Helicos. Although these platforms are quite diverse in
sequencing biochemistry as well as in how the array is gen-
erated, their work flows are conceptually very similar. All
of them allow the sequencing of millions of short sequences
or reads simultaneously, and are capable of sequencing a
full human genome per day at a cost of 200-fold less than
previous methods. Moreover, they allow the generation of
- Review -
many kinds of sequence data and have its wide range of applications such as: chromatin immunoprecipitation cou- pled to DNA microarray (ChIPchip) or sequencing (ChIP- seq) [44], RNA sequencing (RNA-seq) [39, 50], whole ge- nome genotyping, de novo assembling and re-assembling of genome [41, 50], genome wide structural variation, mutation detection and carrier screening, detection of inherited dis- orders and complex human diseases, DNA library prepara- tion, paired ends and genomic captures, sequencing of mi- tochondrial genome and personal genomics [43].
With the rapid advancement in NGS technologies and the subsequently fast growing volume of biological data, diverse data sources (databases and web servers) have been devel- oped to facilitate data management, accessibility, and analysis. As acquisition of genomic data becomes increas- ingly cost-efficient, genomic data sets are accumulating at an exponential rate and new types of genetic data are emerging. These come with the inherent challenges of new methods of statistical analysis and modeling. Indeed new technologies are producing data at a rate that outpaces our ability to analyze its biological meaning. Researchers are ad- dressing this challenge by adopting mathematical and stat- istical software, computer modeling, and other computa- tional and engineering methods. As a result, bioinformatics has become the latest engineering discipline. As computers provide the ability to process the complex models, high-per- formance computer languages have become a necessity for implementing state-of-the-art algorithms and methods [19].
In the following sections of this review, the NGS tech- nologies will be described and then intrinsic bioinformatics tools for NGS data analysis will be focused on subsequently.
Next Generation Sequencing Technologies
In 2000, Jonathan Rothberg founded 454 Life Sciences, which further developed the first commercially available NGS platform, the GS 20. The GS instrument was introduced in 2005, developed by 454 Life Sciences, as the first NGS system on the market. In the following years, Roche Applied Science acquired 454 Life Sciences and extended further the new version of the 454 instrument, i.e., the GS FLX titanium.
Sharing the same technological principle in both GS 20 and GS FLX titanium, the flow cell is referred to as a "picotiter well" plate, which is made from a fused fiber-optic bundle.
On a separate front, single-molecule PCR in micro-compart- ments consisting of water-in-oil emulsions was also devel-
oped by Roche high throughput NGS platform [48].
DNA sequencing with commercially available NGS plat- forms is generally conducted with the following steps. The first step of the sequencing process consists of genomic DNA fragmentation and ligation to common adaptors. In this first step, all of the NGS technologies are able to use alternative protocols in order to generate jumping libraries of mate- paired tags with controllable distance distributions. After fragmentation and ligation with common adaptors, genomic DNA is then subjected to one of the several protocols that results in an array of millions of spatially immobilized PCR colonies. While these steps are followed in most NGS plat- forms, each utilizes a different strategy. This step can be ach- ieved by several approaches, including in situ polonies, emulsion PCR or bridge PCR. Once the PCR colonies are immobilized in the array, the sequencing process itself con- sists of alternating cycles of enzyme-driven biochemistry and imaging-based data acquisition. NGS parallelization of the sequencing reactions generates hundreds of megabases to gigabases of nucleotide sequence reads in a single instru- ment run. This has enabled a drastic increase in available sequence data and fundamentally changed genome sequenc- ing approaches in the biomedical sciences. Newly emerging NGS technologies and instruments have further contributed to a significant decrease in the cost of sequencing nearing the mark of $1,000 per genome sequencing.
The amount of introduced errors is correlated with the fidelity of the polymerase utilized in the reaction [14, 41].
Read lengths vary with the technology, pyrosequencing gen- erating long reads (~400 nts), while reverse termination and sequencing by ligation technologies produce shorter reads.
Different technologies can thus result in significantly differ- ent output data and performance. The combination of more than one platform is potentially more cost effective and could yield higher fidelity and accuracy [7, 15].
Massively parallel sequencing platforms commercially available and their features are summarized in the table 1.
As the pace of NGS technologies is advancing rapidly, tech- nical specifications and pricing are in flux and the race for more additional platforms are continuously on the horizon.
Second Generation NGS Platforms
The second generation NGS platforms can generate about
five hundred million bases of raw sequence (Roche) to bil-
lions of bases in a single run (Illumina, SOLiD). These novel
methods rely on parallel, cyclic interrogation of sequences
Table 1. Commercially available NGS platforms
Platform Template
Preparation Chemistry Max. Read Length
(bases)
Run Times (days)
Max Gb per Run
Roche 454 Clonal-emPCR Pyrosequencing 400 0.42 0.40-0.60
GS FLX Titanium Clonal-emPCR Pyrosequencing 400 0.42 0.035
Illumina MiSeq Clonal Bridge
Amplification Reversible Dye Terminator 2×300 0.17-2.7 15
Illumina HiSeq Clonal Bridge
Amplification Reversible Dye Terminator 2×150 0.3-11 1,000
Illumina Genome Analyzer IIX
Clonal Bridge
Amplification Reversible Dye Terminator 2×150 2-14 95
Life Technologies
SOLiD4 Clonal-emPCR Oligonucleotide 8-mer
Chained Ligation 35-50 4-7 35-50
Life Technologies
Ion Proton Clonal-emPCR Native dNTPs, proton
detection 200 0.5 100
Complete Genomics Gridded DNA-nanoballs
Oligonucleotide 9-mer
Unchained Ligation 7×10 11 3,000
Helicos Biosciences
Heliscope Single Molecule Reversible Dye Terminator 35 8 25
Pacific Biosciences
SMRT Single Molecule Phospholinked Fluorescent Nucleotides
10,000 (N50);
30,000+ (max) 0.08 0.5
Run times and gigabase (Gb) output per run for single-end sequencing are noted Run times and outputs approximately double when performing paired-end sequencing (http://en.wikipedia.org/wiki/Massive_parallel_sequencing).
Fig. 1. Advanced technological features of three leading second generation NGS platforms [43].
from spatially separated clonal amplicons (26 μm oil-aque- ous emulsion bead [Roche: pyrosequencing chemistry], 1 μm clonal bead [SOLiD: sequencing by sequential ligation of oli- gonucleotide probes], clonal bridge [Illumina: sequencing by
reversible dye terminators]). Currently, these three leading
second generation NGS platforms (Fig. 1) are commercially
available and the race for more additional platforms are con-
tinuously on the horizon [32].
In Roche sequencing system [18], DNA fragments are li- gated to beads by means of specific adapters. To obtain suffi- cient light signal intensity for detection in the sequenc- ing-by-synthesis reaction step, emulsion PCR is carried out for amplification. Once the PCR amplification cycles are complete, each bead with its fragment is placed at the top end of an optical fiber that has the other end facing to a sensitive CCD camera, which enables the positional de- tection of emitted light. In the last step, polymerase enzyme and primer are added to the beads so that the synthesis of the complementary strand can start: the incorporation of a base by the polymerase enzyme in the growing chain re- leases a pyrophosphate group, which can be detected as emitted light. A limitation of the Roche 454 platform is that base calling cannot properly interpret long stretches (>6) of the same nucleotide (homopolymer DNA segments).
The Illumina platform is the most widely available high throughput sequencing (HTS) technology. In this platform, the amplified sequencing features are generated by bridge PCR [1, 10] and after immobilization in the array, all the molecules are sequenced in parallel by means of sequencing by synthesis. During the sequencing process, each nucleotide is recorded through imaging techniques, and is then con- verted into base calls. The Illumina platform is able to se- quence reads up to 300 bp with relatively low error rates.
Read length is limited by multiple factors that cause signal decay and dephasing, such as incomplete cleavage of fluo- rescent labels or terminating moieties. The great majority of the sequencing errors are substitution errors, while in- sertion/deletion errors are much less common.
The ABI SOLiD is another widely used sequencing plat- form and has its origins in the system described by Shendure
et al. [47] in 2005. The sequencing process used by ABISOLiD is very similar to the Solexa workflow, however, there are also some differences. First of all, the clonal se- quencing features are generated by emulsion PCR, instead of bridge PCR. Second, the SOLiD system uses a di-base se- quencing technique in which two nucleotides are read simul- taneously at every step of the sequencing process, while the Illumina system reads the DNA sequences directly. Al- though there are 16 possible pairs of di-bases, the SOLiD system uses only four dyes and so sets of four di-bases are all represented by a single color. As the sequencing machine moves along the read, each base is interrogated twice: first as the right nucleotide of a pair, and then as the left one.
In this way, it is possible to derive each subsequent letter
if we know the previous one, and if one of the colors in a read is misidentified (e.g. due to a sequencing error), this will change all of the subsequent letters in the translation.
Third Generation NGS Platforms
Sequencing from a single DNA molecule is now called as the “third generation of high throughput NGS technol- ogy” [45]. The concept of sequencing-by-synthesis without a prior amplification step, i.e., single molecule sequencing is currently pursued by a number of companies. Unlike the second generation NGS technologies, which rely on PCR to grow clusters of a given DNA template, attaching the clus- ters of DNA templates to a solid surface that is subsequently imaged as the clusters are sequenced by synthesis in a phased approach, the third generation NGS technologies in- terrogate single molecules of DNA in a such a way that no synchronization (a limitation of second generation NGS) is required [50], thereby overcoming issues related to the bias- es introduced by PCR amplification and dephasing. Further- more, they have the potential to exploit more fully, the high catalytic rates and high processivity of DNA polymerase, or avoid any biology or chemistry altogether to radically in- crease read length (from tens of bases, to tens of thousands of bases per read) and time to result (from days, to hours, or minutes). Besides this, they may offer the following ad- vantages over second generation NGS technologies: i) higher throughput, ii) faster turnaround time, iii) longer read lengths to enhance de novo assembly and enable direct de- tection of haplotypes and even whole chromosome phasing, iv) higher consensus accuracy to enable rare variant de- tection, v) small amounts of starting material, and vi) low cost, where sequencing the human genome at high fold cov- erage for less than $1,000 is now a reasonable goal for the community. The third generation NGS platforms (Helicos and Pacific Biosciences etc.) are summarized in Fig. 2 [43].
Paired-end and Mate-pair Sequencing
All the sequencing technologies introduced above are able
to generate paired-end or mate-pair data. Mate-pairs are cre-
ated when genomic DNA is fragmented and size-selected
inserts are circularized and linked by means of an internal
adaptor. After purification, the mate-pairs are generated by
sequencing around the adaptor. By contrast, paired-end
reads are generated by the fragmentation of genomic DNA
into short (<300 bp) segments, followed by sequencing of
both ends of the segment. Although the approaches to obtain
Fig. 2. Advanced technological features of four leading third generation high throughput (HT) NGS platforms [43].
mate-pair and pair-end libraries are very different, from a computational perspective, the distinction between mate- pairs and paired-ends is not crucial: paired reads are two sequences, generated at an approximately known distance from each other in the genome (the insert size). Paired reads are very useful for short-read data analysis: during the align- ment process, a large fraction of short reads are difficult to map uniquely to the genome, and the second read of a pair can be used to find the correct location. Moreover, mate-pairs are also typically used to discover structural var- iants (SVs), that is, regions of the genome that have under- gone large-scale mutations such as inversions, insertions, and deletions.
Methods for Mapping/Alignment, Assembly and Polymorphism Detection
The NGS platforms generate shorter reads with lower quality, when compared to the Sanger sequencing method.
In other words, the sheer volume of NGS data coupled with their relatively short reads and low quality raises the ques- tion of how to analyze these data so as to maximize their scientific value. Once sequencing is complete, raw sequence data must undergo several analysis steps. A generalized data analysis pipeline for NGS data includes preprocessing the data to remove adapter sequences and low quality reads, mapping of the data to a reference genome or de novo assem-
bly of the sequence reads, and analysis of the compiled se- quence [12]. The sequence analysis can include a wide varie- ty of bioinformatics assessments, including genetic variant calling for detection of SNPs or indels (i.e., the insertion or deletion of bases), detection of novel genes or regulatory ele- ments, and assessment of transcript expression levels. Many free online tools and software packages exist to perform the bioinformatics necessary to successfully analyze sequence data [14]. Although this provides many useful resources, it has delayed or prevented the selection of standard best prac- tice tools for analysis. Any NGS research will require sig- nificant computational resources, and a core of bioinforma- ticians with skills to install, update, and run the latest tools.
Furthermore, using NGS platforms can necessitate planning for at least several hundred terabytes of data storage.
Alignment or Mapping
The first important challenge provided by NGS data is the read alignment or mapping problem. When NGS was initially introduced, established alignment tools, suited for the query of a limited number of sequences, were inadequate for NGS data which comprised millions of short reads. This spurred the design of novel alignment algorithms and tools which use heuristic techniques for alignment of millions of short reads within an acceptable time requirement [25].
These tools make the best use of the many advantages specif-
ic to each of the NGS platforms such as the short length
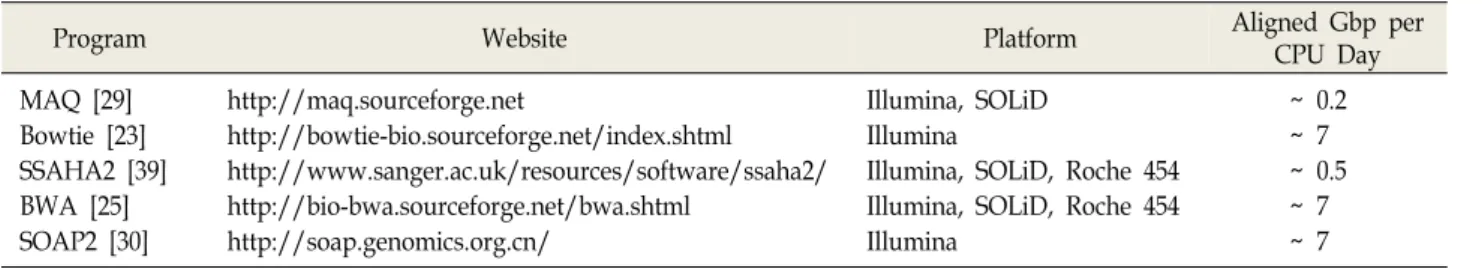
Table 2. A selection of short reads alignment tools
Program Website Platform Aligned Gbp per
CPU Day MAQ [29]
Bowtie [23]
SSAHA2 [39]
BWA [25]
SOAP2 [30]
http://maq.sourceforge.net
http://bowtie-bio.sourceforge.net/index.shtml http://www.sanger.ac.uk/resources/software/ssaha2/
http://bio-bwa.sourceforge.net/bwa.shtml http://soap.genomics.org.cn/
Illumina, SOLiD Illumina
Illumina, SOLiD, Roche 454 Illumina, SOLiD, Roche 454 Illumina
~ 0.2
~ 7
~ 0.5
~ 7
~ 7 The platform compatibility depends on the maximum read length supported by the program [32].
of SOLiD and Helicos reads, the low indel error rate of Illumina reads and the di-nucleotide encoding of SOLiD reads. These short read alignment tools outperform the per- formance of traditional alignment programs such as BLAST [20] in terms of speed and accuracy. The degree of con- fidence can vary as a result of both the reference databases and the shortness of reads. Intrinsically, they must be able to quickly and efficiently align the billions of short reads and allow the alignment of non-unique reads or reads that do not match exactly the reference genome owing to se- quencing errors/variations or repetitive element. Represen- tative public short read alignment tools are listed in the table 2. They are able to output alignments in the SAM format [27] that is widely supported by alignment viewers. BWA and Mosaik work well for Sanger and 454 reads, allowing gaps and clipping. Bowtie and MAQ allow base quality scores to be used, improving alignment accuracy. MAQ only does gapped alignment for Illumina paired-end reads. All of the tools reported in the table 2 allow use of paired-end mapping. Paired-end alignment outperforms single-end alignment in terms of both sensitivity and specificity, allow- ing for a smaller number of wrongly mapped reads [26].
On speed, Bowtie, BWA and SOAP2 align ~7 Gbp against the human genome per CPU day, outperforming the other short read alignment tools.
When choosing an alignment tool, one needs to consider some important features including the following: 1) Quality utilization and control―Most alignment software generate the alignment output in the Sequence Alignment Map (SAM) format, with a multitude of supporting downstream analysis tools. Alignment output contains a PHRED based quality score describing the probability of per-base false alignment. These quality scores can be re-assessed using cur- rently available tools [24], 2) Gapped alignment. Alignment tools may or may not use a gap alignment algorithm. When specifically detecting for indels [22], it is highly recom- mended to choose a tool that implements gapped alignment
[26], 3) Mismatches and Gap penalties. Most alignment tools allow the user to set the number of allowed mismatches be- tween the read and a reference location and the scoring scale for gap opening and extension, and 4) Multiple mapping.
Usually, a portion of the reads will remain unmapped due to contaminant origin or sequencing errors. More commonly, they will ambiguously map to several different locations (multiple mapping) due to sequence homology and repetitiveness. Of the current approaches for allocation of these multiply mapped reads, one uses probabilistic models such as maximum likelihood to compute the most likely ori- gin of each read.
De novo Assembly
Assembly refers to the process of piecing together short sequences into longer ones. These long sequences, called contigs, are then grouped to form scaffolds for computation- ally reconstructing a sample’s genetic component. When the assembly process is performed with the assistance of a refer- ence genome, it is referred to as mapping assembly; if no reference is available it is called de novo assembly. Tools that allow for the de novo short read assembly are essential when a reference genome does not exist or, in general, when a novel genome assembly is desired. The currently accepted methods most capable of assembling NGS data utilize k-mer de Bruijn graph traversal-based methods, including pro- grams such as AbySS [31], ALLPATHS [13], Edena [21], Velvet [8], SOAPdenovo [51] as well as a number of newer assemblers under development. Even though all these pro- grams are based on the de Bruijn graph data structure, they differ in how they treat errors and if they use read-pair information. To date, de novo assembly of the human genome from high throughput sequence data is able only to re- construct short DNA regions (contigs), as the presence of repeats makes it difficult or impossible to assemble longer pieces.
It is important to note two things about k-mer based
Table 3. A list of tools for the visualization of alignments or assemblies of short read data [32]
Program Website Distribution
EagleView [17] http://www.niehs.nih.gov/research/resources/sof
tware/biostatistics/eagleview/ Binary version for Windows, Mac OS X and Linux MapView [3] http://evolution.sysu.edu.cn/mapview/ Binary version for Windows and Linux
MaqView [36] http://maq.sourceforge.net/maqview.shtml Source Code (C, Java) and Binary version for Linux and Mac OS X
Tablet [36] http://bioinf.scri.ac.uk/tablet/ Binary version for Windows, Mac OS X and Linux IGV http://www.broadinstitute.org/igv Binary version for Windows, Mac OS X and Linux
assembly. First, this method reduces the time of assembly,
but at the cost of requiring significant RAM which is propor- tional to the size of the genome(s) being assembled and/or the amount of data, which de facto limits the total size of the genome being assembled. Second, this method is non-deterministic. Because reads are broken down into smaller pieces of defined length (k-mers), reads themselves are no longer the target of assembly, leading to the potential introduction of assembly errors.
Variant Calling
Variant calling refers to the identification of single nucleo- tide polymorphisms (SNPs), insertions and deletions (indels), copy number variations (CNVs) and other types of structural variations, e.g. inversions, translocations etc, in a sequenced sample [9]. The process is complicated by areas of low cover- age, sequencing errors, misalignment caused by either low complexity and repeat regions or adjacent variants and li- brary preparation biases (e.g. PCR duplicates) [36].
SNP and indel identification is a very important task when one deals with resequenced genomes. However, only an handful of tools have been implemented [23, 28, 29, 35, 40] for SNP and small (1-5 bp) indel discovery. The goal of these programs consist in judging the likelihood that a locus is a heterozygous or homozygous variant given the error rates of the platform, the probability of bad mappings, and the amount of coverage. For these reasons, all the avail- able tools for SNP and indel discovery follow two main steps: the first is for data preparation and in the second each nucleotide is called under a Bayesian framework.
In the first step (preparation step) each read is evaluated and filtered. Reads that may map to paralogs or repeat se- quences are discarded or considered only if other reads give supporting evidence, quality values are reassigned based on various statistics and lastly a re-alignment step is employed to better align small indels. After the preparation step a
Bayesian approach is applied to the filtered data. This ap- proach consists of computing the conditional likelihood of the nucleotides at each position by using the Bayes rule:
(1) The Bayes rule states that the posterior probability P(G|R) of a certain genotype G given the data R can be calculated knowing the prior probability of that genotype and the prob- ability of observing the given data from this genotype P(R|G) (likelihood). Usually, the prior P(G) is calculated as the probability of the variant while the probability of observ- ing the prepared reads P(R|G) is then estimated for each possible donor genotype. The tools that use a Bayesian ap- proach are PolyBayes [35], SOAPsnp [30] and MAQ [29].
Other alternative methods, including machine learning, have been proposed by Malhis et al. [34] and by Hoberman et
al. [16]. In machine learning approach, site-specific featuresare generated from read mappings, and this information is used to train a classifier that is used to score the hetero- zygosity at each position.
Alignment/Assembly Viewers
The advent of high throughput sequencing technologies
has given rise to the need for fast, efficient and user-friendly
tools for browsing the resultant assemblies or alignments
and the re-sequenced genomes. Tools that allow for the visu-
alization of the alignment or assembly of short read data
include EagleView [17], MapView [3], the Text Alignment
Viewer of SAMtools [27], MaqView [29], Tablet [37] and IGV
(http://www.broadinstitute.org/igv/) by Broad Institute
(Table 3). When dealing with NGS data, visualization soft-
ware is required that takes into account the following chal-
lenges: processing quickly and efficiently a huge amount of
reads, providing high-quality rendering and navigation of
the assembled reads and supporting a widening range of
assembly formats. Moreover, the increasing diffusion of
NGS technologies requires biologist-friendly and easy-to-use softwares with a user-friendly interface.
Discovering Structural Variants
Structural variation was originally defined as insertions, deletions and inversions greater than 1 kb in size [11]. With the sequencing of human genomes now becoming routine, the operational spectrum of structural variants and copy number variants has widened to include much smaller events (for example, those >50 bp in length). The challenge now is to discover the full extent of structural variation and to be able to genotype it routinely in order to understand its effects on human disease, complex traits and evolution.
The discovery and genotyping of structural variation has been central to understanding these disease associations.
Ideally, SV discovery and genotyping requires accurate pre- diction of three features: copy, content and structure. In practice, this goal has remained elusive because SVs tend to reside within repetitive DNA, which makes their charac- terization more difficult. SVs vary widely in size and there are numerous classes of structural variation: deletions, trans- locations, inversions, mobile elements, tandem duplications and novel insertions. Within the past decade, a variety of computational and experimental methods has emerged; typ- ically each focuses on a particular class of structural varia- tion limited by frequency and size range of the events [2].
The first HTS-based approach to detect SVs were based on paired-end read mapping (PEM), which identifies in- sertions and deletions by comparing the distance between mapped read pairs to the average insert size of the genomic library. Although this method is able to identify deletions smaller than 1 kb with high sensitivity, it does not allow the discovery of insertions larger than the average insert size of the library and the exact borders of SVs in complex ge- nomic regions rich in segmental duplication [6]. In this sce- nario, a very promising approach for the identification of SVs using HTS technologies consists in measuring the depth of coverage (DOC) of reads aligned to the human reference genome. At present, few computational methods have been developed for the analysis of DOC data: Campbell et al. [4]
use the Circular Binary Segmentation algorithm [41] origi- nally developed for genomic hybridization microarray data, Chiang et al. [6] use a local change-point analysis technique, Yoon et al. developed a new statistical method based on sig- nificance testing that works on intervals of data points, while Magi et al. [33] developed a novel algorithm, named
JointSLM, that allows them to analyze DOC signals from multiple samples simultaneously. Several PEM-based algo- rithms have been developed for the detection of SVs, includ- ing PEMer, VariationHunter, MoDIL and BreakDancer.
These tools mainly differ on the variant of signatures they detect and on the clustering procedures.
Conclusions
The availability of ultra-deep sequencing of genomic DNA will transform the medical fields, especially in analysis of disease causes and development of new drugs and diag- nostics, in the near future. Further, it may become a promis- ing tool in the analysis of chromatin immunoprecipitation coupled to DNA microarray (ChIP-chip) or sequencing (ChIP-Seq), RNA sequencing (RNA-Seq), whole genome genotyping, de novo assembling and re-assembling of ge- nome, genome wide structural variation, mutation detection, detection of inherited disorders and complex human dis- eases, and personal genomics etc. It is anticipated that the NGS technology will probably be fully adopted for clinical purposes in human medicine in the next decade. With the progress of third NGS platform at tremendous pace, one can hope that the goal of determining a whole chromosome se- quence from a single original DNA molecule or genome se- quence for less than $1,000 could be feasible soon in the near future.
However, the availability of the sheer volume of sequenc-
ing data presents a significant challenge for storage, analyses
and data management. While novel tools have been devel-
oped specifically for NGS data, ranging from short-read
alignment programs to algorithms for the detection of struc-
tural variants, the complexity of NGS data has presented
difficult challenges and exposed a number of analytical
bottlenecks. As these sequencing platforms becomes more
commonplace, there is an increasingly need for data special-
ist to extract biological information from the huge amounts
of data produced. Therefore, a key task is to get a clear pic-
ture of the bioinformatics tools available for the NGS data
analysis. In addition, generation of systematically and syn-
tactically unambiguous nomenclature systems for genomic
data across species is a crucial task. Such systems are neces-
sary for adequate handling genetic information in the con-
text of comparative functional genomics.
Acknowledgements
This research was supported by the Research Grant (2012-A000-0239) from Sangmyung University. I apologize for the failure to cite many of the important and relevant papers in this field due to space limitations and timing.
References
1. Adessi, C., Matton, G., Ayala, G., Turcatti, G., Mermod, J.
J., Mayer, P. and Kawashima, E. 2000. Solid phase DNA amplification: characterisation of primer attachment and amplification mechanisms. Nucleic Acids Res. 28, e87.
2. Alkan, C., Coe, B. P. and Eichler, E. E. 2011. Genome struc- tural variation discovery and genotyping. Nat. Rev. Genet.
12, 363-376.
3. Bao, H., Guo, H., Wang, J., Zhou, R., Lu, X. and Shi, S.
2009. MapView: visualization of short reads alignment on a desktop computer. Bioinformatics 12, 1554-1555.
4. Campbell, P. J., Stephens, P. J., Pleasance, E. D., O’Meara, S., Li, H., Santarius, T., Stebbings, L. A., Leroy, C. and Edkins, S. et al. 2008. Identification of somatically acquired rearrangements in cancer using genome-wide massively parallel paired-end sequencing. Nat. Genet. 40, 722-729.
5. Chiang, D. Y., Getz, G., Jaffe, D. B., O’Kelly, M. J. T., Zhao, X., Carter, S. L., Russ, C., Nusbaum, C., Meyerson, M. and Lander, E. S. 2009. High-resolution mapping of copy-num- ber alterations with massively parallel sequencing. Nat.
Methods 6, 99-103.
6. Dalca, A. V. and Brudno, M. 2010. Genome variation discov- ery with high-throughput sequencing data. Brief. Bioinform.
11, 3-14.
7. Dalloul, R. A., Long, J. A., Zimin, A. V., Aslam, L. and Beal, K. et al. 2010. Multi-platform next generation sequencing of the domestic turkey (Meleagris gallopavo): Genome as- sembly and analysis. PLoS Biol. 8, e1000475. doi:10.1371/
journal.pbio.1000475.
8. Dinsdale, E. A., Edwards, R. A., Hall, D., Angly, F., Breit- bart, M., Brulc, J. M., Furlan, M., Desnues, C., Haynes, M.
and Li, L. et al. 2008. Functional metagenomic profiling of nine biomes. Nature 452, 629-632.
9. Durbin, R. M., Abecasis, G. R., Altshuler, D. L., Auton, A.
and Brooks, L. D. et al. 2010. A map of human genome variation from population-scale sequencing. Nature 467, 1061-1073.
10. Fedurco, M., Romieu, A., Williams, S., Lawrence, I. and Turcatti, G. 2006. BTA, a novel reagent for DNA attachment on glass and efficient generation of solid-phase amplified DNA colonies. Nucleic Acids Res. 34, e22.
11. Feuk, L., Carson, A. R. and Scherer, S. W. 2006. Structural variation in the human genome. Nature Rev. Genet. 7, 85-97.
12. Flicek, P. and Birney, E. 2009. Sense from sequence reads:
methods for alignment and assembly. Nat. Methods 6, S6-S12.
13. Giardine, B., Riemer, C., Hardison, R. C., Burhans, R., Elnitski, L., Shah, P., Zhang, Y., Blankenberg, D., Albert, I.
and Taylor, J. et al. 2005. Galaxy: a platform for interactive large-scale genome analysis. Genome Res. 15, 1451-1455.
14. Gogol-Döring, A. and Chen, W. 2012. An overview of the analysis of next generation sequencing data. Methods Mol.
Biol. 802, 249-57.
15. Grada, A. and Weinbrecht, K. 2013. Next-generation se- quencing: methodology and appliction. J. Investig. Dermatol.
133, e11; doi:10.1038/jid.2013.248.
16. Hoberman, R., Dias, J., Ge, B., Harmsen, E., Mayhew, M., Verlaan, D. J., Kwan, T., Dewar, K., Blanchette, M. and Pastinen, T. 2009. A probabilistic approach for SNP discov- ery in high-throughput human resequencing data. Genome Res. 19, 1542-1552.
17. Huang, W. and Marth, G. 2008. EagleView: a genome as- sembly viewer for next-generation sequencing technologies.
Genome Res. 9, 1538-1543.
18. Hyman, E. D. 1988. A new method of sequencing DNA.
Anal. Biochem. 174, 423-436.
19. Jimenez-Lopex, J. C., Gachomo, E. W., Sharma, S. and Kotchoni, S. O. 2013. Genome sequencing and next-gen- eration sequence data analysis: a comprehensive compila- tion of bioinformatics tools and databases. Am. J. Mol. Biol.
3, 115-130.
20. Kent, W. J. 2002. BLAT-the BLAST-like alignment tool.
Genome Res. 4, 656-664.
21. Kosakovsky, P. S., Wadhawan, S., Chiaromonte, F., Ananda, G., Chung, W. Y., Taylor, J. and Nekrutenko, A. 2009.
Windshield splatter analysis with the Galaxy metagenomic pipeline. Genome Res. 19, 2144-2153.
22. Krawitz, P., Rödelsperger, C., Jäger, M., Jostins, L., Bauer, S. and Robinson, P. N. 2010. Microindel detection in short-read sequence data. Bioinformatics 26, 722-729. doi:
10.1093/bioinformatics/btq027.
23. Langmead, B., Trapnell, C., Pop, M. and Salzberg, S. L. 2009.
Ultrafast and memory-efficient alignment of short DNA se- quences to the human genome. Genome Biol. 3, R25.
24. Lassmann, T., Hayashizaki, Y. and Daub, C. O. 2011.
SAMStat: Monitoring biases in next generation sequencing data. Bioinformatics 27, 130-131. doi:10.1093/bioinformatics/
btq614.
25. Li, H. and Durbin, R. 2010. Fast and accurate long-read alignment with Burrows-Wheeler transform. Bioinformatics 5, 589-595.
26. Li, H. and Durbin, R. 2009. Fast and accurate short read alignment with Burrows-Wheeler transform. Bioinformatics 25, 754-1760. doi:10.1093/bioinformatics/btp324.
27. Li, H., Handsaker, B., Wysoker, A., Fennell, T., Ruan, J., Homer, N., Marth, G., Abecasis, G. and Durbin, R. et al.
2009. The Sequence Alignment/Map format and SAMtools.
Bioinformatics 16, 2078-2079.
28. Li, R., Li, Y., Kristiansen, K. and Wang, J. 2008. SOAP: short oligonucleotide alignment program. Bioinformatics 5, 713- 714.
29. Li, H., Ruan, J. and Durbin, R. 2008. Mapping short DNA
sequencing reads and calling variants using mapping qual- ity scores. Genome Res. 11, 1851-1858.
30. Li, R., Yu, C., Li, Y., Lam, T., Yiu, S., Kristiansen, K. and Wang, J. 2009. SOAP2: an improved ultrafast tool for short read alignment. Bioinformatics 15, 1966-1967.
31. Lorenzi, H. A., Hoover, J., Inman, J., Safford, T., Murphy, S., Kagan, L. and Williamson, S. J. 2011. The Viral Meta- Genome Annotation Pipeline (VMGAP):an automated tool for the functional annotation of viral Metagenomic shotgun sequencing data. Stand. Genomic Sci. 4, 418-429.
32. Magi, A., Benlli, M., Gozzini, A., Girolami, F., Torricelli, F.
and Brandi, M. L. 2010. Bioinformatics for next generation sequencing data. Genes 1, 294-307.
33. Magi, A., Benelli, M., Seungtai Yoon, S. and Torricelli, F.
Detecting common copy number variants in high-through- put sequencing data by using Joint SLM algorithm. Nucleic Acids Res., submitted for publication.
34. Malhis, N. and Jones, S. J. M. 2010. High quality SNP calling using Illumina data at shallow coverage. Bioinformatics 26, 1029-1035.
35. Marth, G. T., Korf, I., Yandell, M. D., Yeh, R. T., Gu, Z., Zakeri, H., Stitziel, N. O., Hillier, L., Kwok, P. Y. and Gish W. R. 1999. A general approach to single-nucleotide poly- morphism discovery. Nat. Genet. 23, 452-456.
36. McKenna, A., Hanna, M., Banks, E., Sivachenko, A. and Cibulskis, K., et al. 2010. The Genome Analysis Toolkit: a MapReduce framework for analyzing next-generation DNA sequencing data. Genome Research 20, 1297-1303.
37. Milne, I., Bayer, M., Cardle, L., Shaw, P., Stephen, G., Wright, F. and Marshall, D. 2010. Tablet-next generation sequence assembly visualization. Bioinformatics 3, 401-402.
38. Mitra, R. D. and Church, G. M. 1999. In situ localized ampli- fication and contact replication of many individual DNA molecules. Nucleic Acids Res. 27, e34.
39. Nagalakshmi, U., Wang, Z., Waern, K., Shou, C., Raha, D., Gerstein, M. and Snyder, M. 2008. The transcriptional land- scape of the yeast genome defined by RNA sequencing.
Science 320, 1344-1349.
40. Ning, Z., Cox, A. J. and Mullikin, J. C. 2001. SSAHA: a fast search method for large DNA databases. Genome Res. 11, 1725-1729.
41. Nothnagel, M., Herrmann, A., Wolf, A., Schreiber, S., Platzer, M., Siebert, R., Krawczak, M. and Hampe, J. 2011.
Technology-specific error signatures in the 1000 Genomes Project data. Human Genome 130, 505-516. doi:10.1007/
s00439-011-0971-3.
42. Olshen, A. B., Venkatraman, E. S., Lucito, R. and Wigler, M. 2005. Circular binary segmentation for the analysis of array-based DNA copy number data. Biostatistics 5, 557-572.
43. Pareek, C. S., Smoczynski, R. and Tretyn, A. 2011. Sequencing technologies and genome sequencing. J. Appl. Genetics 52, 413-435.
44. Park, P. J. 2009. ChIP-seq: advantages and challenges of a maturing technology. Nat. Rev. Genet. 10, 669-680.
45. Schadt, E. E., Turner, S. and Kasarskis, A. 2010. A window into third generation sequencing. Hum. Mol. Genet. 19, R227- R240.
46. Scholz, M. B., Lo, C. and Chain, P. 2012. Next generation sequencing and bioinformatics bottlenecks: the current state of metagenomics data analysis. Curr. Opin. Biotechnol. 23, 9-15.
47. Shendure, J., Porreca, G. J., Reppas, N. B., Lin, X., Mc- Cutcheon, J. P., Rosenbaum, A. M., Wang, M. D., Zhang, K., Mitra, R. D. and Church, G. M. 2005. Accurate multiplex polony sequencing of an evolved bacterial genome. Science 309, 1728-1732.
48. Tawfik, D. S and Griffiths, A. D. 1998. Man-made cell-like compartments for molecular evolution. Nature Biotech. 16, 652-656.
49. Turcatti, G., Romieu, A., Fedurco, M. and Tairi, A. P. 2008.
A new class of cleavable fluorescent nucleotides: synthesis and optimization as reversible terminators for DNA se- quencing by synthesis. Nucleic Acids Res. 36, e25.
50. Whiteford, N., Skelly, T., Curtis, C., Ritchie, M. E., Löhr, A., Zaranek, A. W., Abnizova, I. and Brown, C. 2009. Swift:
primary data analysis for the Illumina Solexa sequencing platform. Bioinformatics 25, 2194-2199.
51. Xie, W., Wang, F., Guo, L., Chen, Z., Sievert, S. M., Meng, J., Huang, G., Li, Y., Yan, Q. and Wu, S. et al. 2011.
Comparative metagenomics of microbial communities in- habiting deep-sea hydrothermal vent chimneys with con- trasting chemistries. ISME J. 5, 414-426.
초록:차세대 염기서열 분석기법과 생물정보학 김기봉*
(상명대학교 공과대학 의생명공학과)
![Fig. 1. Advanced technological features of three leading second generation NGS platforms [43].](https://thumb-ap.123doks.com/thumbv2/123dokinfo/5011527.549412/3.892.162.727.762.1117/fig-advanced-technological-features-leading-second-generation-platforms.webp)
![Fig. 2. Advanced technological features of four leading third generation high throughput (HT) NGS platforms [43].](https://thumb-ap.123doks.com/thumbv2/123dokinfo/5011527.549412/5.892.166.726.156.519/fig-advanced-technological-features-leading-generation-throughput-platforms.webp)
![Table 3. A list of tools for the visualization of alignments or assemblies of short read data [32]](https://thumb-ap.123doks.com/thumbv2/123dokinfo/5011527.549412/7.892.81.809.976.1149/table-list-tools-visualization-alignments-assemblies-short-read.webp)
