Introduction
Bycatch reduction is one of the most important issues in fisheries management and resource maintenance, as demon- strated by its predominance in global research and symposia (Sea Grant, 2014). Reduction in the juvenile catch among bycatch or discard catch is key for resource recruitment and recovery of fisheries stocks. The size of the caught fish has mostly been controlled by mesh size and mesh opening, such as hanging ratio, including square mesh or grid interval as modification of the fishing gear (Chopin and Suuronen, 2009). Numerous studies have been carried out on bycatch reduction devices (BRDs) according to gear type, locality, species focused on selectivity, separating unwanted species, and preventing the catch of specific animals (Matsushita, 2000; Ryer, 2008; Ingólfsson, 2011). As a result, bycatch re- duction by BRD has gained importance, and some countries
have adopted BRDs as compulsory regulation for specific gear and species. However, reduction in juvenile catch as a primary objective has gained increasing attention for the re- sponse of fish, such as the optomotor response, maintaining relative position and speed to prevent escape through the mesh, and masking the effect of the blocking mesh by larger fish, especially those caught in towed fishing gear (Wardle, 1993; Kim et al., 2008). Therefore, active stimulating devices might provide a useful method for disturbing the optomotor behavior or to drive fish close to the mesh by fluttering the net or twine generated in the turbulent flow inside the cod end (Kim and Whang, 2010; Kim, 2011). More recently, tri- als have been carried out in water tanks with a shaking cod end moving up and down generated by an unbiased cap-like canvas attached at the end of the cod end to encourage the escape of juvenile fish positioned passively close to the net.
Effects on bycatch reduction in a shaking cod end generated by canvas in a shrimp beam trawl
Yonghae KIM*, Dae-Sung WHANG
Institute of Marine Industry, Department of Marine Production technology, Graduate School, Gyeongsang National University, Tongyeong 650-160, Korea
An active stimulating device, such as a fluttering net or canvas attached to the end of a cod end generating a shaking motion, could help to encourage the escape of juvenile fish positioned passively near the net. Field fishing trials using a shrimp beam trawl were carried out to examine the effect on the reduction of juvenile fish or other discard catch by generating a shaking movement of the cod end using an unbiased cap-like round canvas. The mean period of the shaking motion with the round canvas was〜14 s, and the mean amplitude was 0.4 m as measured by peak event analysis and the global wavelet method. The bycatch of juvenile fish in 14 trials decreased by〜30% and by 〜25% using a steady cod end for the total bycatch using a shaking cod end in the shrimp beam trawl, while the marketing catch was similar between steady and shaking cod ends. There was no dif- ference in the body size of the shrimp or fish and species composition between the steady and shaking cod ends. Above results demonstrate a new method for bycatch reduction using an active stimulating device, although more detailed studies are needed.
Keywords : Shrimp beam trawl, Shaking cod end, Bycatch reduction J Kor Soc Fish Technol, 50 (3), 342-350, 2014
http://dx.doi.org/10.3796/KSFT.2014.50.3.342
*Corresponding author: [email protected], Tel: 82-55-772-9183, Fax: 82-55-772-9189
< Original Article>
These trials have demonstrated a 30% reduction in juvenile catch (Kim, 2015).
Early trials used the shaking cod end shrimp beam trawl because of its feasibility and inshore small scale. In Korea, the species distribution caught with a shrimp beam trawl has been investigated off the southern (Oh et al., 2003; Oh, 2010;
Song et al., 2012; Park et al., 2013b; Seo et al., 2013) and the western coasts (Park et al., 2013a). Until recently, BRD experiments with shrimp trawls were mainly focused on sep- arating demersal fish from the main shrimp catch and high- lighting the fish passing out from the net (Jang et al., 2006;
He and Balzano, 2011, 2013). However, juvenile fish are in- evitably caught in a mixed catch along with garbage (Nunoo et al., 2009) or other sea animals, as well as the main shrimp catch, due to the smaller mesh size or smaller grid interval employed in the shrimp trawls. Furthermore, BRD was tri- aled as a grid method for separating fish passing out from the shrimp catch. However, the fact that some valuable shrimp were also passing the nets with the fish through net openings produced reluctance in fishers to use the grid sys- tem. Following the tank experiments of Kim (2014b), Fish- ing experiments were carried out to examine the effects on the reduction of juvenile fish or other discard catch by gen- erating a shaking motion in the cod end of the shrimp beam trawl using a round canvas in preliminary trials for practical application.
Materials and methods
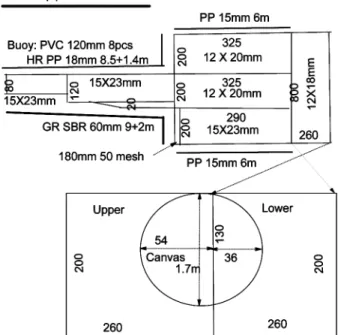
The used fishing gear was a traditional southern-type shrimp beam trawl in the fishing boat“Kumpo-ho”(2.99 G/T) in Tongyoung, with 20 m total net length, 7.5 m beam length, 4 m cod end length, and 18 mm nominal mesh size, as shown in Fig. 1. A round canvas (tarpaulin, 1 mm thick- ness, 1.7 m diameter) was attached at its upper end to a 54- mesh upper panel from the end of the cod end and its lower end to a 36-mesh lower panel from the end of the cod end, as shown in Fig. 1 and following the model experiments of Kim (2013b). A shaking canvas was fixed to the cod end mesh using 6-mm twine passed through the outer holes (15- cm interval) around the circumference of the canvas covering the end of the cod end and forming an unbiased cap (Fig. 2).
The shaking motion of the cod end was measured using a DST-tilt sensor (Star-Odi, Reykjavik, Iceland) fixed at the top-front of the canvas as diameter 15 mm, length 46 mm, weight in water 12 g, depth sensitivity±0.4%, tilt (yaw, pitch, roll)±1。,temperature±0.1。C and sampling interval
Fig. 2. The round canvas attached to the end of the cod end in the shrimp beam trawl.
Fig. 1. Design of the experimental shrimp beam trawl and a round canvas for generating a shaking motion of the cod end.
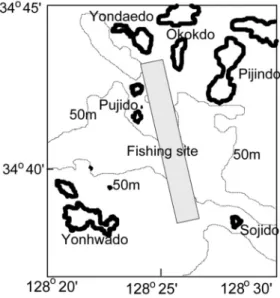
1s. The towing speed was measured using a Doppler log (201D, Marsh-McBirney Inc., Frederick, MD, USA) and ship-installed GPS. The fishing experiments were conducted at a depth range of 40-60 m between Yondaedo and Sojido, in the sea south of Tongyoung, as shown in Fig. 3. Fishing trials without the canvas as steady motion, and with the can- vas as shaking motion of the cod end, were repeated for 14 tows each from December 2013 to April 2014, as shown in Table 1. The length of tow line was 500 m, and the towing direction approximated the tidal direction. The mean towing
time was 104.5±27.3 min in the steady codend and 102.1±22.6 min in the shaking codend.
DST-tilt sensor measurements were recorded in trials T1 and T2 for the steady cod end and in trials S1 and S2 for the shaking cod end. The relevant shaking motion was detected by the depth change of the cod end as the vertical displace- ment, while three-dimensional tilt changes representing ro- tational motion also may have occurred. The traditional method for measuring the period, the fast Fourier transfor- mation (FFT) was unsuitable because the variation in the ab- solute data of fishing depth was greater than the periodic amplitude. Therefore, the depth data every second were recorded as the period of shaking motion applying the global wavelet method (GWM) using the software from Torrence and Compo (1998). However, the GWM cannot calculate amplitude as depth change and is unsuitable for periodic data of wide range. Therefore, an event analysis method using the peak and trough values in the depth difference data was adapted using self-made software (Narasimha et al., 2007;
Kim, 2014).
When the depth of the cod end was increased continuously for≥4 s until the peak, and then the depth was decreased consecutively for≥4 s, the peak depth was detected as a pos- itive peak value, while the lower trough value that decreased continuously for≥4 s was detected as a negative trough value. Accordingly, the minimum shaking period was limited to 7 s, and peak intervals shorter than 7s were excluded in Fig. 3. Location of the fishing trials in water south of Tongyoung,
Korea.
Table 1. Conditions in the fishing trials for steady cod end (T1-14) and shaking cod end (S1-14) carried out in 2014, except S1 and S2 in 2013
Steady codend Shaking codend
Trial Mon.Date Shot-Haul Co Speed
Tide Wave
Trial Mon.Date Shot-Haul Co Speed
Tide Wave
(Hr:Min) (deg) (kt) (m) (Hr:Min) (deg) (kt) (m)
T1 4.1 3:42-5:17 320 1.8 Flood 0.5 S1 12.24 8:00-9:30 310 1.7 Flood 1.0
T2 4.1 6:03-8:20 310 1.7 Flood 0.5 S2 12.24 10:20-11:50 310 1.8 Flood 1.0
T3 4.2 3:17-4:20 130 1.7 Ebb 0.5 S3 1.5 3:20-5:20 140 1.8 Ebb 1.0
T4 4.2 5:10-7:10 320 1.7 Flood 0.5 S4 1.5 6:00-7:30 320 1.8 Flood 1.0
T5 4.2 8:14-9:35 320 1.8 Flood 0.5 S5 4.11 5:55-7:55 310 1.7 Flood 1.0
T6 4.3 5:48-7:50 310 1.8 Flood 0.5 S6 4.11 9:02-10:12 320 1.8 Flood 1.0
T7 4.5 5:30-7:00 320 1.7 Flood 1.0 S7 4.12 6:05-7:35 310 1.7 Flood 0.5
T8 4.5 7:30-9:40 310 1.7 Flood 1.0 S8 4.12 8:14-9:44 130 1.8 Ebb 0.5
T9 4.7 4:17-5:10 140 1.7 Ebb 1.0 S9 4.14 6:22-8:12 320 1.7 Flood 0.5
T10 4.8 5:00-7:00 130 1.7 Ebb 0.5 S10 4.14 8:55-10:25 130 1.8 Ebb 0.5
T11 4.9 2:35-4:30 320 1.7 Flood 0.5 S11 4.15 5:53-8:13 320 1.7 Flood 0.5
T12 4.9 5:10-7:20 130 1.7 Ebb 0.5 S12 4.15 9:00-10:30 140 1.8 Ebb 0.5
T13 4.10 5:32-7:40 140 1.7 Ebb 1.0 S13 4.16 6:00-7:30 310 1.8 Flood 0.5
T14 4.10 8:41-10:00 130 1.8 Ebb 1.0 S14 4.16 8:20-10:50 130 1.7 Ebb 0.5
our method. The amplitude of the shaking motion as depth variation for each period was estimated from the depth dif- ference between the peak and trough event, which only oc- curred consecutively as a pair. Statistical analysis was performed using the Kolmogorov-Smirnov method for shak- ing period and amplitude between steady and shaking cod ends when those data displayed a non-normal distribution.
After each haul, the catches in the cod end were sorted and measured as the marketing catch (mainly fish and shrimp) and bycatch (fish and other garbage) using a balance (scale 30 kg, 0.1 kg accuracy). The catch per hour as a catch per unit effort (CPUE) of the beam trawl was estimated as the relevant catch divided by towing time, as shown in Table 1.
One box of the bycatch (about 27 kg) from each haul was sorted and measured mainly for fish and shrimp as total body length and girth using a 1-mm scale and body weight using a digital balance (0.01 g accuracy, EB-4000HU; Shimadzu, Otsu, Shiga, Japan). The body length was measured from orbit to the end of telson in the shrimp and from snout to the end of caudal fin in the fish. Statistical analysis for each catch by weight was carried out using a t- and F-test between steady and shaking cod ends.
Results and discussion
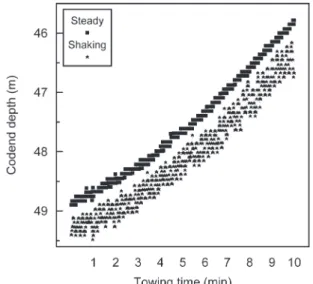
The variation in cod end depth with towing time when shaken by the round canvas was periodic and greater than that with a steady cod end without a canvas, as shown in Fig.
4, which illustrates an example of short towing time. The time series of the shaking amplitudes as the difference in the cod end depth by peak event analysis are shown in Fig. 5.
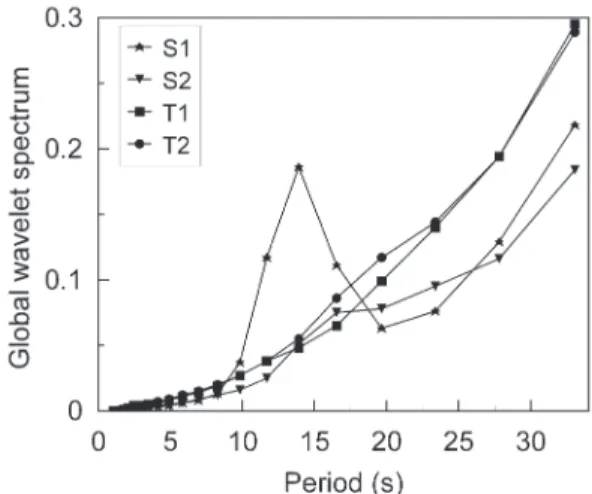
The shaking amplitude with the round canvas was greater than the steady cod end without a canvas and decreased with towing time, possibly due to the effect of accumulation of the catch. The frequency distributions of the shaking period by peak event analysis for four trials are shown in Fig. 6, and the shaking periods by the GWM are shown in Fig. 7. The frequency of the period in trial S1 with a peak period of 14 s was significantly greater than that in trials S1, T1, and T2 by peak event analysis and by the GWM (p<0.013), while no difference was observed among the remaining trials. The fre- quency distributions of the shaking amplitude by peak event
Fig. 4. Variation in the cod end depth with towing time when held steady without canvas (trial T1) and shaken by canvas (trial S1).
Fig. 5. Amplitude of the cod end depth by towing time using peak event analysis when steady (trial T1) and shaken by canvas (trial S1).
Fig. 6. Frequency of the shaking period by peak event analysis for four fishing trials.
analysis for four trials are shown in Fig. 8. The frequency of the amplitude in trial S1 was significantly greater than trials S1, T1, and T2 by peak event analysis (p<0.0001), and no difference was observed among the other trials.
The shaking period and amplitude shown as the mean
value±SD for each fishing trial by peak event analysis are presented in Table 2. The shaking amplitude with the canvas was greater than that of the steady cod end without a canvas (p<0.05). The mean shaking period in trial S1 by peak event analysis was similar to the shaking period by the GWM. The shaking motion of the cod end with a round canvas in trial S1 had a significantly greater period and amplitude than in trial S2. More than 20% of the peaks in trial S1 were of a larger amplitude (≥0.6 m, which was half of the cod end height), although the mean amplitude, 0.4 m, was one-third of the cod end height, which was smaller than the amplitude ratio in the model experiments of Kim (2013b). In addition, the mean shaking period of 14 s was longer than the period of the model cod end in the field towing experiments of Kim (2013b). The shaking motion in trial S2 was not significantly different in shaking period and amplitude under the same conditions as trial S1 and only differed in the tidal state. Trial S1 was towed at nearly static tide, while trial S2 was towed at strong neap tide. Differences may exist in the relative flow velocity near the seabed caused by the different tidal flows, although the surface flow and boat speed measured by GPS were similar. The effects of tidal flow and the diagonal mo- tion of the shaking motion produced by the position of the round canvas at the end of the cod end should be investigated in the future.
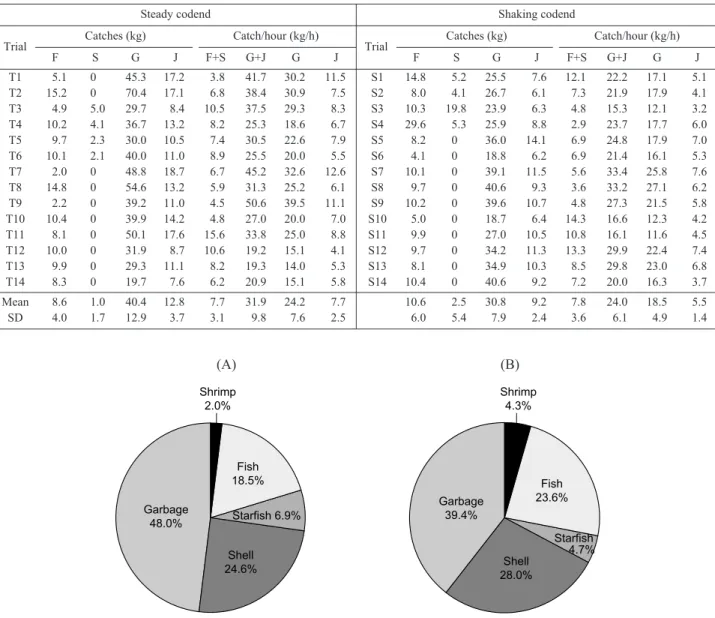
The catches from the steady and shaking cod ends in the shrimp beam trawl are shown in Table 3. The mean market- ing catch per hour (CPUE) for fish and shrimp of 7.8±3.6 kg for the shaking cod end was similar to the 7.7±3.1 kg catch of the steady cod end and not significantly different by t-test (p>0.1). However, the mean CPUE of the bycatch in- cluding juvenile fish and garbage (G + J) of 24.0±6.1 kg in the shaking cod end was smaller than the 31.9±9.8 kg recorded for the steady cod end and significantly different (p<0.01). Among the bycatches, the mean CPUE of juvenile Table 2. Mean±SD of the shaking period and amplitude by peak event analysis.
Fig. 7. Frequency of the shaking period by global wavelet method for four fishing trials.
Fig. 8. Frequency of the shaking amplitude by peak event analysis for four fishing trials.
Motion Trial Period±SD
(s) n Normal
distribution
Amplitude±SD
(m) n Normal
distribution
Steady T1
T2
14.3 ± 6.5 14.2 ± 6.5
279 292
No No
0.17 ± 0.04 0.17 ± 0.05
107 128
Yes No
Shaking S1
S2
13.9 ± 3.4 14.9 ± 5.4
399 329
No No
0.37 ± 0.14 0.24 ± 0.11
377 250
No Yes
fish (J) of 5.5±1.4 kg for the shaking cod end was smaller than the 7.7±2.5 kg of the steady cod end and significantly different (p<0.004). Similarly, the mean CPUE of the garbage (G) of 18.5±4.9 kg for the shaking cod end was sig- nificantly smaller than the 24.2±7.6 kg recorded for the steady cod end (p<0.014). The catch of juvenile fish in the shaking cod end of the shrimp beam trawl was reduced by
〜30% compared to the steady cod end, and the shaking cod end achieved a 25% decrease in total bycatch and 24% de- crease in discarded garbage. These reductions in the shaking cod end attached to the shrimp beam trawl were similar to
those observed in the model shaking cod end in a tank by Kim (2015). However, the retained number of juvenile fish in a shrimp trawl in the northeastern United States was sim- ilar between a rope grid BRD and traditional cod end (He and Balzano, 2013). Most of the BRD trials have reported a reduction in the juvenile fish discard, but no reports to date have described the decrease in garbage discard (Deval et al., 2006; Ingólfsson et al., 2011). However, the experimental shaking cod end in this study demonstrated a reduction in ju- venile catch, as well as filtering of garbage by the active mo- tion of shaking generated by the round canvas.
Table 3. Marketing catch of fish (F), shrimp (S), bycatch of juvenile fish (J) and other garbage (G) in the steady and shaking cod end of the shrimp beam trawl
Steady codend Shaking codend
Trial Catches (kg) Catch/hour (kg/h)
Trial Catches (kg) Catch/hour (kg/h)
F S G J F+S G+J G J F S G J F+S G+J G J
T1 5.1 0 45.3 17.2 3.8 41.7 30.2 11.5 S1 14.8 5.2 25.5 7.6 12.1 22.2 17.1 5.1
T2 15.2 0 70.4 17.1 6.8 38.4 30.9 7.5 S2 8.0 4.1 26.7 6.1 7.3 21.9 17.9 4.1
T3 4.9 5.0 29.7 8.4 10.5 37.5 29.3 8.3 S3 10.3 19.8 23.9 6.3 4.8 15.3 12.1 3.2
T4 10.2 4.1 36.7 13.2 8.2 25.3 18.6 6.7 S4 29.6 5.3 25.9 8.8 2.9 23.7 17.7 6.0
T5 9.7 2.3 30.0 10.5 7.4 30.5 22.6 7.9 S5 8.2 0 36.0 14.1 6.9 24.8 17.9 7.0
T6 10.1 2.1 40.0 11.0 8.9 25.5 20.0 5.5 S6 4.1 0 18.8 6.2 6.9 21.4 16.1 5.3
T7 2.0 0 48.8 18.7 6.7 45.2 32.6 12.6 S7 10.1 0 39.1 11.5 5.6 33.4 25.8 7.6
T8 14.8 0 54.6 13.2 5.9 31.3 25.2 6.1 S8 9.7 0 40.6 9.3 3.6 33.2 27.1 6.2
T9 2.2 0 39.2 11.0 4.5 50.6 39.5 11.1 S9 10.2 0 39.6 10.7 4.8 27.3 21.5 5.8
T10 10.4 0 39.9 14.2 4.8 27.0 20.0 7.0 S10 5.0 0 18.7 6.4 14.3 16.6 12.3 4.2
T11 8.1 0 50.1 17.6 15.6 33.8 25.0 8.8 S11 9.9 0 27.0 10.5 10.8 16.1 11.6 4.5
T12 10.0 0 31.9 8.7 10.6 19.2 15.1 4.1 S12 9.7 0 34.2 11.3 13.3 29.9 22.4 7.4
T13 9.9 0 29.3 11.1 8.2 19.3 14.0 5.3 S13 8.1 0 34.9 10.3 8.5 29.8 23.0 6.8
T14 8.3 0 19.7 7.6 6.2 20.9 15.1 5.8 S14 10.4 0 40.6 9.2 7.2 20.0 16.3 3.7
Mean 8.6 1.0 40.4 12.8 7.7 31.9 24.2 7.7 10.6 2.5 30.8 9.2 7.8 24.0 18.5 5.5
SD 4.0 1.7 12.9 3.7 3.1 9.8 7.6 2.5 6.0 5.4 7.9 2.4 3.6 6.1 4.9 1.4
Fig. 9. Frequency of bycatch in the steady cod end (A) and shaking cod end (B).
Shrimp 2.0%
Fish
18.5% Fish
23.6%
Shell
24.6% Shell
28.0%
Garbage 48.0%
Garbage 39.4%
Starfish 6.9%
Starfish 4.7%
Shrimp 4.3%
(A) (B)
The catch compositions of the bycatch in one box (〜27 kg) from the steady and shaking cod ends are shown in Fig.
9. The ratios of juvenile fish and garbage were significantly different between the steady and shaking cod end (p<0.05), while the other ratios of bycatch composition were not sig- nificantly different between the steady and shaking cod end.
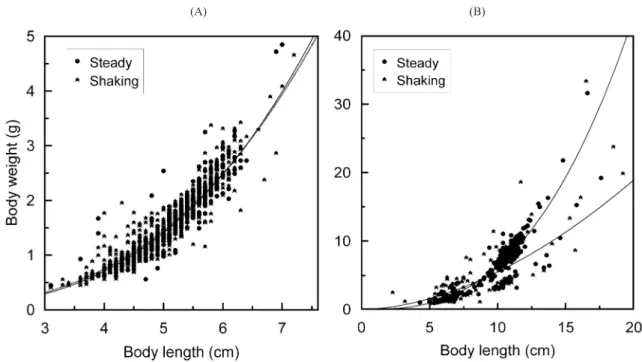
The relationship between body length (BL, cm) and body weight (W, g) of the shrimp Palaemon gravieri (suffix s) and fish, the greenling Hexagrammos agrammus (suffix f), of the discard catch are shown in Fig. 10 for the steady and shaking cod ends, calculated from the following equations.
Ws(steady)〓0.00962 BLs3.1(n〓301, r2〓0.822) (1) Ws(shaking)〓0.0119 BLs2.98(n〓694, r2〓0.878) (2) Wf(steady)〓0.0108 BLf2.77(n〓257, r2〓0.892) (3) Wf(shaking)〓0.0882 BLf1.79(n〓72, r2〓0.682) (4) The body sizes of the shrimp and fish in the discard catch were not significantly different between the steady and shak- ing cod ends (p>0.1).
The relationship between body length (BL, cm) and body girth (G, cm) of the redfin velvetfish (suffix v) in the discard catch is shown in Fig. 11 for the steady and shaking cod ends,
calculated from the equations below. The body girth of the redfin velvetfish as bycatch displays no significant difference between the steady and shaking cod end (p>0.1).
Fig. 11. Comparison of the discard redfin velvetfish Hypodytes rubripinnis in body length and girth between the steady and shaking cod end.
Fig. 10. Comparison of discard fish size as body length and body weight between the steady (T14) and shaking cod end (S6) for the shrimp Palaemon gravieri (A) and fish Hexagrammos agrammus (B) of discard catches.
(A) (B)
Gv(steady) = 1.1 + 0.538 BLv(n〓42, r2〓0.675) (5) Gv(shaking) = 0.06 + 0.682BLv(n〓111, r2〓0.736)(6) The frequencies of girth distribution for all shrimp and fish are shown in Fig. 12 as two peaks. The left peak representing the smaller girth shows shrimp and small anchovy, and the right peak representing the larger girth illustrates other fish, including, e.g., the spottybelly greenling and redfin vel- vetfish. The girth frequency was not significantly different between the steady and shaking cod ends (p>0.1). At least 30% of the retained shrimp and anchovy were smaller than the mesh girth (〜3.6 cm) in both cod ends, possibly due to a masking effect.
The main catches of our fishing trials were lower than the average for the year of the trials (Jang et al., 2009; Cho et al., 2013), while the bycatch including garbage were unable to compare due to lack of previous data. The selectivity of juvenile fish was not affected by the size frequency, possibly due to too small a mesh size in the cod end of the shrimp trawl, although an obvious effect was observed on the reduc- tion in weight of juvenile fish and garbage. The shaking mo- tion generated by a round canvas can cause an unbalanced lifting force, causing cod end drag with increased towing time under turbulent flow (Kim, 2013b). Therefore, the tow- ing velocity of the cod end on the seabed (Kim, 2012) rela- tive to the tidal flow could also affect the period and
amplitude of the shaking motion. In addition, the drag of the shaking canvas could add to that of the cod end, but its effect might be reduced by that of the accumulation of catch from the end of the cod end. The fishing trials to compare the catch were carried out for the steady and shaking cod ends on dif- ferent days due to the difficulty of attaching a canvas and chartering a fishing boat. Therefore, fishing experiments were performed 14 trials for each cod end in the same fishing grounds and verified the results statistically, as shown in the results presented above. However, further studies should be undertaken to develop improvements in the shaking motion and provide a direct comparison of the catch relative to time and fishing ground between steady and shaking cod ends.
Acknowledgements
Authors thank a skipper H.D. Moon of shrimp beam trawler, and students S.K. Lee, N.K. Park for fishes meas- urements, and reviewers’useful comments. This work was supported by the National Research Foundation of Korea (NRF-2010-0022707).
References
Cho SK, Kim HY, Park CD and Cha BJ. 2013. Catches characteris- tics between fishing area and non-fishing area in the shrimp beam trawl of Geoje waters, Korea. J Kor Soc Fish Technol, 49, 377-384. (http://dx.doi.org/10.3796/KSFT.2013.49.4.377) Chopin F and Suuronen P. 2009. The development of international guidelines on bycatch management and reduction of discards.
ICES CM 2009/M:01.
Deval MC, Bök T, Ates C and ¨Ozbilgin H. 2006. Selectivity of PE and PA material codends for rose shrimp (Parapenaus lon- girostris) in Turkish twin rigged beam trawl fishery. Fish Res 81, 72-79. (doi:10.1016/j.fishres.2006.05.007)
He P and Balzano V. 2013. A new shrimp trawl combination grid system that reduces small shrimp and finfish bycatch. Fish Res 140, 20-27. (http://dx.doi.org/10.1016/j.fishres.2012.11.009) He P and Balzano V. 2011. Rope Grid: A new grid design to further reduce finfish bycatch in the Gulf of Maine pink shrimp fishery.
Fish Res 111, 100-107. (doi:10.1016/j.fishres.2011.07.001) Ingólfsson ÓA. 2011. The effect of forced mesh opening in the
upper panel of a Nephrops trawl on size selection of Nephrops, haddock and whiting. Fish Res 108, 218-222. (doi:10.1016/
j.fishres.2010.11.024) Fig. 12. Frequency of girth distribution for the discard fish from
the steady and shaking cod ends.
Jang CS, Cho YH, Lim CR, Kim BY and An YS. 2009. An analysis on catch of the shrimp beam trawl fishery in Korea coastal sea.
J Kor Soc Fish Technol, 45, 1-13. (DOI:10.3796/KSFT.
2008.45.1.001)
Jang CS, Kim KH, An YS, Park KJ and Park JO. 2006. Develop- ment of the selective fishing gear in shrimp beam trawl fishery.
Final report to the Ministry of Maritime and Fisheries. p.91.
Kim YH. 2011. Effects on the escapement of juvenile bastard hal- ibut Paralichthys olivaceus of actively stimulating devices in- side a model codend. Fis Aquat Sci 14, 62-69.
Kim YH. 2012. Analysis of turbulence and tilt by in-situ measure- ments inside the codend of a shrimp beam trawl. Ocean Eng 53, 6-15. ( http://dx.doi.org/10.1016/j.oceaneng.2012.06.014) Kim YH. 2013a. Fluttering characteristics of the ropes and nets as an
active stimulating device inside the cod end of a trawl net. Fish Aquat Sci 16, 101-108. (http://dx.doi.org/10.5657/FAS.2013.
0101)
Kim YH. 2013b. Shaking motion characteristics of a cod-end caused by an attached circular canvas during tank experiments and sea trials. Fish Aquat Sci 16, 211-220. ( http://dx.doi.org/10.5657/
FAS.2013.0211)
Kim YH. 2014. Comparison of the tilt variation between otter board and codend of a bottom trawl during fishing operations. Fish and Aquat Sci 17, 145-153. ( http://dx.doi.org/10.5657/
FAS.2014.0145)
Kim YH. 2015. Escape response of juvenile fish by the shaking of a codend using a cap-like canvas in tank experiments. Fish Res (in press)
Kim YH, Wardle CS and An YS. 2008. Herding and escaping re- sponses of juvenile roundfish to square mesh window in a trawl cod end. Fish Sci 74, 1-7.
Kim YH and Whang DS. 2010. An actively stimulating net panel and rope array inside a model cod-end to increase juvenile red seabream escapement. Fish Res 106, 71-75. ( http://dx.doi.org/
10.1016/j.fishres.2010.07.005)
Matsushita Y. 2000. Bycatch reduction technologies for towed fish- ing gears. Nippon Suisan Gakkaishi 66, 261-268.
Narasimha R, Kumar SR, Prabhu A and Kailas SV. 2007. Turbulent flux events in a nearly neutral atmospheric boundary layer. Phil Trans R Soc A 365, 841-858.
Nunoo FKE, Boateng JO, Ahulu AM, Agyekum KA and Sumaila UR. 2009. When trash fish is treasure: The case of Ghana in
West Africa. Fish Res 96, 167-172. (doi:10.1016/j.fishres.
2008.10.010)
Oh CW. 2010. Seasonal bycatch variations in the shrimp beam trawl fishery of coastal Wan-do, Korea. Kor J Fish Aquat Sci 43, 69-77
Oh TY, Kim JI, Koh JL, Cha HK and Lee JH. 2003. Species Com- position and Seasonal Variations of the Shrimp Beam Trawl Fisheries in the Adjacent Waters Geomundo, Korea. J Kor Soc Fish Technol 39, 63-76.
Park J, Jo HS, Im YJ, Cha BY, Kwon DH, Ryu DK and Hwang HJ.
2013a. Species composition and community structure caught by shrimp beam trawl in the marine ranching ground of Taean, Korea. J Kor Soc Fish Technol, 49, 238-249. (http://dx.doi.org/
10.3796/KSFT.2012.49.3.238)
Park JY, Kang HS, Kang JH, Kim JK, Ryu JH and Kim DS. 2013b.
Yearly Fluctuation in the Fish Species Composition of Shrimp Beam Trawls off Maemuldo, Korea, during 2007-2009. Kor J Fish Aquat Sci 46, 619-625. (http://dx.doi.org/10.5657/
KFAS.2013.0619)
Ryer CH. 2008. A review of flatfish behavior relative to trawls. Fish Res 90, 138-146. (doi:10.1016/j.fishres.2007.10.005) Sea Grant. 2014. Fisheries Bycatch- Global issues and creative so-
lutions. 29th Lowell Wakerfield fisheries symposium (May 13- 16, 2014, Anchorage, Alaska. USA. Program and Abstracts, pp.106.
Seo YI, Lee JH, Oh TY, Lee JB, Choi YM and Lee DW. 2013. Dis- tribution and seasonal variations of fisheries resources captured by the beam trawl in Namhae island, J Kor Soc Fish Technol 49, 419-431. (http://dx.doi.org/10.3796/KSFT.2013.49.4.419) Song MY, Kim JI, Kim ST, Lee JH and Lee JB. 2012. Seasonal vari- ation in species composition of catch by a coastal beam trawl in Jinhae and Jinju Bay, Korea. J Kor Soc Fish Technol 48, 428- 444. (http://dx.doi.org/10.3796/KSFT.2012.48.4.428) Torrence C and Compo GP. 1998. A practical guide to wavelet
analysis. Bull Am Meteorol Soc 79, 61-78.
Wardle CS. 1993. Fish behaviour and fishing gear. In: Behaviour of Teleost Fishes. 2nd Ed., Pitcher T.J. ed. Chapman & Hall, London, UK, 609-644.
2014. 7. 26 Received 2014. 8. 13 Revised 2014. 8. 15 Accepted