This is an open-access article distributed under the terms of the Creative Commons Attribution Non-Commercial License (http://creativecommons.org/
licenses/by-nc/4.0/), which permits unrestricted non-commercial use, distribution, and reproduction in any medium, provided the original work is properly cited.
CC
Bone loss-related factors in tissue and bone level dental implants:
a systematic review of clinical trials
Hamed Mortazavi
1, Amin Khodadoustan
2, Aida Kheiri
3, Lida Kheiri
41
Department of Oral Medicine, School of Dentistry, Shahid Beheshti University of Medical Sciences, Tehran,
2
Member of Iranian Association of Periodontology, Private Practice, Tehran,
3
Student Research Committee, School of Dentistry, Shahid Beheshti University of Medical Sciences, Tehran,
4
Department of Oral and Maxillofacial Surgery, School of Dentistry, Islamic Azad University, Isfahan (Khorasgan) Branch, Isfahan, Iran
Abstract (J Korean Assoc Oral Maxillofac Surg 2021;47:153-174)
Dental implants are popular for dental rehabilitation after tooth loss. The goal of this systematic review was to assess bone changes around bone-level and tissue-level implants and the possible causes. Electronic searches of PubMed, Google Scholar, Scopus, and Web of Science, and a hand search lim- ited to English language clinical trials were performed according to PRISMA (Preferred Reporting Items for Systematic Reviews and Meta-Analysis) guidelines up to September 2020. Studies that stated the type of implants used, and that reported bone-level changes after insertion met the inclusion criteria. The risk of bias was also evaluated. A total of 38 studies were included. Eighteen studies only used bone-level implants, 10 utilized tissue- level designs and 10 observed bone-level changes in both types of implants. Based on bias assessments, evaluating the risk of bias was not applicable in most studies. There are vast differences in methodologies, follow-ups, and multifactorial characteristics of bone loss around implants, which makes direct comparison impossible. Therefore, further well-structured studies are needed.
Key words: Alveolar bone loss, Bone-implant interface, Bone resorption, Dental implants, Dental implant-abutment design
[paper submitted 2020. 10. 25 / revised 2021. 1. 19 / accepted 2021. 2. 5]
Copyright © 2021 The Korean Association of Oral and Maxillofacial Surgeons. All rights reserved.
I. Introduction
Bone loss following tooth extraction is an important issue that requires rehabilitation
1-4. Treatments such as removable or fixed prostheses do not typically provide satisfactory func- tional and aesthetic outcomes
1. Endosseous implants with predictable long-term success rates (SCRs) have become popular in overcoming the limitations of conventional treat- ments and improving the quality of life
1,3,5.
Survival and SCRs of implants are related to surround- ing bone quality, quantity, and preoperative mucosal tissue
characteristics
2,6. Patient age, oral hygiene, presence of dental plaque and microorganisms, implant location and features, surgical procedure, and prosthesis type are statistically sig- nificant factors for SCR
7. Moreover, marginal bone around implants is affected by various factors including smoking, periodontal disease, socket condition, healing after insertion, and implant abutment microgaps
8.
Many studies have analyzed ways to improve implant features since the macrostructure, microstructure, and bio- mechanical design of implants affect marginal bone-level changes and subsequent tissue interactions
1,2,4. Roughened hydrophilic implant surfaces enhance bone healing, osteo- genesis, and bone-implant contact (BIC) by accelerating cell migration, proliferation, and differentiation
4,9,10. SLActive surfaces have been created by coarse grit blasting and acid etching in order to promote fatigue strength with the mecha- nism of stabilizing blood clots in the defect area without af- fecting osseointegration
1,4,11.
Two types of implants have been introduced based on their macrostructure characteristics: bone-level (BL) and tissue- level (TL). BL types are placed with the neck of the implant Lida Kheiri
Department of Oral and Maxillofacial Surgery, School of Dentistry, Islamic Azad University, Isfahan (Khorasgan) Branch, University Blvd, Arqavanieh, Jey Street, Isfahan 81595-158, Iran
TEL: +98-9132748055 E-mail: [email protected]
ORCID: https://orcid.org/0000-0001-9471-9902
at the level of the crestal bone and can cause marginal bone loss (MBL) following bacterial contamination or inflam- mation
12,13. Therefore, the TL design has been proposed to eliminate inflammation and subsequent bone loss. However, it may cause a gray metallic shadow through the soft tissue because of the metallic tulip-shaped shoulder
12,13. BL im- plants are the implant of choice in esthetic areas since they can be placed more apically and create a desired emergence profile
14,15. It has been reported that SLActive BL implants induce bone apposition
4.
Implants are designed to be used as a one-piece or two- piece instrument. More crestal bone loss in two-piece im- plants may be due to microgaps at the implant-abutment interface for bacterial colonization of the implant sulcus or establishment of an adequate dimensioned biologic width (BW) to be associated with marginal bone resorption
16,17. The implant–abutment microgap is possibly related to the precision fit between the implant components subsequent to the implant system design and the torque used to connect the components
17. Researchers have attempted to introduce designs to eliminate the microgaps
18. The gaps and the fol- lowing disadvantages have been diminished using TL im- plants
12,13. One-piece implants could provide a more effective seal against microbial leakage by reducing the size of the microgaps resulting in a reduction in inflammatory reac- tions around the implant-abutment interface and subsequent marginal bone resorption
19. The abutment-fixture connection (AFC) is an important factor for the long-term stability of im- plants and hard and soft tissue due to the presence of micro- gaps
14,20. Therefore, the prevention of microbial leakage at the AFC is a major challenge for the construction of two-piece implant systems to minimize inflammatory reactions and to maximize peri-implant bone stability
21.
The most common AFCs are external hexagonal, internal hexagonal, conical, and mixed
17,21. All the connections exhibit a certain amount of microgaps and bacterial microleakage, although fewer are seen in the conical and mixed connection systems
21. The most favorable results have been reported when implants with an internal Morse-taper connection have been utilized, resulting in minimal bacterial leakage to the threaded aspect of the AFC. However, dynamic loading increases the potential for such bacterial penetration
17,21. Plat- form-switching has been introduced as a method to shift the stress inward and enhance hard tissue stability, papilla main- tenance, and the soft tissue seal
16,19,22-25. A study reported 0.7 mm versus 2.5 mm bone loss compared to the conventional connection design after 6 months of loading while the other
design exhibited 0.12 mm versus 0.29 mm bone loss after one year
16. Another assessment demonstrated no bone loss after 2 years
16. Until now, no implant system or connection design has been able to provide a perfect outcome at the AFC.
Minimizing bone loss both horizontally and vertically around implants, which is essential for good aesthetic out- comes of implant treatment, has been the most challenging issue in implantology. Therefore, the aim of the present sys- tematic review is to review and compare BL changes after the insertion of BL and TL designs of implants and assess factors affecting bone loss.
II. Materials and Methods
This systematic review was conducted according to the Cochrane Handbook PRISMA (Preferred Reporting Items for Systematic Reviews and Meta-Analysis) guidelines.
All clinical trials which focused on BL change after the placement of BL or TL implants were included. The search was limited to English-language studies up to September 2020. Abstracts, letters, and reviews were excluded.
Type of participants: Any humans with edentulous regions in one or both jaws with BL and TL implant placements were included. Studies which focused on the soft tissue, aesthetic results, or did not mention bone resorption for each kind of implant separately were excluded.
Type of interventions: Studies that had used one or more BL or TL implants were included. Studies were excluded if they had focused on biomechanical features or the survival rate (SVR) of implants or had evaluated implant stability and micromotions.
Type of outcome measures: BL changes after implant in- sertion were reported by measuring MBL (mm), mean bone fill (mm
2), BIC (mm), new bone height (mm), and mean bone level (mm).
Information sources: Our electronic database consisted of PubMed/MEDLINE, Google Scholar, Scopus, and Web of Science. Additionally, a hand search was performed to assess publications that were not electronically distinguished.
Search strategy: An electronic search was performed in or- der to select relevant studies using the following terms: “bone level implant”, “tissue level implant”, “bone level implant”
AND/OR “tissue level implant”, “bone/tissue level implant”
AND “marginal bone loss”, “bone/tissue level implant” AND
“bone resorption”, and “bone/tissue level implant” AND
“marginal bone level change”.
Study selection: Two independent authors conducted the
search based on the aforementioned keywords. In addition, they carried out the initial screening of titles and abstracts from selected studies in accordance with the eligibility crite- ria. Any disagreement between the authors was resolved fol- lowing a discussion with the third author (periodontist).
Data collection process: Review and data extraction were performed according to the PRISMA flow diagrams. Two au- thors also reviewed full texts of the articles and extracted all the data independently.
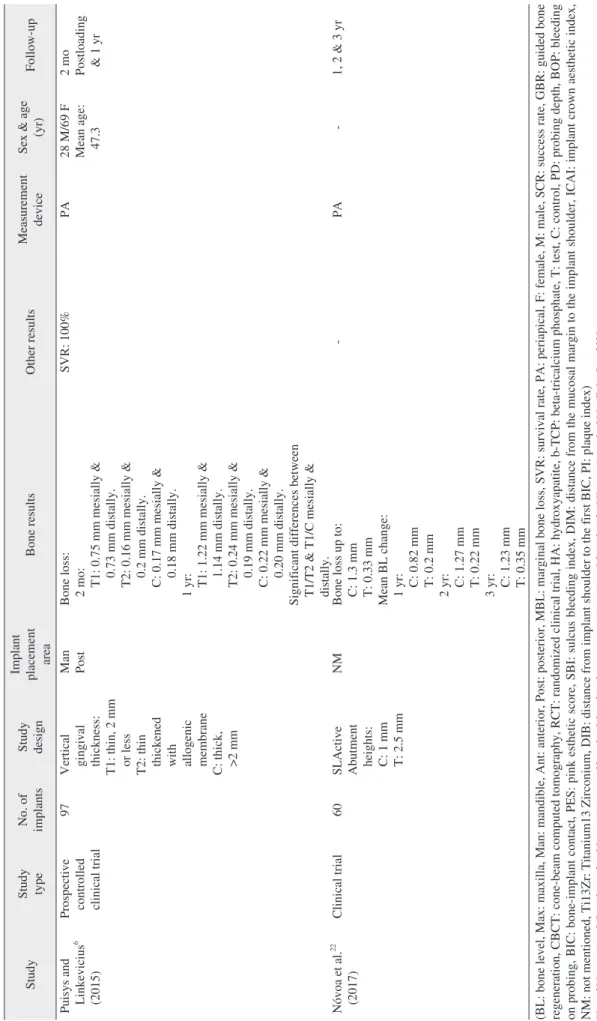
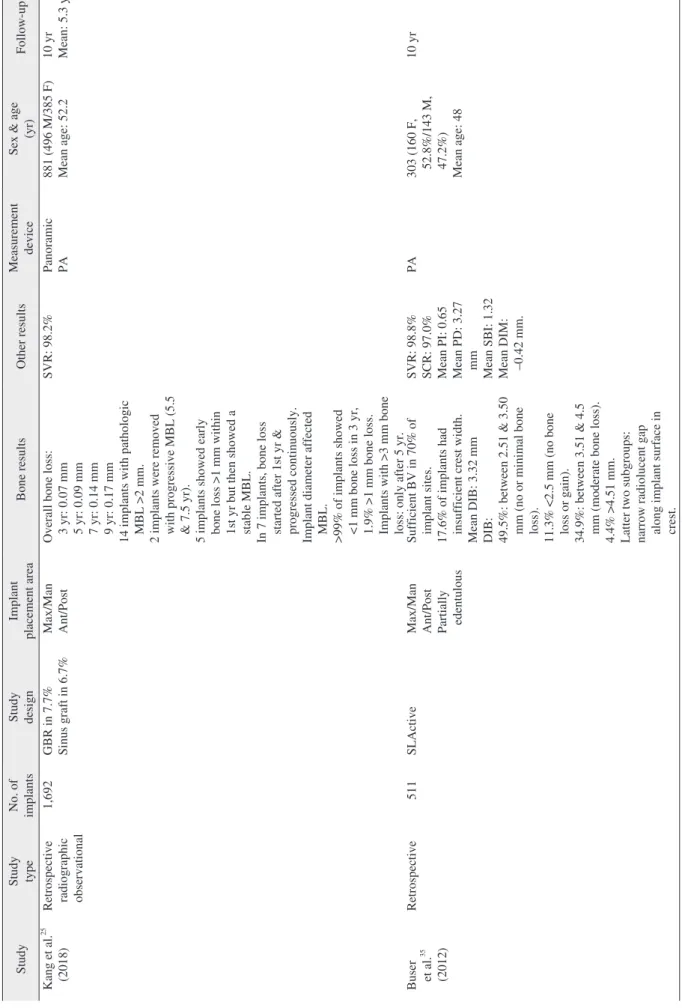
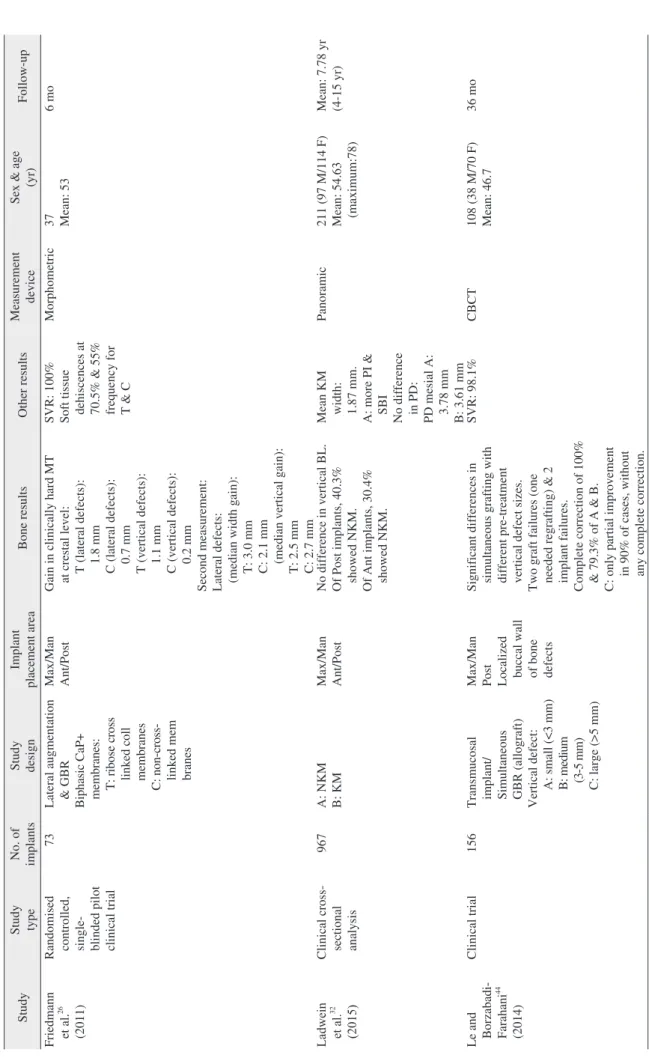
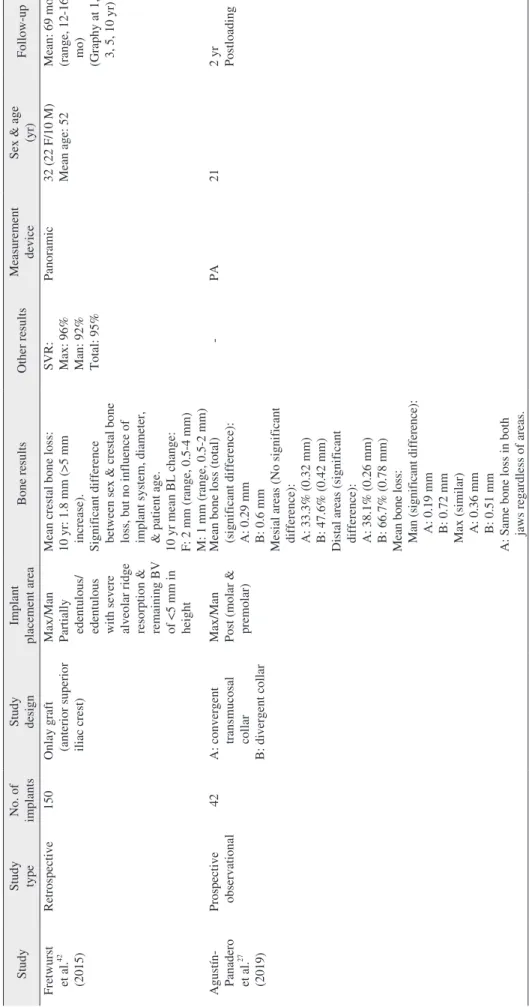
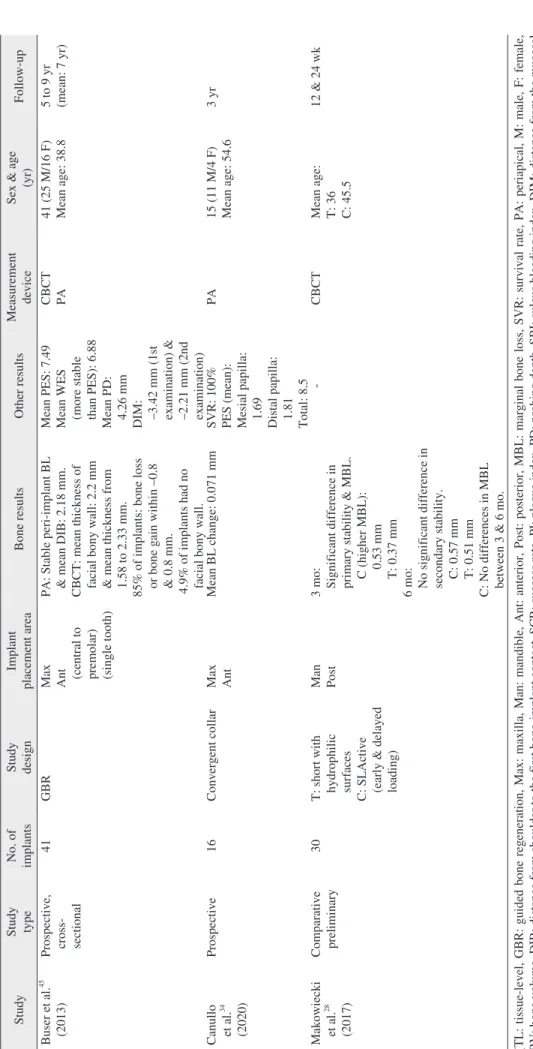
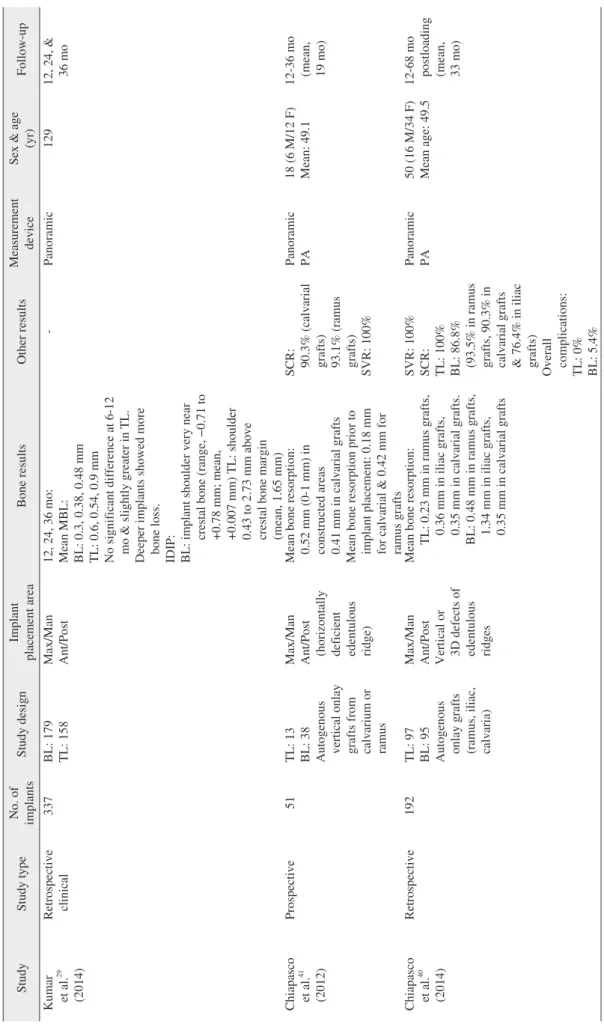
Data items: Results and data extracted from the included studies were classified in tables with the following columns:
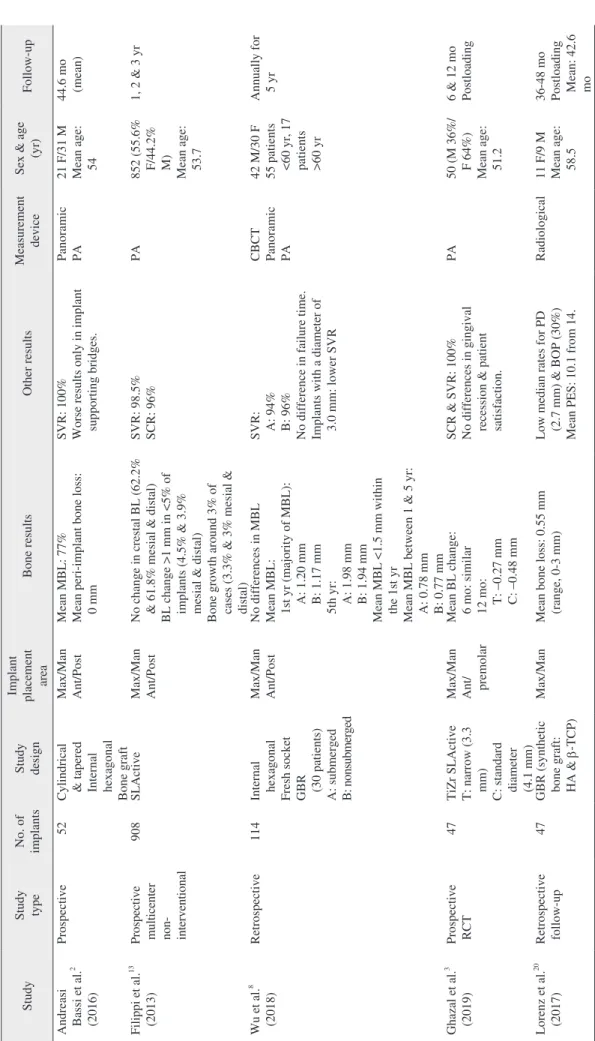
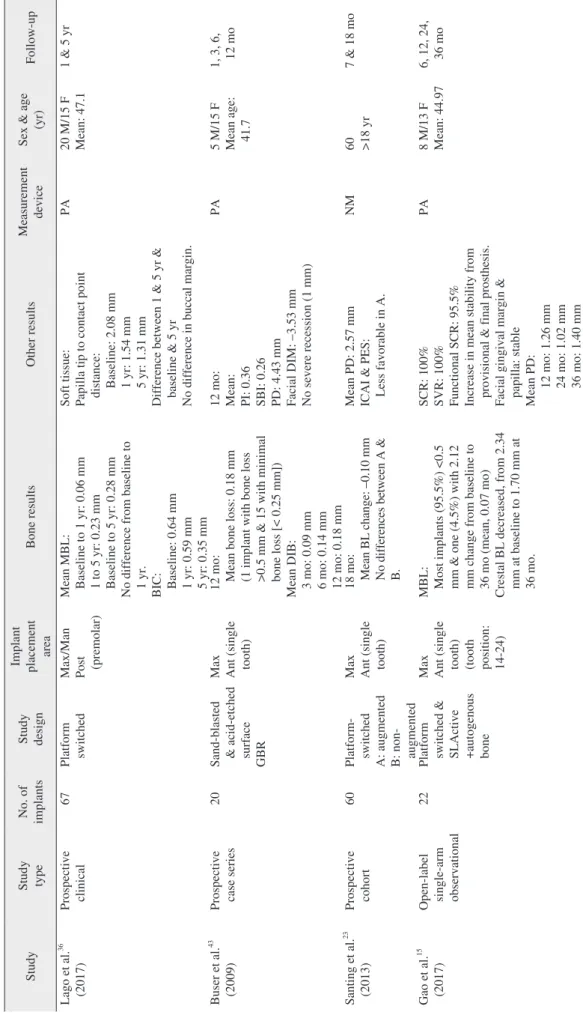
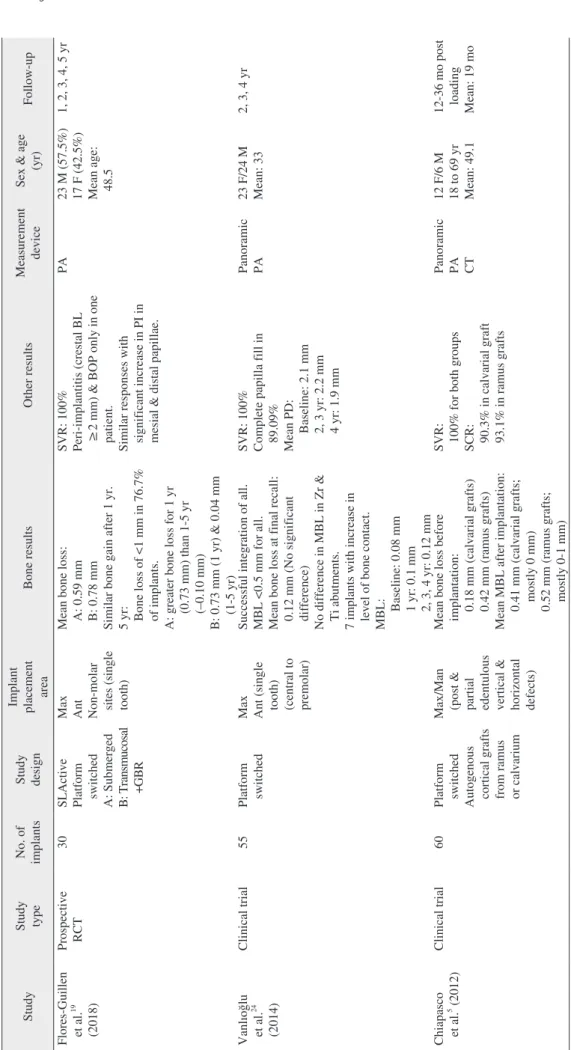
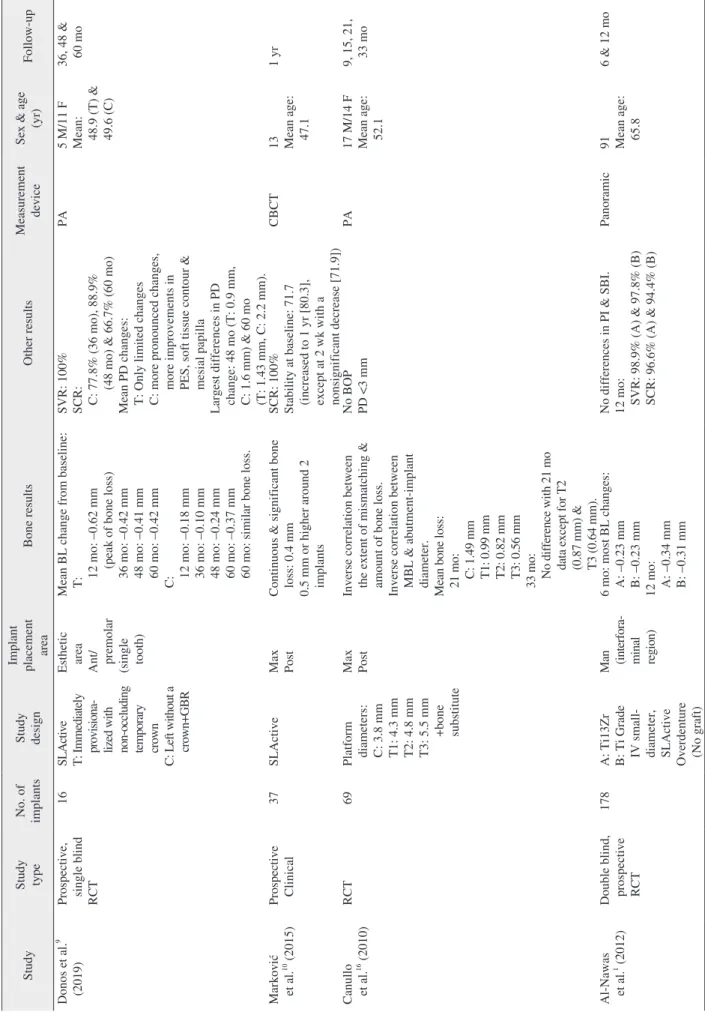
study type, study design, implant placement area, bone re- sults, non-related bone results, measurement device, defect model, and follow-up.(Tables 1-3)
Risk of bias assessment: The criteria used for assessing the quality of the included studies was obtained from the Co- chrane Center. The provided guidelines consisted of the fol- lowing parameters: random sequence generation, allocation concealment, blinding of participants and personnel, blinding of outcome assessment, incomplete outcome data addressed, and selective reporting. The degree of bias was categorized as low risk, unclear risk, and high risk. The risk of bias was evaluated independently by two masked reviewers. All dis- agreements were resolved by consensus.
III. Results
After the initial search, 173 articles were obtained. Fol- lowing the removal of duplicates and irrelevant studies, a total of 97 studies were selected. Full texts of the selected articles were screened and with respect to eligibility criteria, 59 studies that either were in vivo or had focused on soft tis- sue results, biomechanical features, or implant stability with no bone-related reports were excluded. Finally, 38 articles were included in our systematic review.(Fig. 1) Data were extracted and further classified in three separate tables.(Tables 1-3) Table 1 consists of 18 studies that used only BL implants and 10 articles that used TL implants were placed in Table 2.
Table 3 comprises 10 studies that compared BL change re- sults of both BL and TL implants.
Patient sex, age, and number: Among the included stud- ies, 10 did not mention patient sex
1,10,22,23,26-31. Between all the studies mentioning mean age, maximum mean ages in Tables 1-3 were 65.8
1, 54.63
32, and 60
30, respectively, while mini- mum amounts were 33
24, 36
28, and 39
33in order.
Comparing patient numbers in the studies, the highest number of patients in a single study was 881
25with the lowest
being 13 in another study
10,31. Only 2 studies did not indicate the number of patients
22,28.
Implant numbers: Various implant numbers were reported.
The highest and lowest implant numbers used in the studies were 908
13and 16
9in Table 1, 1,692
25and 16
34in Table 2, and 337
29and 32
31in Table 3, respectively.
Study design: Various methodologies had been used in the included articles. Seven studies utilized implants with SLAc- tive surfaces
1,9,10,13,22,28,35, while 7 studies focused on the plat- form switched implants effects
5,23,24,36-39. Two articles inserted implants with both mentioned characteristics
15,19.
Seven studies applied grafts in their surgical proce- dures
2,16,40in which 4 of them indicated the use of autogenous bone grafts
5,15,41,42. In addition, 10 studies mentioned guided bone regeneration (GBR) in their methods
3,8,9,19,20,25,26,43-45.
Implant placement areas: In 10 articles, implants were inserted in the maxilla
10,15,16,19,23,24,33,34,43,45, while 4 studies chose the mandible as the placement area
1,6,28,31. In 22 studies, implants were inserted in both jaws
2,3,5,8,13,20,25-27,29,30,32,35-42,44,46. Two studies did not state which jaw was used
9,22.
Measurement devices: The majority of studies used only periapical radiographs to estimate bone resorption around the implants
3,6,9,13,15,16,19,22,27,33-37,39,43. Four studies utilized cone- beam computed tomography (CBCT) images
10,28,29,44, while 3 studies used panoramic images
1,32,42. A combination of panoramic plus periapical images and CBCT plus periapical images were used in 6 studies
2,5,24,25,30,40and 4 studies
31,38,45,47, respectively. One article evaluated MBL through the help of CBCTs, panoramics, and periapical images
8, while another used panoramics, periapicals, and computed tomography (CT) scan images
5. One study reported a radiological device to measure bone levels, but did not provide specifics
20. Only one study used a morphometric method
26, while one did not mention the measurement device
23.
Follow-ups: Follow-up duration varied widely. In Table 1, the shortest and the longest follow-ups were one month
43and 5 years
8, respectively; in Table 2, these values were 3 months
28and 15 years
32, respectively. The longest period of follow-up was 7.8 years
33, while the shortest period was 3 months
31among the studies that used both BL and TL im- plants.
Bone results: Bone status after implant inser-
tion varied. A lar ge number of studies indicated bone
loss
5,6,16,19,20,22,24,25,27,33,39,40-43. MBL and BL changes were
presented in 13 studies
2,5,8,15,24,25,28-31,36,38,47and 11 stud-
ies
1,3,9,15,22,23,32,34,37,42,45, respectively. Other bone results in-
volved reports of BIC
36and distances from implant shoulder
Table 1. Studies on inserted BL implants Study Study type No. of implants Study design
Implant placement area Bone results Other results Measurement device Sex & age (yr) Follow-up Andreasi Bassi et al.
2(2016)
Prospective 52 Cylindrical & tapered Internal hexagonal Bone graft Max/Man Ant/Post Mean MBL: 77% Mean peri-implant bone loss: 0 mm SVR: 100% Worse results only in implant supporting bridges.
Panoramic PA 21 F/31 M Mean age: 54
44.6 mo (mean) Filippi et al.
13(2013) Prospective multicenter non- interventional
908 SLActive Max/Man Ant/Post No change in crestal BL (62.2% & 61.8% mesial & distal) BL change >1 mm in <5% of implants (4.5% & 3.9% mesial & distal) Bone growth around 3% of cases (3.3% & 3% mesial & distal) SVR: 98.5% SCR: 96% PA 852 (55.6% F/44.2% M) Mean age: 53.7
1, 2 & 3 yr Wu et al.
8(2018) Retrospective 114 Internal hexagonal Fresh socket GBR (30 patients) A: submerged B: nonsubmerged
Max/Man Ant/Post No differences in MBL Mean MBL: 1st yr (majority of MBL): A: 1.20 mm B: 1.17 mm 5th yr: A: 1.98 mm B: 1.94 mm Mean MBL <1.5 mm within the 1st yr Mean MBL between 1 & 5 yr: A: 0.78 mm B: 0.77 mm SVR: A: 94% B: 96% No difference in failure time. Implants with a diameter of 3.0 mm: lower SVR
CBCT Panoramic PA
42 M/30 F 55 patients <6 0 yr , 1 7 patients >60 yr
Annually for 5 yr Ghazal et al.
3(2019) Prospective RCT 47 TiZr SLActive T: narrow (3.3 mm) C: standard diameter (4.1 mm)
Max/Man Ant/ premolar Mean BL change: 6 mo: similar 12 mo: T: –0.27 mm C: –0.48 mm SCR & SVR: 100% No differences in gingival recession & patient satisfaction.
PA 50 (M 36%/ F 64%) Mean age: 51.2
6 & 12 mo Postloading Lorenz et al.
20(2017) Retrospective follow-up 47 GBR (synthetic bone graft: HA & b-TCP)
Max/Man Mean bone loss: 0.55 mm (range, 0-3 mm) Low median rates for PD (2.7 mm) & BOP (30%) Mean PES: 10.1 from 14.
Radiological 11 F/9 M Mean age: 58.5
36-48 mo Postloading Mean: 42.6 mo
Table 1. Continued Study Study type No. of implants Study design
Implant placement area Bone results Other results Measurement device Sex & age (yr) Follow-up Lago et al.
36(2017) Prospective clinical 67 Platform switched Max/Man Post (premolar)
Mean MBL: Baseline to 1 yr: 0.06 mm 1 to 5 yr: 0.23 mm Baseline to 5 yr: 0.28 mm No difference from baseline to 1 yr. BIC: Baseline: 0.64 mm 1 yr: 0.59 mm 5 yr: 0.35 mm Soft tissue: Papilla tip to contact point distance: Baseline: 2.08 mm 1 yr: 1.54 mm 5 yr: 1.31 mm Difference between 1 & 5 yr & baseline & 5 yr No di ffe re nc e i n buc ca l m argi n.
PA 20 M/15 F Mean: 47.1 1 & 5 yr Buser et al.
43(2009) Prospective case series 20 Sand-blasted & acid-etched surface GBR
Max Ant (single tooth)
12 mo: Mean bone loss: 0.18 mm (1 implant with bone loss >0.5 mm & 15 with minimal bone loss [< 0.25 mm]) Mean DIB: 3 mo: 0.09 mm 6 mo: 0.14 mm 12 mo: 0.18 mm 12 mo: Mean: PI: 0.36 SBI: 0.26 PD: 4.43 mm Facial DIM: –3.53 mm No severe recession (1 mm) PA 5 M/15 F Mean age: 41.7
1, 3, 6, 12 mo Sa nt in g et a l.
23(2013) Prospective cohort 60 Platform- switched A: augmented B: non- augmented
Max Ant (single tooth) 18 mo: Mean BL change: –0.10 mm No differences between A & B.
Mean PD: 2.57 mm ICAI & PES: Less favorable in A.
NM 60 >18 yr 7 & 18 mo Gao et al.
15(2017) Open-label single-arm observational
22 Platform switched & SLActive +autogenous bone
Max Ant (single tooth) (tooth position: 14-24)
MBL: Most implants (95.5%) <0.5 mm & one (4.5%) with 2.12 mm change from baseline to 36 mo (mean, 0.07 mo) Crestal BL decreased, from 2.34 mm at baseline to 1.70 mm at 36 mo.
SCR: 100% SVR: 100% Functional SCR: 95.5% Increase in mean stability from pr ovi si on al & fi na l p rost he si s. Facial gingival margin & papilla: stable Mean PD: 12 mo: 1.26 mm 24 mo: 1.02 mm 36 mo: 1.40 mm
PA 8 M/13 F Mean: 44.97 6, 12, 24, 36 mo
Table 1. Continued Study Study type No. of implants Study design
Implant placement area Bone results Other results Measurement device Sex & age (yr) Follow-up Flores-Guillen et al.
19(2018)
Prospective RCT 30 SLActive Platform switched A: Submerged B : T ra nsm uc osa l +GBR
Max Ant Non-molar si te s (si ng le tooth)
Mean bone loss: A: 0.59 mm B: 0.78 mm Similar bone gain after 1 yr. 5 yr: Bone loss of <1 mm in 76.7% of implants. A: greater bone loss for 1 yr (0.73 mm) than 1-5 yr (–0.10 mm) B: 0.73 mm (1 yr) & 0.04 mm (1-5 yr) SVR: 100% Peri-implantitis (crestal BL ≥2 mm) & BOP only in one patient. Similar responses with significant increase in PI in mesial & distal papillae.
PA 23 M (57.5%) 17 F (42.5%) Mean age: 48.5
1, 2, 3, 4, 5 yr Vanlıoğlu et al.
24(2014)
Clinical trial 55 Platform switched Max Ant (single tooth) (central to premolar)
Successful integration of all. MBL <0.5 mm for all. Mean bone loss at final recall: 0.12 mm (No significant difference) No difference in MBL in Zr & Ti abutments. 7 implants with increase in level of bone contact. MBL: Baseline: 0.08 mm 1 yr: 0.1 mm 2, 3, 4 yr: 0.12 mm SVR: 100% Complete papilla fill in 89.09% Mean PD: Baseline: 2.1 mm 2, 3 yr: 2.2 mm 4 yr: 1.9 mm
Panoramic PA 23 F/24 M Mean: 33 2, 3, 4 yr Chiapasco et al.
5(2012) Clinical trial 60 Platform switched Autogenous cortical grafts from ramus or calvarium
Max/Man (post & partial edentulous vertical & horizontal defects) Mean bone loss before implantation: 0.18 mm (calvarial grafts) 0.42 mm (ramus grafts) Mean MBL after implantation: 0.41 mm (calvarial grafts; mostly 0 mm) 0.52 mm (ramus grafts; mostly 0-1 mm) SVR: 100% for both groups SCR: 90.3% in calvarial graft 93.1% in ramus grafts
Panoramic PA CT
12 F/6 M 18 to 69 yr Mean: 49.1
12-36 mo post loading Mean: 19 mo
Table 1. Continued Study Study type No. of implants Study design
Implant placement area Bone results Other results Measurement device Sex & age (yr) Follow-up Donos et al.
9(2019) Prospective, single blind RCT
16 SLActive T: Immediately provisiona - lized with non-occluding temporary crown C: Left without a crown+GBR
Esthetic area Ant/ premolar (single tooth)
Mean BL change from baseline: T: 12 mo: –0.62 mm (peak of bone loss) 36 mo: –0.42 mm 48 mo: –0.41 mm 60 mo: –0.42 mm C: 12 mo: –0.18 mm 36 mo: –0.10 mm 48 mo: –0.24 mm 60 mo: –0.37 mm 60 mo: similar bone loss.
SVR: 100% SCR: C: 77.8% (36 mo), 88.9% (48 mo) & 66.7% (60 mo) Mean PD changes: T: Only limited changes C: more pronounced changes, more improvements in PES, soft tissue contour & mesial papilla Largest differences in PD change: 48 mo (T: 0.9 mm, C: 1.6 mm) & 60 mo (T: 1.43 mm, C: 2.2 mm).
PA 5 M/11 F Mean: 48.9 (T) & 49.6 (C)
36, 48 & 60 mo Marković et al.
10(2015) Prospective Clinical 37 SLActive Max Post Continuous & significant bone loss: 0.4 mm 0.5 mm or higher around 2 implants
SCR: 100% Stability at baseline: 71.7 (increased to 1 yr [80.3], except at 2 wk with a nonsi gni fi ca nt de cre ase [71.9]) CBCT 13 Mean age: 47.1
1 yr Canullo et al.
16(2010) RCT 69 Platform diameters: C: 3.8 mm T1: 4.3 mm T2: 4.8 mm T3: 5.5 mm +bone substitute
Max Post Inverse correlation between the extent of mismatching & amount of bone loss. Inverse correlation between MBL & abutment-implant diameter. Mean bone loss: 21 mo: C: 1.49 mm T1: 0.99 mm T2: 0.82 mm T3: 0.56 mm 33 mo: No difference with 21 mo data except for T2 (0.87 mm) & T3 (0.64 mm).
No BOP PD <3 mm PA 17 M/14 F Mean age: 52.1
9, 15, 21, 33 mo Al-Nawas et al.
1(2012) Double blind, prospective RCT
178 A: Ti13Zr B: Ti Grade IV small- diameter, SLActive Overdenture (No graft) Man (interfora - minal region) 6 mo: most BL changes: A: –0.23 mm B: –0.23 mm 12 mo: A: –0.34 mm B: –0.31 mm No differences in PI & SBI. 12 mo: SVR: 98.9% (A) & 97.8% (B) SCR: 96.6% (A) & 94.4% (B) Panoramic 91 Mean age: 65.8
6 & 12 mo
Table 1. Continued Study Study type No. of implants Study design
Implant placement area Bone results Other results Measurement device Sex & age (yr) Follow-up Puisys and Linkevicius
6(2015)
Prospective controlled clinical trial
97 Vertical gingival thickness: T 1: th in , 2 m m or less T2: thin thickened with allogenic membrane C: thick, >2 mm
Man Post Bone loss: 2 mo: T1: 0.75 mm mesially & 0.73 mm distally. T2: 0.16 mm mesially & 0.2 mm distally. C: 0.17 mm mesially & 0.18 mm distally. 1 yr: T1: 1.22 mm mesially & 1.14 mm distally. T2: 0.24 mm mesially & 0.19 mm distally. C: 0.22 mm mesially & 0.20 mm distally. Significant differences between T1/T2 & T1/C mesially & distally.
SVR: 100% PA 28 M/69 F Mean age: 47.3
2 mo Postloading & 1 yr Nóvoa et al.
22(2017) Clinical trial 60 SLActive Abutment heights: C: 1 mm T: 2.5 mm
NM Bone loss up to: C: 1.3 mm T: 0.33 mm Mean BL change: 1 yr: C: 0.82 mm T: 0.2 mm 2 yr: C: 1.27 mm T: 0.22 mm 3 yr: C: 1.23 mm T: 0.35 mm - PA - 1, 2 & 3 yr (BL: bone level, Max: maxilla, Man: mandible, Ant: anterior, Post: posterior, MBL: marginal bone loss, SVR: survival rate, PA: periapical, F: female, M: male, SCR: success rate, GBR: guided bone regeneration, CBCT: cone-beam computed tomography, RCT: randomized clinical trial, HA: hydroxyapatite, b-TCP: beta-tricalcium phosphate, T: test, C: control, PD: probing depth, BOP: bleeding on probing, BIC: bone-implant contac t, PES: pink esthetic score, SBI: sulcus bleeding index, DIM: distance from the mucosal margin to the implant shoulder, ICAI: implant crown aesthetic index,
NM: not mentioned, Ti13Zr: Titanium13 Zirconium, DIB: distance from implant shoulder to the first BIC, PI: plaque index) Hamed Mortazavi et al: Bone loss-related factors in tissue and bone level dental implants: a systematic review of clinical tria
ls. J Korean Assoc Oral Maxillofac Surg 20 21
Table 2. Studies on inserted TL implants Study Study type No. of implants Study design Implant placement area Bone results Other results Measurement device Sex & age (yr) Follow-up Ka ng e t a l.
25(2018) Retrospective radiographic observational
1,692 GBR in 7.7% Sinus graft in 6.7% Max/Man Ant/Post Overall bone loss: 3 yr: 0.07 mm 5 yr: 0.09 mm 7 yr: 0.14 mm 9 yr: 0.17 mm 14 implants with pathologic MBL >2 mm. 2 implants were removed with progressive MBL (5.5 & 7.5 yr). 5 implants showed early bone loss >1 mm within 1st yr but then showed a stable MBL. In 7 implants, bone loss started after 1st yr & progressed continuously. Implant diameter affected MBL. >99% of implants showed <1 mm bone loss in 3 yr, 1.9% >1 mm bone loss. Implants with >3 mm bone loss: only after 5 yr.
SVR: 98.2% Panoramic PA 881 (496 M/385 F) Mean age: 52.2 10 yr Mean: 5.3 yr Buser et al.
35(2012)
Retrospective 511 SLActive Max/Man Ant/Post Partially edentulous
Sufficient BV in 70% of implant sites. 17.6% of implants had insufficient crest width. Mean DIB: 3.32 mm DIB: 49.5%: between 2.51 & 3.50 mm (no or minimal bone loss). 11.3% <2.5 mm (no bone loss or gain). 34.9%: between 3.51 & 4.5 mm (moderate bone loss). 4.4% >4.51 mm. Latter two subgroups: narrow radiolucent gap along implant surface in crest.
SVR: 98.8% SCR: 97.0% Mean PI: 0.65 Mean PD: 3.27 mm Mean SBI: 1.32 Mean DIM: –0.42 mm.
PA 303 (160 F, 52.8%/143 M, 47.2%) Mean age: 48
10 yr
Table 2. Continued Study Study type No. of implants Study design Implant placement area Bone results Other results Measurement device Sex & age (yr) Follow-up Friedmann et al.
26(2011) Randomised controlled, single- blinded pilot clinical trial
73 Lateral augmentation & GBR Biphasic Ca P+ membranes: T: ribose cross linked coll membranes C: non-cr oss- linked mem branes
Max/Man Ant/Post Gain in clinically hard MT at crestal level: T (lateral defects): 1.8 mm C (lateral defects): 0.7 mm T (vertical defects): 1.1 mm C (vertical defects): 0.2 mm Second measurement: Lateral defects: (median width gain): T: 3.0 mm C: 2.1 mm (median vertical gain): T: 2.5 mm C: 2.7 mm SVR: 100% Soft tissue dehiscences at 70.5% & 55% frequency for T & C
Morphometric 37 Mean: 53 6 mo Ladwein et al.
32(2015)
Clinical cross- sectional analysis 967 A: NKM B: KM Max/Man Ant/Post No difference in vertical BL. Of Post implants, 40.3% showed NKM. Of Ant implants, 30.4% showed NKM.
Mean KM width: 1.87 mm. A: more PI & SBI No difference in PD: PD mesial A: 3.78 mm B: 3.61 mm Panoramic 211 (97 M/114 F) Mean: 54.63 (maximum:78)
Mean: 7.78 yr (4-15 yr) Le and Borzabadi- Farahani
44(2014)
Clinical trial 156 Transmucosal implant/ Simultaneous GBR (allograft) Vertical defect: A: sm al l (<3 m m ) B: medium (3-5 mm) C: large (>5 mm) Max/Man Post Localized buccal wall of bone defects
Significant differences in simultaneous grafting with different pre-treatment vertical defect sizes. Two graft failures (one needed regrafting) & 2 implant failures. Complete correction of 100% & 79.3% of A & B. C: only partial improvement in 90% of cases, without any complete correction.
SVR: 98.1% CBCT 108 (38 M/70 F) Mean: 46.7 36 mo
Table 2. Continued Study Study type No. of implants Study design Implant placement area Bone results Other results Measurement device Sex & age (yr) Follow-up Fretwurst et al.
42(2015) Retrospective 150 Onlay graft (anterior superior iliac crest)
Max/Man Partially edentulous/ edentulous with severe alveolar ridge resorption & remaining BV of <5 mm in height Mean crestal bone loss: 10 yr: 1.8 mm (>5 mm increase). Significant difference between sex & crestal bone loss, but no influence of implant system, diameter, & patient age. 10 yr mean BL change: F: 2 mm (range, 0.5-4 mm) M: 1 mm (range, 0.5-2 mm) SVR: Max: 96% Man: 92% Total: 95%
Panoramic 32 (22 F/10 M) Mean age: 52 Mean: 69 mo (range, 12-165 mo) (Graphy at 1, 3, 5, 10 yr) Agustín- Panadero et al.
27(2019)
Prospective observational 42 A: convergent transmucosal collar B: divergent collar Max/Man Post (molar & premolar)
Mean bone loss (total) (significant difference): A: 0.29 mm B: 0.6 mm Mesial areas (No significant difference): A: 33.3% (0.32 mm) B: 47.6% (0.42 mm) Distal areas (significant difference): A: 38.1% (0.26 mm) B: 66.7% (0.78 mm) Mean bone loss: Ma n (si gn if ic an t d if fe re nc e) : A: 0.19 mm B: 0.72 mm Max (similar) A: 0.36 mm B: 0.51 mm A: Same bone loss in both jaws regardless of areas.
- PA 21 2 yr Postloading
Table 2. Continued Study Study type No. of implants Study design Implant placement area Bone results Other results Measurement device Sex & age (yr) Follow-up Buser et al.
45(2013) Prospective, cross- sectional 41 GBR Max Ant (central to premolar) (single tooth)
PA: Stable peri-implant BL & mean DIB: 2.18 mm. CBCT: mean thickness of facial bony wall: 2.2 mm & mean thickness from 1.58 to 2.33 mm. 85% of implants: bone loss or bone gain within –0.8 & 0.8 mm. 4.9% of implants had no facial bony wall.
Mean PES: 7.49 Mean WES (more stable than PES): 6.88 Mean PD: 4.26 mm DIM: –3.42 mm (1st examination) & –2.21 mm (2nd examination)
CBCT PA 41 (25 M/16 F) Mean age: 38.8 5 to 9 yr (mean: 7 yr) Canullo et al.
34(2020)
Prospective 16 Convergent collar Max Ant Mean BL change: 0.071 mm SVR: 100% PES (mean): Mesial papilla: 1.69 Distal papilla: 1.81 Total: 8.5
PA 15 (11 M/4 F) Mean age: 54.6 3 yr Makowiecki et al.
28(2017)
Comparative preliminary 30 T: short with hydrophilic surfaces C: SLActive (early & delayed loading)
Man Post 3 mo: Significant difference in primary stability & MBL. C (higher MBL): 0.53 mm T: 0.37 mm 6 mo: No significant difference in secondary stability. C: 0.57 mm T: 0.51 mm C: No differences in MBL between 3 & 6 mo.
- CBCT Mean age: T: 36 C: 45.5
12 & 24 wk (TL: tissue-level, GBR: guided bone regeneration, Max: maxilla, Man: mandible, Ant: anterior, Post: posterior, MBL: marginal bone loss, SVR: survival rate, PA: periapical, M: male, F: female, BV: bone volume, DIB: distance from shoulder to the first bone-implant contact, SCR: success rate, PI: plaque index, PD: probing depth, SBI: sulcus bleeding index, DIM: distance from the mucosal margin to the implant shoulder, CaP: calcium-phosphate, T: test, C: control, MT: mineralized tissue, NKM: nonkeratinized mucosa, CBCT: cone beam computed tomography, BL: bone level, WES:
white esthetic score, PES: pink esthetic score) Hamed Mortazavi et al: Bone loss-related factors in tissue and bone level dental implants: a systematic review of clinical tria
ls. J Korean Assoc Oral Maxillofac Surg 20 21
Table 3. Studies that inserted both BL & TL implants Study Study type No. of implants Study design Implant placement area Bone results Other results Measurement device Sex & age (yr) Follow-up Kumar et al.
29(2014)
Retrospective clinical 337 BL: 179 TL: 158 Max/Man Ant/Post 12, 24, 36 mo: Mean MBL: BL: 0.3, 0.38, 0.48 mm TL: 0.6, 0.54, 0.9 mm No significant difference at 6-12 mo & slightly greater in TL. Deeper implants showed more bone loss. IDIP: BL: implant shoulder very near crestal bone (range, −0.71 to +0.78 mm; mean, +0.007 mm) TL: shoulder 0.43 to 2.73 mm above crestal bone margin (mean, 1.65 mm)
- Panoramic 129 12, 24, & 36 mo Chiapasco et al.
41(2012)
Prospective 51 TL: 13 BL: 38 Autogenous vertical onlay grafts from calvarium or ramus Max/Man Ant/Post (horizontally deficient edentulous ridge) Mean bone resorption: 0.52 mm (0-1 mm) in constructed areas 0.41 mm in calvarial grafts Mean bone resorption prior to implant placement: 0.18 mm for calvarial & 0.42 mm for ramus grafts SCR: 90.3% (calvarial grafts) 93.1% (ramus grafts) SVR: 100%
Panoramic PA 18 (6 M/12 F) Mean: 49.1 12-36 mo (mean, 19 mo) Chiapasco et al.
40(2014)
Retrospective 192 TL: 97 BL: 95 Autogenous onlay grafts (ramus, iliac, calvaria) Max/Man Ant/Post Vertical or 3D defects of edentulous ridges Mean bone resorption: TL: 0.23 mm in ramus grafts, 0.36 mm in iliac grafts, 0.35 mm in calvarial grafts. BL: 0.48 mm in ramus grafts, 1.34 mm in iliac grafts, 0.35 mm in calvarial grafts
SVR: 100% SCR: TL: 100% BL: 86.8% (93.5% in ramus grafts, 90.3% in calvarial grafts & 76.4% in iliac grafts) Overall complications: TL: 0% BL: 5.4%
Panoramic PA 50 (16 M/34 F) Mean age: 49.5 12-68 mo postloading (mean, 33 mo)
Table 3. Continued Study Study type No. of implants Study design Implant placement area Bone results Other results Measurement device Sex & age (yr) Follow-up Lopez et al.
30(2016) Retrospective cohort 150 Cylindrical 76 in F 74 in M GBR Max/Man Ant/Post Mean MBL: 92%. Mean bone loss: 0 mm Mean bone loss: BL: 0.12 mm TL: 0.04 mm SVR: 98.7% SCR: 92% Panoramic PA Mean age: 60 Mean: 84 mo Vianna et al.
47(2018) Prospective, split-mouth RCT
40 TL: 20 BL: 20 Max/Man Ant/Post Mean MBL up to 24 mo: TL: 0.75 mm BL: 0.70 mm Implant insertion: TL: 1.48 mm BL: 0.08 mm Prosthesis Installation: TL: 2.22 mm BL: 0.67 mm 6 mo: TL: 2.32 mm BL: 0.62 mm 24 mo: TL: 2.14 mm BL: 0.77 mm No significant difference for PI & BOP. 80% of sites in both with at least one bleeding site at 12 mo & 90% at 24 mo. Similar PD
CBCT PA 20 (with history of chronic periodontitis) (6 M/14 F) Mean age: 49.13
Implant insertion, Prosthesis installation, 6 & 24 mm postloading Fernández- Formoso et al.
39(2012)
RCT 114 TL: Standard matched BL: Platform switched
Max/Man Post Mean bone loss (significant difference): BL: 0.01 mm TL: 0.42 mm Mean of DIB (significant difference between groups): TL: 0.42 mm (significant difference) BL: –0.01 mm (no significant difference) - PA 54 TL: 25 (16 F/9 M) Mean age: 43.7 BL: 26 (17 F/9 M) Mean age: 42.9
1 yr Lago et al.
38(2018) RCT 197 TL: Platform matched BL: Platform switched
Max/Man Post Mean MBL: TL: Baseline to 1 yr: 0.26 mm 1 to 5 yr: 0.34 mm Baseline to 5 yr: 0.61 mm BL: Baseline to 1 yr: −0.03 mm 1 to 5 yr: −0.17 mm Baseline to 5 yr: −0.20 mm Significant difference between groups: Baseline to 1 yr: 0.31 mm 1 to 5 yr: 0.53 mm Baseline to 5 yr: 0.85 mm
SVR: TL: 1 yr: 100% 5 yr: 98% BL: 1 yr: 99% 5 yr: 96.1%
CBCT PA 54 M/46 F Mean age: 50.5 TL: 50 (31 M/19 F) Mean age: 47.9 BL: 50 (23 M/27 F) Mean age: 53.1
1 & 5 yr after definitive restoration
Table 3. Continued Study Study type No. of implants Study design Implant placement area Bone results Other results Measurement device Sex & age (yr) Follow-up Lago et al.
37(2019) Split-mouth RCT 100 TL: Platform matched BL: Platform switched
Max/Man Post Crestal bone changes: Baseline to 3 yr: BL: 0.18 mm TL: 0.15 mm Mean: Baseline to 1 yr: 0.07 mm 1 to 3 yr: 0.01 mm Baseline to 3 yr: 0.04 mm Only significant difference in TL from baseline to 3 yr.
- PA 35 (15 M/20 F) Mean: 49.5 1 & 3 yr after definitive restoration Wallner et al.
33(2018)
Clinical trial 42 TL: 20 BL: 22 Max Ant 1.9 yr: BL: 14 implants with thick biotype & mean bone change of –0.03 mm & 8 with thin biotype & change of 0.09 mm. Total mean bone change: +0.02 mm 4.9 yr: TL: 12 implants with thick biotype & mean bone loss of 0.21 mm & 8 with thin biotype & mean bone loss of 0.05 mm. Total mean bone loss: 0.015 mm - PA Human 41 (28 F/13 M) TL: mean age, 39 BL: mean age, 45
Mean:4.9 yr (11 mo to 7.8 yr) Hadzik et al.
31(2017)
Comparative 32 Short implants BL: 16 TL: 16
Man (lateral aspect) MBL: BL<TL 12 & 36 wk (significant difference in MBL): BL: Significant increase (0.19 & 0.29 mm or about 50%). TL: No significant changes (0.53 & 0.57 mm).
Primary stability: BL: 77.8 TL: 66.5 Secondary stability: BL: 78.9 TL: 73.9 PA CBCT 13 A: 7 (mean age, 45.9) B: 6 (mean age, 46.3)
12 & 36 wk (BL: bone level, TL: tissue level, Max: maxilla, Man: mandible, Ant: anter ior, Post: posterior, MBL: marginal bone loss, IDIP: initial depth of impla nt placement, SCR: success rate, SVR: survival rate, PA: periapical, M: male, F: female, GBR: guided bone regeneration, RCT: randomized clinical trial, PI: plaque index, BOP: bleeding on probing, PD: probing depth, CBCT: cone-beam
computed tomography, DIB: distance from shoulder to the first bone-implant contact) Hamed Mortazavi et al: Bone loss-related factors in tissue and bone level dental implants: a systematic review of clinical tria
ls. J Korean Assoc Oral Maxillofac Surg 20 21
to the first BIC (DIB)
35,39,43,45. Two studies reported both MBL and mean bone loss
25,30. In one article, hard mineralized tissue at the crestal level was evaluated
26, while another study re- ported the correction percentage of vertical defects after GBR and TL implant insertion
44.
Non-related bone results: Ten studies reported SVR
2,6,8,19,24-26,36,42,44, while one article mentioned only SCR
10. Both SVR and SCR were reported in 10 stud- ies
1,3,5,9,13,15,30,35,40,41. Other outcomes included reports of prob- ing depths (PD) in 10 studies
9,16,20,23,24,32,35,43,45,47, plaque index (PI) in 4 studies
1,32,35,43, bleeding on probing (BOP) in 2 stud-
ies
20,47, and pink esthetic scores (PES) in 5 studies
9,20,23,34,45. Risk of bias assessment: The evaluation of risk of bias is presented in Fig. 2 and 3. For 23 studies, randomization and blinding of participants, personnel, and outcome assessments were not applicable. Therefore, among 15 articles, 60%, 47%, and 30% of studies exhibited low risk in selection bias, perfor- mance bias, and detection bias, respectively. In relation to attri- tion bias and reporting bias, the majority of the studies showed no incomplete data or selective data reporting.(Fig. 2, 3)
Identification Screening Eligibility Included
NCBI PMC and PubMed database advanced search
Search terms: bone level implant , tissue level implant , bone level implant AND tissue level implant , bone/tissue level implant AND marginal bone loss , bone/tissue level implant AND bone resorption ,
bone/tissue level implant AND marginal bone level change Publication dates: until September 2020
Type of studies: clinical trials Language: English