5MW급 풍력 터빈의 공력 및 제어 특성에 관한 연구
타이펑주*, 강기원, 이장호**
Study on the Aerodynamics and Control Characteristics of 5 MW Wind Turbine
Fengzhu Tai*, Kiwon Kang and Jangho Lee**
Abstract 5MW wind turbine is regarded as a promising system for offshore wind farms in the western sea of Korean. And the wind turbine is developed in many companies but not much information is known about it. In this study, aerodynamics and control characteristics depending on several control methods is reviewed on 5MW wind turbine, in which configuration data of the turbine are used from the previous study of NREL. For the calculations, GH_Bladed, which is certificated software by GL, is used and compared with data from FAST code of NREL. This study shows that how much power production, and aerodynamic performances and loads can be obtained with different controls in the operation of 5MW wind turbine, which is expected to be useful in the design of the wind turbine system.
Key words
Wind energy(바람 에너지), Wind turbine control(풍력 터빈 제어), HAWT(수평축 풍력터빈), 5MW wind turbine(5MW급 풍력터 빈), Aerodynamic characteristics(공력특성),Variable Speed Variable Pitch(가변속가변피치), Variable Speed Fixed Pitch(가변 속고정피치), Fixed Speed Variable Pitch(고정속가변피치)
(접수일: 2011. 5. 25, 수정일: 2011. 6. 20, 게재확정일: 2011. 6. 24)
* 군산대학교 대학원 기계공학과
■ E-mail : [email protected] ■ Tel : (063)469-4869 ■ Fax : (063)469-1965
** 군산대학교 기계자동차 공학부
■ E-mail : [email protected] ■ Tel : (063)469-4869 ■ Fax : (063)469-1965
Nomenclature and abbreviation
V : wind speed, m/s R : radius of rotor, 63 m λ : tip speed ratio C
P: power coefficient
: generator efficiency, 94%
ρ : air density, 1.225 kg/m
3ω : generator angular speed, rad/s
Ω : wind turbine rotor angular speed, rad/s
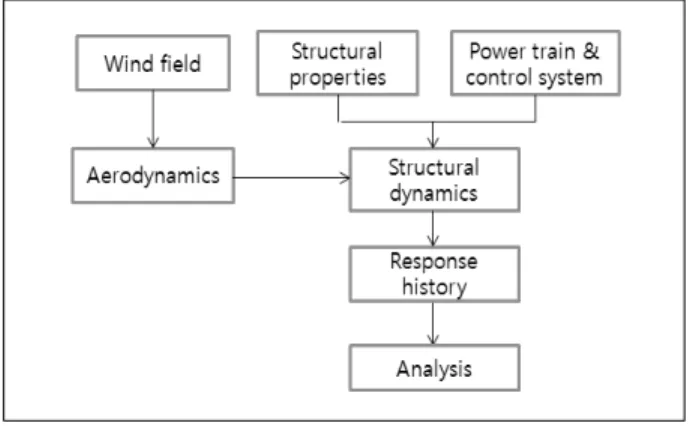
Fig. 1 Flowchart of GH-Bladed simulation
Ω
Z: Zero-torque rotor rotational speed, rad/s β : blade pitch angle, deg.
α : angle of attack, deg.
C
L: lift coefficient C
D: drag coefficient C
M: momentum coefficient
NREL : National Renewable Energy Laboratory
Subscript
Min : minimum Max : maximum N : rated Opt : optimal
1. Introduction
Wind energy conversion is a fast growing source among renewable energies in the world. Wind turbine to capture wind energy is getting larger for past ten years, and offshore wind farm is considered in many countries due to no disturbance for everyday life and sufficient wind energy at offshore sites. 5MW wind turbine is regarded as a promising system for offshore wind farm, and developing in many companies in the world. Therefore, it is necessary to study the performance about the wind turbine.
Wind turbine power production depends on the interaction between rotor and wind. And aerodynamic characteristics for wind turbine is of great importance for the design of wind turbine because most of turbine loads are from the wind.
There are several methods of analysis for the wind turbine, and GH-Bladed, started from 1984, is one of the reliable and effective software which is certificated by GL. Fig. 1 shows the schematic flowchart for the analysis of the wind turbine. After modeling on the turbine system including structural properties, power train, and control systems, the aerodynamics and per- formance of the system can be analyzed with various
wind data.
Wind turbine system consists of numerous components, such as rotor, gearbox, generator, tower and so on.
Control system is needed to combinate the operation of the subsystems together. The control system for a wind turbine is very important with respect to both machine operation and power production. The goals of control strategies are to maximize energy production while keeping operation within the constraints, to prevent extreme loads and ensure safe operation in general.
In the early development of wind turbine, most of wind turbines were operated at constant rated speeds.
The efficiency and reliability of wind turbine is shown to be dependent on the applied control strategy. Advances in wind turbine technology make it possible to design more efficient and powerful control systems.
The goal of this research is to study the aerodynamic behaviors of a 5MW wind turbine for various control strategies like constant speed and various speed below rated wind speed, and pitch control and stall control with fixed pitch above rated wind speed.
2. Wind turbine modeling 2.1 Blade modeling
To model the blade with GH-Bladed, airfoils, from tip
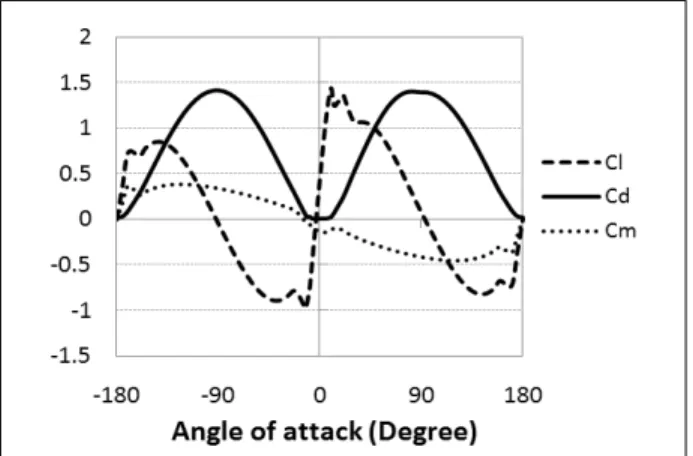
Fig. 2 Distribution of CL, CD and CM for DU25_A17 Table 1. Blade geometry properties
Node RN
[m]
Twt [°]
Chord [m]
Thick
[%] Airfoil
1 2.87 13.3 3.542 100 Cylinder 1
2 5.60 13.3 3.854 100 Cylinder 1
3 8.33 13.3 4.167 100 Cylinder 2
4 11.75 13.3 4.557 40 DU40_A17
5 15.85 11.5 4.652 35 DU35_A17
6 19.95 10.2 4.458 35 DU35_A17
7 24.05 9.0 4.249 30 DU30_A17
8 28.15 7.8 4.007 25 DU25_A17
9 32.25 6.5 3.748 25 DU25_A17
10 36.35 5.4 3.502 21 DU21_A17
11 40.45 4.2 3.256 21 DU21_A17
12 44.55 3.1 3.010 64 NACA64_A17
13 48.65 2.3 2.764 64 NACA64_A17
14 52.75 1.5 2.518 64 NACA64_A17
15 56.17 0.9 2.313 64 NACA64_A17
16 58.90 0.4 2.086 64 NACA64_A17
17 61.63 0.1 1.419 64 NACA64_A17
Fig. 3 Blade geometry in GH-Bladed (from the top mass, pitch, and twist axes)
to root, need to be selected first. Hereafter, distributed structural and aerodynamics properties should be set.
In this research, we adapted “NREL 5 MW wind turbine”
blade
(1)as a basic study because of the detailed infor- mation available. For the above-referred blade, 17 blade sections and 8 unique airfoils are applied for integ- ration of aerodynamic and structure forces.
2.1.1 Airfoil
Aerofoil database, including physical and aerodynamic data, can be defined to set up airfoil database. Fig. 2 shows its distribution of C
L, C
Dand C
Mfor attack angle from -180° to 180° of DU25_A17. Here, blade thickness is 25% of its chord length. And coefficients of other airfoil sections excluding cylinder, utilized in the blade as in Table 1, also show a similar distribution perfor- mance with DU25_A17. Moreover, Reynolds number of DU-airfoils is 7 million and the effect on C
L, C
Dand C
M, due to difference of Reynolds Number, is ignored in this study
(2)because Reynolds number dependency is consider- able only when angle of attack is larger than stall angle.
2.1.2 Blade geometry
In order to model the blade, its geometry data are needed. The blade node locations, labelled as ‘RN’ in Table 1, are the distances from blade cross sections to blade center along the blade-pitch axis. ‘Thick’ here is thickness to chord ratio.
The blade geometry, modelled in GH-Bladed, is presented in Fig. 3. The three thin lines, seen from the top, are mass, pitch and twist axes respectively.
2.2 Rotor, hub, and tower
Fig. 4 depicts the models of rotor and hub in GH-
Bladed. The tilt angle (T), the angle between the shaft
and horizontal, is set to be 5°. In order to avoid hitting
Table 2. Drive train properties
Parameters Rotor LSS of Gearbox
Generator output
Rated power [MW] 5.297 5.297 5
Speed (rpm)
Min 6.9 670
/ Rated 12.1 1173.7
Torque (KN.m)
Min 0 0
Rated 394.6 43.1
Max 434 47.4
(a)
(b)
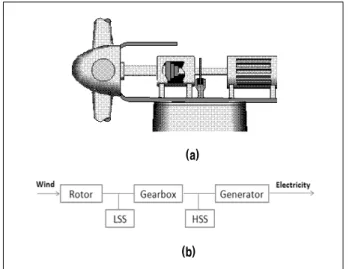
Fig. 5 Power train of this wind turbine; (a) Drive train components, (b) Drive train
Fig. 4 Rotor and hub
the tower for blade, the overhang (O) is 5 meters with a cone angle (C) of 2.5°.
The properties of the tower for NREL 5-MW baseline wind turbine
(1)are not presented here in detail, which are not closely related with the blade aerodynamics.
2.3 Drive train
2.3.1 variable speed systems
The gearbox was assumed to be a typical multiple- stage gearbox without friction loss between high speed shaft (HSS) and low speed shaft (LSS). The LSS is driven
by the turbine blades, which generates aerodynamic power. The HSS is loaded by the electric generator in the form of electrical load.
As we can see from Fig. 5, the wind goes through rotor, making it to rotate, and then gearbox speeds up the rotating shaft, finally electricity can be produced by generator with a high rotational speed.
Table 2 summarizes the drive train properties for vari- able speed systems
(1). With the rated generator speed of 1173.7 rpm, rated electricity power of 5 MW and a generator efficiency of 94.4%
(1), the rated mechanical power is 5.29 MW and torque is 43.1 KNm. The minimum generator speed of 670 rpm corresponds to a minimum rotor speed of 6.9 rpm used by actual REpower 5 MW machine
(3). To avoid the excessive overloading for the sake of safety, the torque range is saturated to a maximum of 10% above rated (47.4 KNm).
2.3.2 Fixed speed systems
For fixed speed generator, the generator-slip percentage was taken to be 2% as a maximum limitation value
(4). In order to clearly compare with variable speed control method, the same generator speed with the rated one in variable speed system is chosen for FSVP control strategy.
For FSFP control system, Fig. 6 describes the output
electricity energy for different generator speeds. To capture
the rated power without overloading, a induction generator
of 808 rpm with a generator slip of 2% was obtained.
Fig. 6 Power for different generator speeds
Table 3. Cases of control strategy(5) Case Below rated wind
speed
Above rated
wind speed Abbrev.
1 Fixed speed Fixed pitch (stall) FSFP 2 Fixed speed Variable Pitch FSVP 3 variable speed Variable Pitch VSVP
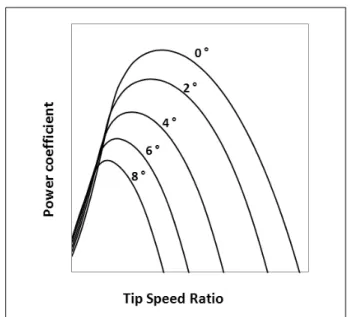
Fig. 7 Cp versus λ for various β
Fig. 8 Turbine power-speed characteristics
3. Control systems
One of the most important goals of controller is to maximize power capture below the rated operation point and regulate generator speed above the rated operation point. Three cases of control methods are selected in this study as in Table 3.
3.1 Control below rated wind speed
3.1.1 variable speed control strategy
The aerodynamic power of a wind turbine is given by the equation:
[W] (1)
The power coefficient is defined as a ratio of turbine power to wind power. And it is the function of λ as well
as β, blade pitch angle, as in Fig. 7.
The following β is considered constant, as it changes only when full load is reached through a feedback control loop that regulates power output. λ is defined as the ratio of turbine tip speed to wind velocity.
(2)
Fig. 9 VSVP control strategy Fig. 10 FSVP control strategy
Fig. 7 shows that, under the condition of a fixed β, there exists an optimum value of λ (
) that makes the C
Pmaximum. The turbine power-speed curves for various wind velocity values (from 4 m/s to 12 m/s) with β of 0° are presented in Fig. 8. Meanwhile, the thick parabola is a power peak locus.
Substituting V with
, then
can be obtained with the following equation.
(3)
Then
∙ (4)
∙ (5)
Here,
(6)
From the simulations, it can be found that the peak power coefficient of 0.48 happens at a tip speed ratio of 7.5 and blade pitch angle is 0° . With a gearbox ratio
of 97:1, this results in an optimum constant of propor- tionality of 2.3 Nms
2/rad
2below rated wind speed.
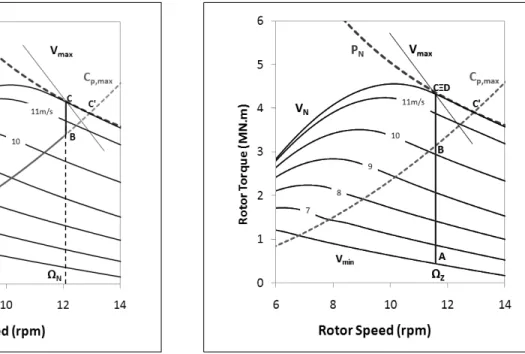
Fig. 9 shows the Variable-Speed Variable-Pitch regu- lation control feature in the torque-rotor rotational speed plane. The brown dashed thick line indicates the toque and speed curve at rated power, whereas the blue parabola is the locus of maximum conversion efficiency (C
P,maxlocus). Besides, the grey thin curves, similar with those in Fig. 8, depict the aerodynamic torque perfor- mance for various wind speeds between V
minand V
max.
The operating point A corresponds to the cut-in wind, whereas B is the point where the rated wind speed is reached. Below the rated wind speed, the turbine is operated along the C
P,maxlocus between point A and point B to keep the maximum C
P.
3.1.2 Fixed speed control strategy
Unlike the variable generator speed of VSVP control in 3.1.1, the generator speed is nearly constant in a fixed speed control strategy. From Eq. 2, it is obvious that λ (TSR) varies only with wind speed in this case.
So generator speed can be designed according to the
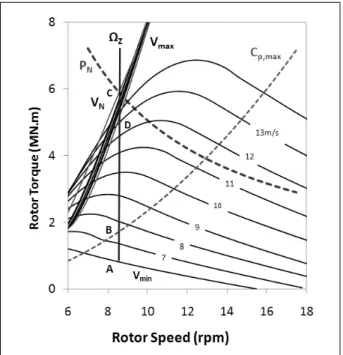
Fig. 11 FSFP control strategy
distribution of wind velocity at a given site. It has an advantage of low cost, but at the expense of lower C
Pfor overall wind speed.
Fig. 10 illustrates the FSVP regulation control strategy.
Rotor speed is a fixed value. Herein, point A and C take the meaning in Fig. 9 and the maximum C
Pis obtained at a unique point B.
3.2 Control above rated wind speed
3.2.1 Stall control strategy
As wind speed increases, so does attack angle. And over rated wind speed, an increasingly large part of blade starting from the blade root enters the stall region.
This is how to reduce rotor efficiency and limit output power.
Fig. 11 demonstrates control strategy of the FSFP regulation wind turbine.
The operating point C is the point where the reaction torque curves intersects the stall front. It means the turbine stalls at the wind speed V
C. Therefore, after this
point, higher wind speed leads to lower aerodynamic power. That is why the operating points move back along the locus until point D, which relates to the cut-out wind speed (V
max).
3.2.2 Pitch control strategy
From Fig. 2, we can see that, for a given airfoil section, aerodynamic coefficients (like C
L, C
Dand C
M) are func- tions of α. When β changes, these coefficients also change with it due to the variation of α, which finally causes the differences of C
Pas in Fig. 7.
From Eq. 1, it is obvious that power is in direct pro- portion to V
3and C
P. So when wind speed increases from rated wind speed, power still can be kept constant, as the operation point C in Fig. 9 and 10, by lowering C
Pwith the increase of β.
There are also several other control systems, such as brake torque control and yaw orientation control etc, which are not described in detail here.
4. Results and discussion 4.1 FSFP
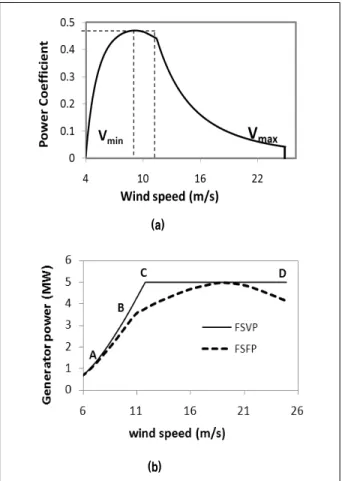
In the scheme of FSFP control strategy, power limi- tation is accomplished by passive stall.
Results, as in Fig. 12 (a) and (b), present the power capture feature of FSFP control. The points marked in these Figures correspond with those in Fig. 11. It can be observed that the rated power can be extracted by the turbine at a unique wind speed V
C, power decreases with lower or higher wind speeds. Besides, As in Fig.
10, the rotor torque moves from point A to point C at a constant rotor speed.
It shows up that maximum conversion efficiency is
achieved only at the B point, which is the intersection
between the C
P,maxlocus and operation line AC.
(a)
(b)
Fig. 12 Results of FSFP control strategy; (a) Output power versus wind speed, (b) Power coefficient versus wind speed
(a)
(b)
Fig. 13 Results of FSVP control strategy; (a) Power coefficient versus wind speed, (b) Output power versus wind speed
Fig. 14 Results of power from FAST codes and this study
4.2 FSVP
Fig. 13 (a) depicts power capture performance of the FSVP control strategy. In the region below rated wind speed, the control strategy is similar to the FSFP one in Fig. 11.
Fig. 13 (b) illustrates that output power, compared with the FSFP control strategy of the same rated output power, are larger due to a higher fixed speed below rated wind speed and pitch regulation above rated wind speed.
4.3 VSVP
4.3.1 Comparison with FAST
Output power in this study is the solid curve in Fig.
14, when the same conditions were specified with those
in Ref. [1]. It is matched well with results from FAST
code
(1).
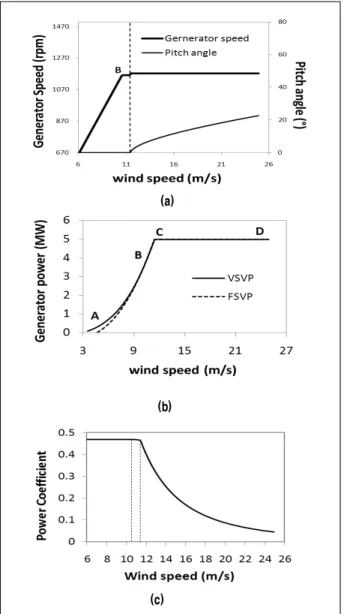
(b)
(c) (a)
Fig. 15 Results of VSVP control strategy; (a) Generator speed and pitch angle for various wind speeds, (b) Output power
Versus wind speed, (c) Power coefficient Versus wind speed Fig. 16 Thrust with various control methods
4.3.2 Results of VSVP
Results of VSVP control strategy are presented in Fig. 15.
Above the rated wind speed, the VSVP control strategy, in Fig. 9, is similar to the FSVP one in Fig. 10. The controller adjusts pitch angle to regulate aerodynamic power at the rated point (point c).
From Fig. 15 (a), it is clear that turbine is pro- grammed to operate at variable speed and fixed pitch
below rated wind speed and at constant speed and variable pitch above rated wind speed.
Output power with VSVP control is larger than the FSVP one except at point B, which is presented in Fig.
15 (b). At point B, rotational speed gets its maximum value Ω
N, Therefore, rotational speed is regulated at this value on segment BC for wind speed from 10.7 m/s to 11.4m/s.
Fig. 15 (c) shows its power coefficient for various wind speeds. It can be easily seen that power coefficient keeps the maximum value as long as wind speed is below V
B,and then decreases slightly in the segment BC, finally drops when in the region of wind speed above V
Nto keep the operation at point C.
4.4 Aerodynamic characteristics
4.4.1 Thrust
The main contribution to total bending moment of the tower, especially at its lower location, comes from the rotor thrust
(6), therefore thrust is an important parameter for analysis of wind turbine system. Fig. 16 illustrates that for results of VSVP control system, along with the increase of wind speed, thrust increases first until it reaches the rated point then reduces.
The results show a similarity with VSVP and FSVP
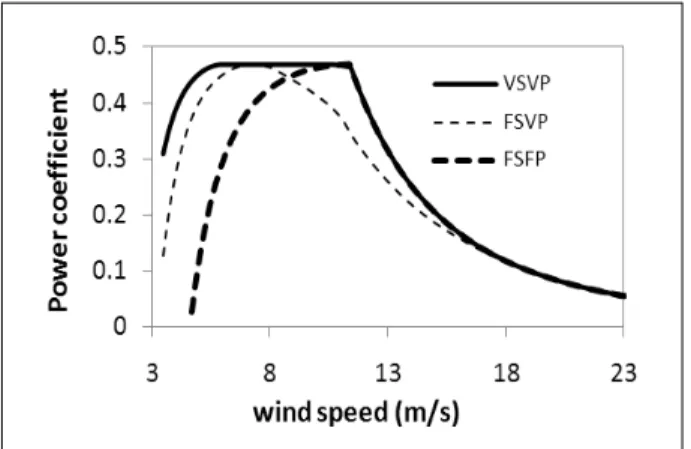
Fig. 17 Power coefficient for various control strategy
Fig. 18 Tower deflection at the height of 61.32m
control strategies. The tiny difference between them is mainly because of the variation of generator speeds as well as generator-slip percentage. In contrast to these two cases, however, thrust with FSFP is somewhat lower below rated wind speed but much larger when at higher wind speeds. This is due to the big difference of generator speed and a larger rated wind speed.
4.4.2 Power coefficient
As is explained above in detail for each case, power coefficient (CP) is summarized, in Fig. 17, for all three cases. It is clear that CP with VSVP control strategy gets the highest values for overall wind speeds.
4.4.3 Tower deflection
Fig. 18 shows the tower deflection for various control systems at the height of 61.32m. We can get that tower deflection for VSVP control is lower, this is mainly because of a smaller trust of rotor in the region of higher wind speed.
5. Conclusion
A prototype of 5 MW wind turbine has been modeled, and analyzed using GH-Bladed with steady wind con- ditions. Three different control methods are employed to review aerodynamics and control characteristics of the wind turbine. And conclusions are like followings.
1. Results of GH_Bladed with VSVP control strategy show good match with those from FAST code previously researched by NREL.
2. It is shown that aerodynamic characteristics, such as torque, power, and thrust, are changed by control methods in the operation region below rated wind speed, and torque and power are larger than others when various speed control is applied.
3. Above rated wind speed, results of variable pitch regulation control show a better aerodynamic per- formance than those of stall regulation control. And it can be indicated that variable speed pitch regulated control is a better choice for overall wind speeds.
4. For the future work, detail analysis and understanding on the design parameters of dynamic loads and bending moment and so on, are needed with various offshore operation conditions.
Acknowledgements
This work is financially supported by the MKE and KETEP
타이 펑주
2008년 Huaihai Institute of technology대학교 Mechanical dept. 공학사
현재 군산대학교 기계공학과 석사과정 (E-mail : [email protected])
이 장 호
1988년 서울대학교 농업기계 공학사 1995년 포항공과대학교 대학원 기계공학과
공학석사
2004년 포항공과대학교 대학원 기계공학과 공학박사
현재 군산대학교 풍력기술 연구센터장, 군산대학교 기계자동차공학부 교수 (E-mail : [email protected])
강 기 원
1991년 한양대학교 기계설계공학과 공학사 1993년 한양대학교 대학원 기계설계공학과
공학석사
2001년 한양대학교 대학원 기계설계공학과 공학박사
현재 군산대학교 기계자동차공학부 교수 (E-mail : [email protected])
as a research project of “Development of 5MW large-scale offshore wind turbine system (2008NWD12P0230602009)”.
References
[1] J. Jonkman. S. Butterfield, W. musial, G. scott, 2009,
“Definition of a 5-MW Reference Wind Turbine for Offshore System Development”, NREL, 2009.
[2] H. J. Kooijman, C. Lindenburg and D. Winkelaar, 2003,
“DOWEC 6 MW Pre-Design”, DOWEC.
[3] Bir, G. and Jonkman J., 2007, “Aeroelastic Instabilities
of Large Offshore and Onshore Wind Turbines”, The Second Conference on The Science of Making Torque From Wind, Denmark, 2007.
[4] J. Machowski, J. W. Bialek and J. R. Bumby, “Power System Dynamics: Stability and Control”, 2nd edit, Durham University, UK, 280-281.
[5] F. D. Bianchi and R. J. Mantz, 2007, “Wind Turbine control systems”, Springer Science Bussiness Media, 2007.
[6] Pierre-Elouan Réthoré, 2006, “Thrust and wake of a wind turbine: Relationship and measurements”, M.Sc.
thesis, September 2006.