Development of Torsional Shear Testing System to Measure P-wave Velocity, S-wave Velocity and Pore Water Pressure
Buildup on Fully and Partially Saturated Sands
포화 및 부분 포화 사질토의 V
p와 V
s속도 및 과잉간극수압 측정을 위한 비틂전단 시험기의 개발
Kim, Dong-Soo* · Lee, Sei-Hyun** · Choo, Yun-Wook***
김동수 · 이 세 현 · 추 연 욱
Abstract
Laboratory tests have revealed that the liquefaction resistance of sands depends strongly upon the degree of saturation, which is expressed in terms of the pore pressure coefficient, B. The velocity of compression waves(i.e. P-waves), which have been known to be influenced largely by the degree of saturation and can be measured conveniently in the field, appears as an indicator of saturation. In this paper, the Stokoe type torsional shear(TS) testing equipment is modified to saturate the specimen and measure the velocities of P-wave and S-wave and pore pressure buildup. The velocities of P-wave and S-wave for Toyoura sand from Japan is measured and compared at the various B-value (degree of saturation) which are partially saturated to fully saturated conditions. Additionally, the variation of the pore water pressure induced during undrained TS tests at the various B-value is measured and analyzed.
Keywords : B-value, S-wave velocity, P-wave velocity, Torsional shear testing, Excess pore water pressure
요 지
사질토의 액상화에 대한 저항 강도는 포화도에 상당히 의존한다. 압축파 속도는 현장에서 쉽게 측정이 가능하고 포화도의 영향을 크게 받기 때문에 현장 지반의 포화도를 예측하고자 할 때 효율적으로 사용 될 수 있다 . 본 논문에서는 시료의 포화가 가능하고 전단파, 압축파 속도 측정 및 비배수 상태에서 비틂 전단 시험을 수행시 유발되는 과잉간극수압을 측정할 수 있는 비틂전단 시험기를 개발하였다. 토요라 모 래에 대해 전단파, 압축파 속도 측정이 수행되고, 비배수 비틂전단 시험을 실시하였다. 포화도(B값)에 따 른 시료의 전단파 속도 및 압축파 속도를 이론식과 비교하여 개발된 시험기를 검증하였으며, 여러 B값에 서 비배수 TS 시험동안 유발되는 과잉 간극수압의 변화를 측정·분석하였다.
주요어 : B값, 전단파 속도, 압축파 속도, 비틂전단 시험, 과잉간극수압
* member, Prof., Dept. of Civil & Environmental Engrg., KAIST, [email protected]
** Graduate student, Dept. of Civil & Environmental Engrg., KAIST, [email protected]
*** Post-doc., Dept. of Civil & Environmental Engrg., KAIST, [email protected] 한국지반환경공학회 논문집 제7권 제1호 2006년 2월 pp. 55~66
···
···
1. Introduction
The liquefaction resistance of sand is closely related with the degree of saturation because the liquefaction resistance is evaluated from the buildup of excess pore water pressure in undrained condition which is much dependent on the degree of saturation. According to studies by Chaney (1978), Yoshimi et al. (1989) and Grzic et al. (1999, 2000), when the B-value drops to a level of about zero at the degree of saturation, Sr, of about 90%, the liquefaction resistance has been shown to increase roughly two times as much as that of fully saturated conditions.
It has been presented by recent studies that in-situ sand is partially saturated despite the deposit is located at several meters below the water table. Kokusho (2000) and Tsukamoto et.
al.(2002) has reported that Vp of in-situ soils below a water table is lower than about 1500m/s which is Vp in pure water, and has the values of 800m/s to 1300m/s despite the soil is located below a water table. This means that the soil deposit several meters below the water table may be not fully saturated but partially saturated soil and the liquefaction resistance of in-situ sand below ground water table may be greater than the value normally evaluated at fully saturated condition in design practice. Therefore, the effect of the degree of saturation on the undrained behavior of sand and the evaluation of the degree of saturation for in-situ soil may have important role in the geotechnical earthquake engineering.
In laboratory tests, the B-value has been widely used to quantify the state of saturation, because this value is easily measured and accurate enough to indicate a state of partial saturation. It is well known that the pore water pressure coefficient, B, introduced by Skempton (1954) is given as ;
(1)
where Δσ and are the increments of the confining cell pressure and pore water pressure caused by Δσ in undrained condition. However, it is practically impossible for the B-value to monitor the state of saturation of the soil in the field.
Nowadays, the velocities of shear wave, Vs, and longitudinal wave, Vp, have been measured at a lot of field sites for site investigation by field seismic tests such as the down-hole, cross-hole, up-hole tests and so on. The Vp is very sensitive on the state of saturation of soil because the compressibility of water is relatively very larger than that of soil skeleton (Kokusho, 2000; Tamura et. al., 2002; Tsukamoto, 2002). Therefore, Vp can be used as a convenient index for the evaluation of saturation. Also, the measurement of Vp has many advantages on the study on the relation between Vp and the saturation and the relation between these parameters and the undrained behaviors of sand, because it is possible to measure Vp in laboratory as well as in field.
The first objective of this paper is to develop the testing system to perform the saturation of a soil specimen and undrained tests and, at the same time, measure S-wave velocity(Vs) and P-wave velocity(Vp) of specimen. For this objective, the existing Stokoe-type torsional shear (TS) equipment is modified to saturate a soil specimen and measure excess pore water pressure buildup (Δu) during undrained TS tests. Also, the measurement system of S-wave velocity (Vs) and P-wave velocity (Vp) is added to the modified TS system. The second objective is to measure the value of Vp/Vs measured at various B-values and to compare the Vp/Vs with a existing theoretical formula using the modified equipment. The last objective is to study the effect of partial saturation on pore water pressure buildup(Δu) and deformation characteristics(G, D) of sand during undrained TS tests.
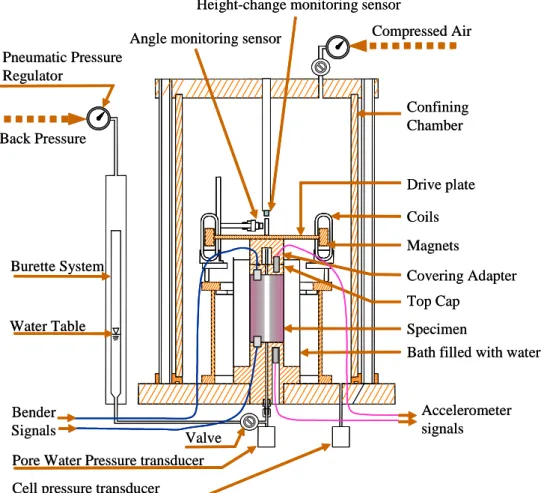
Compressed Air
Confining Chamber Angle monitoring sensor
Height-change monitoring sensor
Drive plate Coils
Covering Adapter Pneumatic Pressure
Regulator
Back Pressure
Burette System
Water Table
Pore Water Pressure transducer Cell pressure transducer
Valve
Specimen Top Cap Magnets
Bath filled with water
Bender Signals
Accelerometer signals
Fig. 1. Schematic Configuration of the Modified TS Equipment
2. Modifications of Torsional Shear Testing Equipment
Stokoe-type torsional shear (TS) testing equipment in this study has been widely used to investigate deformation characteristics (shear modulus and damping ratio) of soils at shear strains from 10-4% to 0.1% in geotechnical earthquake engineering. In this equipment, the bottom of the solid soil specimen is rigidly fixed against rotation at the base pedestal while the top (free end) is connected to a drive system that is used to excite and monitor motion as shown in Figure 1. Eddy-current type proximity transducers are used to measure the angle of twist of specimen while the voltage applied to the coils is calibrated to yield torque. TS tests were
performed as stress-controlled cyclic tests because the torque of the TS equipment is in proportion to the voltage passing through the drive coils and the sinusoidal voltage having a constant amplitude is excited to coils. The maximum torque of this TS testing equipment is about 0.515 N-m.
The secant shear modulus is determined by the slope of the hysteresis loop and the equivalent damping ratio is determined on the basis of the area of the loop as shown Figure 2. Thus, the shear modulus and damping ratio are calculated from;
c c
G
=
τ γ (2)) 4
( T
L A
A
D= π (3)
where τc and are cyclic shear stress
amplitude and cyclic shear strain amplitude, AL is the area enclosed by a hysteresis loop and AT=τc ㆍ /2 is the peak strain energy stored during the cycle, and cyclic shear strain amplitude is calculated at 0.80 times the radius of the solid specimen (Chen and Stokoe, 1979).
γ G
G = τc/ γc D = AL / (4π AT )
AT
AL
τ
1
γc
τc
γ G
G = τc/ γc D = AL / (4π AT )
AT
AL
τ
1
γc
τc
Fig. 2. Measurement of shear modulus and damping ratio of torsional shear tests
In this study, the existing Stokoe-type torsional shear testing equipment is modified to saturate the specimen and to determine P-wave velocity (Vp), S-wave velocity (Vs) and excess pore water pressure buildup (Δu) of saturated specimens during undrained TS tests.
2.1 Saturation of Soil Specimen and Measurement of Pore Water Pressure
The modification of TS equipment includes two new elements, which are 1) a quick connector (Swagelok SS-QM2-B 200, SS-QM2-D-2PM) attached to a top cap and 2) a back pressure system which consists of a pneumatic pressure regulator (Fairchild M 10 regulator), a burette system and a pore pressure transducer (RDP FDW 150psi) installed at bottom pedestal as illustrated in Figure 1.
The quick connector is attached at the upside of the top cap and consists of two parts of male and female as shown in Figure 3. It can connect and disconnect the pressure lines easily, and when
disconnected, the male and female parts and the corresponding pressure lines are kept closed. After the preparation of a soil specimen, CO2 gas and water are made to flow upward through the specimen under the pressure difference between top and bottom of the specimen using a quick connector. Once the air within a soil specimen is exchanged with water, the quick connector is disconnected and the top cap becomes closed.
After that, a covering adaptor is fastened by 4 bolts to the top cap and sealed by O-ring to protect the remaining part of quick connector at the top cap from the compressed air in confining chamber and be coupled with the drive plate of a drive system.
Fig. 3. Picture of a male part and a female part of quick connector
A back pressure system makes pore water pressure high enough to diminish the size of air bubbles in the pore of the specimen and dissolve air bubbles in water. A pore water pressure transducer measures the back pressure and the excess pore water pressure generated during the undrained TS tests. A burette system converts pneumatic pressure to water pressure and transmit pressure to pore water in sands. Also, the burette system measures volume changes in the soil specimen after shear loading.
Because the confining pressure is applied by air pressure, the water bath is installed to provide the air-water interface and retard the air migration.
Because the pore pressure buildup can be
significantly affected by the degree of saturation, it is important to achieve the full saturation of the soil specimen and maintain the saturation during the testing. In this study, the saturation is checked by the B parameter, which is generally maintained above 0.99. An example of the variation in the B-value with time after the back pressure saturation is presented in Figure 4. It can be noticed that B-value is maintained above 0.99 for about 1 hour during which time the TS testing can be completed at a given confining pressure.
0.988 0.990 0.992 0.994 0.996 0.998
0 20 40 60
Time, minutes
B value
Toyoura sand Back pressure = 444 kPa Mean Effective stres= 20 kPa Increasing cell pressure = 32 kPa
Fig. 4. Variations of B-values measured by modified TS testing system
2.2 Measurement of Shear Wave Velocity(Vs)
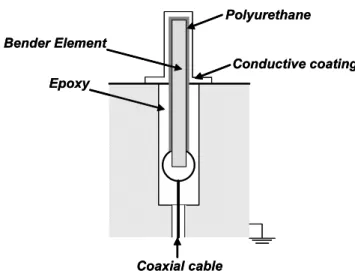
Bender elements are mounted on the top cap and bottom pedestal of the equipment to send and to receive shear waves. The bender element method is a simple technique to obtain the velocity of shear wave propagation through a sample. Bender elements used in this study were produced by Morgan-Electroceramics and made of Lead Zirconate Titanates (PZT 5H) with the following dimensions; 12.7mm length, 8mm width and 0.6mm thickness. The bender elements double-coated with a waterproofing material (Polyurethane) are placed in slots of the top cap and bottom pedestal and the gap around the bender element in the slot is filled with epoxy
resin to fix bender elements in slots. Then, the bender element to receive the signal is coated with conductive coating and grounded to avoid electromagnetic coupling and cross-talk. Figure 5 shows bender element mounted in top cap or bottom pedestal.(Soils and Waves, 2001)
Coaxial cable Epoxy
Bender Element
Polyurethane
Conductive coating
Coaxial cable Epoxy
Bender Element
Polyurethane
Conductive coating
Fig. 5. Bender element mounted in top cap or pedestal
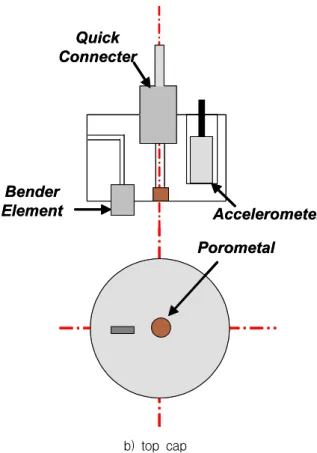
Bender
ElementBender Accelerometer
Element Accelerometer
a) bottom pedestal
Bender
Element Accelerometer
Quick Connecter
Porometal Bender
Element Accelerometer
Quick Connecter
Porometal
b) top cap
Fig. 6. Top cap and bottom pedestal attached bender elements and accelerometer to
A HP Function Generator Model 33120A is used to supply the input signal to the bender element in top cap and High resolution oscilloscope (HP 54624A) is used to record waveform from the receiving bender element in bottom pedestal.
Rectangular signal is used as the input signal.
The oscilloscope measures signal at the sampling rate of 1MHz and 2000 data samples are stored in a disk. The oscilloscope measures signals using smoothing technique without filter, and stores the average of 128 stacked signals in a personal computer.
2.3 Measurement of Compression Wave Velocity(Vp)
Accelerometers are used to determine P-wave velocity(Vp) of the soil specimen and mounted on the top cap and bottom pedestal as shown Figure 6. The model of accelerometer is PCB 353B16
produced by PCB Piezotronics, and it is small size type; the height of 14.5mm, the width of 7.1mm and the weight of 1.5g. The accelerometer has the resonant frequency of 70kHz and the frequency range for measurement from 0.7Hz to 18000Hz and it is very suitable to measure high frequency vibration accurately. The signals of accelerometers is measured by the same oscilloscope (HP 54624A) used for bender element.
To determine Vp of the specimens, a steel ball and a rod of 2mm in diameter are used as sources. P-wave is propagated from bottom pedestal through the soil specimen as impact by a steel ball or a rod. Vp is determined by the time difference of the first arrivals between the two accelerometers. The time difference has to be corrected by the equipment calibration constant, which is defined as the travel time, tc, from top cap to bottom pedestal in contact without a specimen. The calibration constant, tc, shows a constant value of about 0.0000285sec (28.5μsec) from repeated tests. Vp is calculated from the length of the specimen divided by the corrected travel time. In this study, Vp is determined by the average of all Vp by the steel ball and rod because Vp by the steel ball is similar to that by the rod irrespective of source difference.
2.4 Height-Change Monitoring System
The height changes of the soil specimens is measured to account for the changes in the length of the specimen during consolidation or swell.
Because the change of the specimen length is directly correlated with the wave propagation length in determining Vs and Vp, the measurement of the height-change is very important. Also, the measurement of height-change is used to calculate change in the mass density and void ratio during thesting. The height-change monitoring system consists of a proximity transducer (Bently Nevada 3300XL) and the aluminum target installed on the upper side of the target for motion monitoring sensors as shown Figure 1. The output from the
proximity transducer is read with a digital voltmeter and the height change is calculated from the output voltage combined with the calibration factor.
3. Testing Material and Procedure 3.1 Testing Material
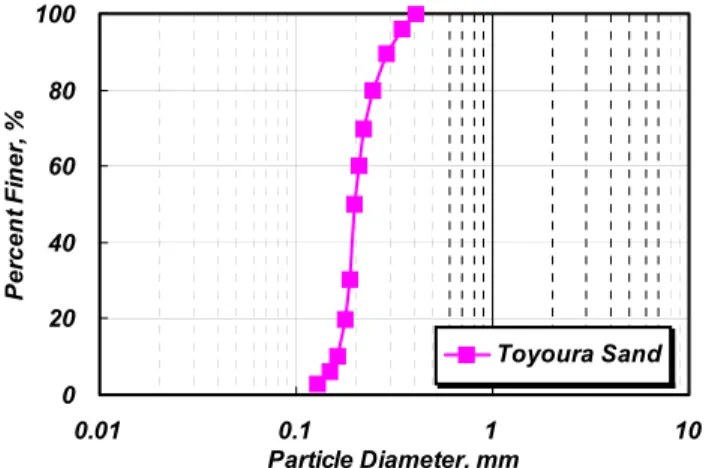
The test material is Toyoura sand from Japan, widely used in geotechnical laboratory testing.
Toyoura sand is classified as poorly graded clean sand without fines. The grain size distribution of Toyoura sand is shown in Figure 7 and the physical soil properties are summarized in Table 1.
0 20 40 60 80 100
0.01 0.1 1 10
Particle Diameter, mm
Percent Finer, %
Toyoura Sand
Fig. 7. Grain Size Distribution of Test Material Table 1. Physical Properties of Test Material
Sample Toyoura Sand
Unified Soil Classification (USCS) SP Maximum Void Ratio (emax) 0.982 Minimum Void Ratio (emin) 0.617
Specific Gravity (Gs) 2.65
Curvature Coefficient (Cc) 1.00 Uniformity Coefficient (Cu) 1.29
Plasticity Index(PI) NP
Median Particle Size D50, mm 0.199
3.2 Testing Procedure
Soil specimens of 50mm in diameter and 100mm in height were prepared by the method of air
pluviation in which air-dried sand is poured in mold from the nozzle with a rectangular inner cross section of 1.5mm to 10mm while maintaining a constant drop-height throughout preparation. In this study, the drop-height was maintained by about 22cm to achieve the relative density of Dr=50%. Before the mold is disassembled, a vacuum pressure of 10kPa is applied to the specimen, subsequently, the mold is dismantled and then the vacuum pressure is raised to 20kPa to stand the specimen. In this study, since all tests are performed under target isotropic effective stress, σ0', of 30kPa, the vacuum pressure of 20kPa is applied to keep standing the specimen.
In case of tests with high B-value above 0.8, CO2 gas is flowed to replace the air through the specimen under a low pressure difference between top and bottom of the specimen (less than 15kPa) to expel the air within the specimen for 15~30 min. Then, the specimen is filled with de-aired water which is flowed for about 30~60 min to displace and dissolving the CO2. In case of tests with low B-value less than 0.8, the CO2 gas is not flowed but the only water is circulated though the specimen. After the circulation, initial specimen height and diameter is measured and then the TS equipment is setup. The isotropic effective stresses of all tests in this study are kept 30kPa constantly and B-value (the degree of saturation) of partially saturated specimens is controlled by increasing back pressure step by step in the increment of 30kPa. It is known that the B-value increases with increasing back pressure. After applying the back pressure for about an 60 minutes, B-value is checked. If the B-value reaches the target value, the dimension of the specimen is measured, and then Vs and Vp are determined by bender elements and two accelerometer respectively. Finally, TS test is performed in undrained condition.
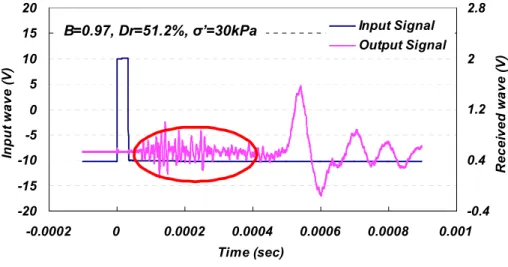
The typical signals of the transmitted and received waves are shown in Figure 8. Figure 8a and 8b show the signals of shear wave and compression wave propagated through specimen of B=0.97 and B=0.67 respectively. In Figure 8a, the
-20 -15 -10 -5 0 5 10 15 20
-0.0002 0 0.0002 0.0004 0.0006 0.0008 0.001 Time (sec)
Input wave (V)
-0.4 0.4 1.2 2 2.8
Received wave (V)
Input Signal Output Signal B=0.97, Dr=51.2%, σ’=30kPa
a) Shear Wave Propagation
-0.02 -0.01 0 0.01 0.02 0.03 0.04
-0.001 -0.0005 0 0.0005 0.001 0.0015 0.002
Time (sec)
Input wave (V)
-0.06 -0.04 -0.02 0 0.02 0.04 0.06 0.08 0.1
Received wave (V)
Input Signal Output Signal B=0.67, Dr=47.6%, σ’=30kPa
b) Compression Wave Propagation
Fig. 8. Typical Signals of Transmitted and Received Waves effect of compression wave propagated through
pore water can be noticed in the early part of the received signal
The undrained TS test is performed at shear strain range from 0.0002% to 0.1%. First, 11 cycles of TS testing is performed at the smallest strain amplitude possible below about 0.001%. The sinusoidal torque having constant amplitude and a constant loading frequency of 0.5Hz is applied to the specimen. The excess pore water pressure remained during undrained TS test is drained after 11 loading cycles and next TS test is
continued with increasing strain amplitude.
Sample preparation, testing conditions and testing procedure are summarized in Table 2.
4. Test Results
4.1 Test results of Vs and Vp measurements
The Vs/F(e) determined by bender element test are plotted versus the B-value in Figure 9. To eliminate the effect of void ratio, the values of Vs
are normalized by a function of void ratio, which
Table 2. Sample Preparation, Testing Conditions and Testing Procedure
Tests
S-wave velocity (BE Test)
Input Signal rectangular
# of Staking 128
P-wave velocity Sources Steel Ball, Rod
# of Staking 1
TS Test
Excitation Type sinusoidal
Loading Frequency 0.5Hz
# of Loading Cycles 11
Shear Strain Range 2×10⁻⁴%~10-1% or more Pore-Pressure
B-value
Relative Density
Dr (%) Initial Void Ratio, e Effective Stress, σ0'
Drainge Condition
0.01 52.4 0.789
30kPa Undrain
0.28 48.9 0.801
0.40 49.6 0.799
0.67 47.6 0.806
0.83 50.9 0.794
0.90 52.2 0.789
0.97 53.0 0.786
0.99 50.6 0.798
Sample Preparation → Back Pressure, Cell Pressure → Checking B-value → Measurement of Vs (BE Test) → Measurement of Vp → Undrained TS Testing
recommended by Hardin(1963) :
(4)
The maximum shear modulus (Gmax) which is calculated by Eq.(5) is also shown in Figure 9, where ρ is the total mass density of the soil specimen.
(5)
As shown in Figure 9, the Vs tends to decrease slightly with an increase of the B-value from a value Vs=174m/sec at B=0.01 to Vs=160m/sec at B=0.97. The Gmax have a same trend with Vs.
Some researchers have demonstrated the Vp
is very dependent on small change in B-value between B=0.8 and B=1.0 in their theoretical studies (Nishio, 1987 ; Kokusho, 2000). The small amount of air bubble contained in pore water
150 160 170 180 190 200 210
0 0.2 0.4 0.6 0.8 1 1.2
B-value
Vs/F(e), m/s
35 40 45 50 55 60 65
Gmax/F(e), MPa
BE-Vs BE-Gmax Toyoura Sand, σ0’=30kPa
Fig. 9. Vs/F(e), Gmax/F(e) versus B-value (BE)
affects the correlation of Vp with B-value. As an example, the 0.1 percent of air bubbles in the water makes the bulk modulus of air-water mixture 0.0625 times of that of water, since the bubble-like structure of the pores is much more compressible than water itself. Consequently, this small volume of air bubbles (0.1%) in the
BE-VS
BE-Gmax
Toyoura Sand, ′=30kPa
pore-water reduce the wave propagation velocity of the mixture to about 1/4.
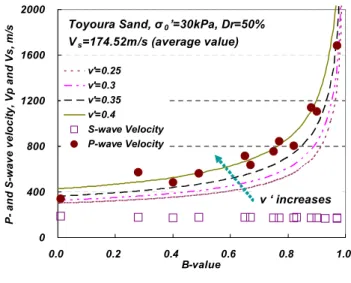
Based on the theory of wave propagation through a poro-elastic medium, Kokusho (2000) and Tsukamoto (2002) presented theoretical formula for determining the Vp with the variation of B-value of partly saturated sand as indicated in Eq.(6). The theoretical formula, Eq. (6), expresses the ratio Vp/Vs in terms of the skeleton Poisson's ratio, and B-value. In this study, the modified testing system tried to be verified by comparing the test results obtained by modified system with the formula.
(6)
The ratio of Vp/Vs computed from Eq.(6) for various assumed values of the skeleton Poisson's ratio and test results are plotted in Figure 10a. As the value of Vs in Eq.(6) is assumed by the average value of Vs determined from bender element test. The results of Vp and Vs
measurements are plotted in Figure 10b.
0 2 4 6 8 10 12
0.0 0.2 0.4 0.6 0.8 1.0
B-value
Vp/Vs
ν'=0.25 ν'=0.3 ν'=0.35 ν'=0.4
Vp/Vs from Tests
Toyoura Sand, σ0’=30kPa, Dr=50%
ν ‘ increases
a) Vp/Vs vs B-value
0 400 800 1200 1600 2000
0.0 0.2 0.4 0.6 0.8 1.0
B-value
P- and S-wave velocity, Vp and Vs, m/s
ν'=0.25 ν'=0.3 ν'=0.35 ν'=0.4 S-wave Velocity P-wave Velocity
Toyoura Sand, σ0’=30kPa, Dr=50%
Vs=174.52m/s (average value)
ν ‘ increases
b) Vp and Vs vs B-value
Fig. 10. Vp/Vs, Vp and Vs versus B-value
It is seen that the values of Vp tend to increase significantly with increase of B-value. Besides, it would be reasonable to assume that the skeleton Poisson's ratio, is 0.4 under relative density, Dr=50% and isotropic effective stress, σ0'
=30kPa.
According to Ishihara (1996), Poisson's ratio is related to the shear modulus and it is expected that may be affected by Dr, σ0'
and so on.
Also, further tests are required for the various Dr
and σ0'
on Toyoura sand .
4.2 Torsional Shear (TS) Test Results under Undrained Condition
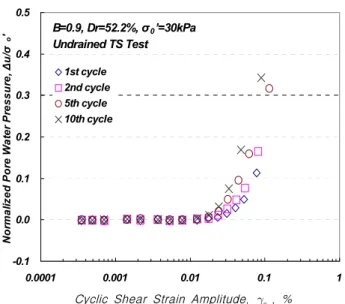
The variations in the normalized pore water pressure, Δu/σ0'
, which is the cyclic pore water pressure normalized by effective confining pressure, with cyclic shear strain amplitude, are plotted in Figure 11. The pore water pressure does not increase at strains below about 0.01%
and above this strain, the Δu/σ0'
increases with the number of cycle.
The values of Δu/σ0'
versus log with different B-values are plotted in Figure 12. The Δu/σ0'
after 10 loading cycles increases as B-value
제7권 제1호 2006년 2월 65
-0.1 0.0 0.1 0.2 0.3 0.4 0.5
0.0001 0.001 0.01 0.1 1
Cyclic Shear Strain Amplitude, γc, % Normalized Pore Water Pressure, ∆u/σo'
1st cycle 2nd cycle 5th cycle 10th cycle
B=0.9, Dr=52.2%, σ0’=30kPa Undrained TS Test
Cyclic Shear Strain Amplitude, Cyclic Shear Strain Amplitude, , % , % Fig. 11. Typical Variation in Δu/σ0'
with measured by undrained TS tests
increases. This means the liquefaction potential varies according to B-value. In this reason, the effect of the B-value on the soil behaviors at undrained conditions must be considered.
-0.1 0.0 0.1 0.2 0.3 0.4 0.5
0.0001 0.001 0.01 0.1 1
Cyclic Shear Strain Amplitude, γc, %
Normalized Pore Water Pressure, ∆u/σo'
B=0.01 Dr=52.4%
B=0.28 Dr=48.9%
B=0.4 Dr=49.6%
B=0.67 Dr=47.6%
B=0.83 Dr=50.9%
B=0.9 Dr=52.2%
B=0.97 Dr=53%
B=0.99 Dr=50.6%
σ0’=30kPa, 10th cycle Undrained TS Test
Cyclic Shear Strain Amplitude, , % Fig. 12. Variation of Δu/σ0'
versus log with Different B-value
The normalized shear modulus reduction (G/Gmax-log ) and damping ratio curve (D-log ) with different B-values are displayed in Figure 13a and 13b, respectively. It can be noticed that the effects of B-value on G/Gmax and D curves
are negligible. Based on this study, the applicability of developed TS testing system on the measurements of Vp, Vs and pore pressure buildup was verified and further studies are needed.
0.0 0.2 0.4 0.6 0.8 1.0
0.0001 0.001 0.01 0.1 1
Cyclic Shear Strain Amplitude, γc, % Normalized Shear Modulus, G/Gmax
B=0.01 Dr=52.4%
B=0.28 Dr=48.9%
B=0.4 Dr=49.6%
B=0.67 Dr=47.6%
B=0.83 Dr=50.9%
B=0.9 Dr=52.2%
B=0.97 Dr=53%
B=0.99 Dr=50.6%
σ0’=30kPa, 10th cycle Undrained TS Test
Cyclic Shear Strain Amplitude, , % Cyclic Shear Strain Amplitude, , % a) Normalized Shear Modulus Reduction Curve
(G/Gmax-log)
0.0 4.0 8.0 12.0 16.0 20.0 24.0 28.0
0.0001 0.001 0.01 0.1 1
Cyclic Shear Strain Amplitude, γc, %
Damping Ratio, D, %
B=0.01 Dr=52.4%
B=0.28 Dr=48.9%
B=0.4 Dr=49.6%
B=0.67 Dr=47.6%
B=0.83 Dr=50.9%
B=0.9 Dr=52.2%
B=0.97 Dr=53%
B=0.99 Dr=50.6%
σ0’=30kPa, 10th cycle Undrained TS Test
Cyclic Shear Strain Amplitude, , % Cyclic Shear Strain Amplitude, , %
b) Damping Curve (D-log )
Fig. 13. G/Gmax, D versus log with Different B-value
4. Conclusions
In this study, the existing Stokoe-type torsional shear equipment is modified to determine Vp, Vs
and Δu of partially and fully saturated specimens
during undrained TS tests. To develop the saturation and measurement of pore water pressure in TS equipment, a quick connector and back pressure system is added in TS equipment.
The bender elements and two accelerometers are mounted on top cap and bottom pedestal to measure Vs and Vp, respectively. Also, the height-change monitoring device is added to correct the wave propagation length in determining Vs and Vp.
The bender element testing results indicate that the Vs and Gmax tend to decrease slightly with the increase of the B-value. The Vp tends to increase significantly with increase of B-value. The results of this paper (Dr=50% and σ0'
=30kPa) is compared with the theoretical equations with the skeleton Poisson's ratio( =0.25, 0.3, 0.35, 0.4) and matched to the equation of =0.4. The Δu/σ0'
in
undrained TS tests increase as B-value increases and the effects of B-values on G/Gmax and D curves are relatively smaller than the pore water pressure buildup.
Acknowledgments
This study was supported by the fund of Construction Research and Development Program (04 construction kernel A01-08) Contributed by Ministry of Construction and Transportation and committed by Korea Institute of Construction and Transportation Technology Evaluation and Planning (KICTTEP)
(접수일자 : 2005년 9월 6일)
REFERENCES
1. Chaney, R.(1978), Saturation effects on the cyclic strength of sands. Earthquake Engineering and Soil Dynamics, Vol. 1, pp. 342~358.
2. Chen, A.T.F. and Stokoe. K.H., II(1979), Interpretation of strain dependent modulus and damping from torsional soil tests. Report No. USGS-GD-79-002, NTIS No. PB-298479, U.S. Geological survey, pp. 46.
3. Grozic, J. L., Robertson, P. K. and Morgenstern, N. R.(1999), The behavior of loose gassy sand. Canadian Geotechnical Journal, Vol. 37, pp. 843~856.
4. Hardin, B. O. and Richart, F. E. Jr.(1963), Elastic wave velocities in granular soils. Journal of the Soil Mechanics and Foundations Division, ASCE, Vol. 89, No. 1, pp. 33~35.
5. Ishihara, K.(1996), Soil Behaviour in Earthquake Geotechnics. Oxford University Press Unc., New York, pp. 120~123.
6. Kokusho, T.(2000), Correlation of pore-pressure B-value with P-wave velocity and Poisson's ratio for imperfectly saturated sand or gravel. Soils and Foundations, Vol. 40, No. 4, pp. 95~102.
7. Nishio, S.(1987), Effect of saturation on elastic wave velocities of sand gravel. Proc. of Recent Advances in Study of Engrg. Properties of Unsaturated Soil, JGS, pp. 221~224.
8. Santamarina, J. C., Klein, K. A. and Fam, M. A.(2001), Soils and Waves. John Wiley & Sons, LTD.
9. Sherif, M. A., Ishibashi, I. and Tsuchiya, C.(1977), Saturation effect on initial soil loquefaction. J. Geotech. Engng Div., ASCE Vol. 103, pp. 914~917.
10. Skempton, A. W.(1954), The pore pressure coefficients A and B. Geotechnique. Vol. 47, pp. 133~147.
11. Tamura, S., Tokimatsu, K., Abe, A. and Sato, M.(2002), Effects of air bubbles on B-value and P-wave velocity of a partly saturated sand. Soils and Foundations. Vol. 42, No. 1, pp. 121~129.
12. Tsukamoto, Y., Ishihara, K., Nakazawa, H., Kamada, K. and Huang, Y.(2002), Resistance of partly saturated sand to liquefaction with reference to longitudinal and shear wave velocities. Soils and Foundations, Vol. 42, No. 6, pp. 93~104.
13. Yoshimi, Y., Yanaka, K. and Tokimatsu, K.(1989), Liquefaction resistance of a partially saturated sand. Soils and Foundations, Vol. 29, No. 2, pp. 157~162.