Korean J Environ Agric (2011) Online ISSN: 2233-4173 Vol. 30, No. 4, pp. 395-401 http://dx.doi.org/10.5338/KJEA.2011.30.4.395 Print ISSN: 1225-3537
Physiological and Proteomics Analysis to Potassium Starvation in Rice
Sang Gon Kim,
1Yiming Wang,
1Chang Hoon Lee,
2Yong Hun Chi,
1Keun‐Ki Kim,
3In Soo Choi,
4Yong Chul Kim,
4Kyu Young Kang
1,2and Sun Tae Kim
4*1
Plant Molecular Biology and Biotechnology Research Center,
2
Division of Applied Life Science (BK21 program), Gyeongsang National University, Jinju 660‐701, Republic of Korea
3
Department of Life Science and Environmental Biochemistry,
4Department of Plant Bioscience, Pusan National University, Miryang 627‐706, Republic of Korea
Received: 5 December 2011 / Accepted: 26 December 2011
ⓒ 2011 The Korean Society of Environmental Agriculture
*Correspondence author,
Phone:+82‐55‐350‐5505; Fax: +82‐55‐350‐5509;
E‐mail: [email protected]
395
Abstract
BACKGROUND: Potassium (K) is one of the macro- nutrients which are essential for plant growth and development. Its deficiency in paddy soils is becoming one of the limiting factors for increasing rice yield in Asia.
METHODS AND RESULTS: To investigate physiological symptoms under K‐starvation (NP) compared with complete media (NPK) condition, we measured shoot/root length, weight, nutrients, and patterns of protein expression.
The shoot growth was significantly reduced, but root growth was not affected by K‐starvation. However, biomasses were decreased in both shoot and root. Uptake of K was reduced up to 85%, while total concentrations of P, Ca, Mg, Na were increased in root and shoot. To better understand the starved K mechanism of rice, comparative proteome analysis for proteins isolated from rice leaves was conducted using 2‐DGE. Five spots of differentially expressed proteins were analyzed by MALDI‐TOF MS. Analysis of these K‐
starvation response proteins suggested that they were involved in metabolism and defense.
CONCLUSION(s): Physiological and 2‐DGE based
proteomics approach used in our study results in observation of morphology or nutrients change and identification of K‐
starvation responsive proteins in rice root. These results have important roles in maintaining nutrient homeostasis and would also be useful for further characterization of protein function in plant K nutrition.
Key Words: Potassium starvation, Proteomics, Rice, 2‐
DGE
Introduction
Potassium (K
+) is an important macronutrient, essential for plant vital functions in metabolism, growth, and stress adaptation. Although concentrations of K
+in soil solution are low (Adams, 1971), K
+is the most abundant nutrients in plants, constituting up to 10% of a plant’s dry weight (Leigh and Jones, 1984).
Its availability is dependent upon total K content for acquiring K
+from solution. K
+deficiency is of great agricultural importance (Laegreid et al., 1999). It is well documented that K
+starvation causes to growth arrest, aggravated nitrogen and sugar balance, and increased susceptibility to pathogens (Marschner, 1995).
To overcome K‐starvation, plants have developed many adaptive strategies, which involve arrest of
Open Access
Research Article
lateral root development (Armengaud et al., 2004; Shin and Schachtman, 2004), transport of K
+across various membranes in various tissues (Amtmann et al., 2004) to enhance K usage. Although physiological response and K
+transport mechanisms to K deficiencies have been studied at the molecular level (Véry and Sentenac, 2003), Much less is known about the molecular nature of adaptive responses at the level of proteins.
In the present study, integrated physiology and 2‐
dimensional gel electrophoresis (2‐DGE)‐based proteomics approaches were used to identify differentially expressed proteins responsive to K‐starvation. Identified proteins were broadly related to metabolism and defense/stress response and were possibly associated with observed root physiology caused by K‐starvation.
Findings of the present study could help in better understanding the K‐starvation mechanism in plants, and provide a basis for further characterization of function and regulation of K‐starvation‐responsive proteins.
Materials and Methods
Plant material and growth conditions
Mature rice seeds (cv. Jinheung) were obtained from the Department of Functional Crop, National Institute of Crop Science (NICS), Rural Development Administration (RDA) (Miryang, Korea). Dehulled seeds were sterilized and imbibed according to the method of Kim et al. (2011). Seeds were then grown on a plastic supporting netting (mesh 1 mm
2) mounted in plastic containers at 28℃ for 7 days. Seedlings thus obtained were transferred to complete or K‐deficient nutrient solution in plastic container, and each plantlet was placed on plastic panels with 4 mesh (0.33 cm
2). The complete media nutrient solution contained: 1.07 mM NH
4NO
3, 0.03 mM NaH
2PO
4·2H
2O, 0.39 mM K
2SO
4, 0.39 mM KCl, 1.25 mM CaCl
2·2H
2O, 0.82 mM MgSO
4·7H
2O, 35.8 μM FeSO
4·7H
2O, 9.1 μM MnSO
4·4H
2O, 46.3 μM H
3BO
3, 3.1 μM ZnSO
4·7H
2O, 0.16 μM CuSO
4·5H
2O, and 0.05 μM Na
2MoO
4·2H
2O.
The K‐starved nutrient solution was the same as complete media but without 0.39 mM K
2SO
4and 0.39 mM KCl. The pH of solution was adjusted to 5.8. Plants were grown for 3 weeks at 28℃ and during this period, media were replaced every week with freshly prepared nutrient solutions. Root samples were collected, washed with sterilized distilled water, removed excess water on paper towel, frozen immediately
in liquid nitrogen, and stored at ‐80℃.
Analysis of physiological parameters of rice growth Three‐week‐old rice seedlings were separated from complete media and K‐starved nutrient solutions for physiological parameters analyses. Twenty seedlings were pooled together for each biological replication;
each experiment included three biological replicates in which seedlings were collected from three independent containers. For each seedling, the shoot length and length of the three longest roots were measured.
Analysis of macronutrient contents in rice
Dried samples were digested with sulfuric acid and hydrogen peroxide (Mizuno and Minami, 1980). Total N was measured by the semi‐micro Kjeldahl method and P by the yellow vanado‐molybdate method, as described by Watanabe et al. (1998). The contents of K, Ca, Na, and Mg were measured by Inductively Coupled Plasma Mass Spectrometry (ICP‐MS, Perkin Elmer, Massachusetts, USA).
Differences between complete media and K‐starved seedlings were assessed using Tukey tests (p < 0.05). SAS software ver 9.3 (SAS Institute, Cary, NC) was used for all statistical analysis.
Protein preparation and 2-DGE analysis
Two grams roots of three‐week‐old rice seedlings were treated with Mg/NP‐40 followed by phenol to extract total protein (Kim et al., 2008a). Total root protein was extracted from three independent biological samples. The 2‐DGE and image analysis were performed as described previously (Kim et al., 2011). Briefly, a total of 250 μg protein was loaded on 18‐cm immobilized pH gradient (IPG) strips (pH 4‐7).
The IPG strips were equilibrated as described previous research (Kim et al., 2011) and focused at 50 V for 8 h, 100 V for 1 h, 500 V for 1 h, 1000 V for 1 h, 2000 V for 1 h, 4000 V for 2 h, 8000 V for 5 h, 8000 V for 3 h, 20 V for 2 h, by IPGphore3 platform (GE healthcare, Waukesha, WI) and then 12% sodium dodecyl sulfate polyacrylamide gel electrophoresis (SDS‐PAGE) was carried out perpendicularly to the previous run. Separated proteins were stained with colloidal Coommassie brilliant blue G‐250 (CBB) following the method of Kim et al. (2008b). Stained gels were scanned using a transmissive scanner (PowerLook III, UMAX, Fort Worth, TX). For this analysis, pixel depth was 16 bit;
resolution was 300 dpi; brightness and contrast were
set to default. Digitized gel images were analyzed
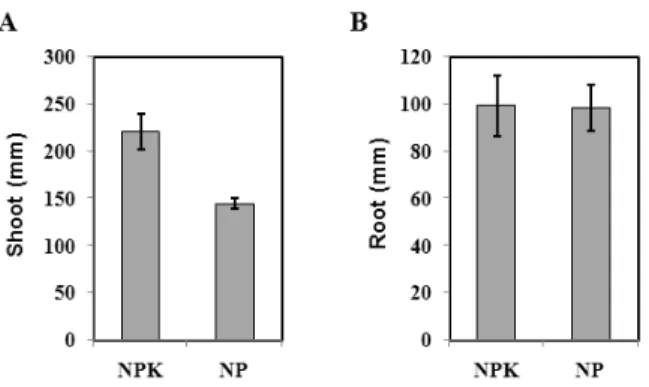
Fig. 1. Effects of K-starvation on the growth of rice. Shoot (A) and root length (B) of 3‐week‐old seedlings were measured. Results were shown as means with the standard deviations. NPK; Complete media, NP; K starvation.
Fig. 2. The dry weight (DW) of rice grown with K-starvation of 3-week-old plant. Shoot (A) and Root (B).
NPK; Complete media, NP; K starvation.
using the ImageMaster 6.0 2D Platinum software (Amersham Biosciences AB, Uppsala, Sweden). A minimum of three independent experiments were used to evaluate precision and the averaged images for 2‐D gels were presented in this study.
In-gel digestion and matrix-assisted laser desorption/
ionization-time of flight (MALDI-TOF) mass spectrometry Protein spots were carefully cut off in CBB‐stained gels, digested with trypsin, and peptides were extracted peptides according to the method of Kim et al. (2008b).
Extracted peptide mixture was re‐dissolved in a solution composed of distilled water, acetonitrile, and trifluoro- acetic acid (93:5:2; volume basis), bath‐sonicated for 5 min, and centrifuged for 2 min at 14,000 rpm. The matrix solution was prepared by dissolving α‐cyano‐4‐
hydroxycinnamic acid (Sigma, St. Louis, MO) in acetone (40 mg/mL) and nitrocellulose in acetone (20 mg/mL).
The α‐cyano‐4‐hydroxycinnamic acid, nitrocellulose, and isopropanol solutions were mixed at 100:50:50 (volume basis), followed by addition of 2 μL of this master matrix mixture to 2 μL of the prepared peptide sample.
One microliter of the peptide and matrix mixture was spotted immediately onto a MALDI plate and left for 5 min. The MALDI plate was then washed with 0.1%
(v/v) TFA. The gel spots were analyzed using a Voyager
‐DE STR MALDI‐TOF mass spectrometer (PerSeptive Biosystems, Framingham, MA) as described by Kim et al.
(2004). For data analysis, Moverz program (http://
bioinformatics.genomicsolutions.com) was used and Database searches were performed using Mascot (http://www.matrixscience.com). To determine the confidence of the identification results, the following criteria were used: more than five matching peptides and sequence coverage greater than 15%.
Results and Discussion
Analysis of plant growth and nutrient contents under K-starvation condition
In response to K‐starvation, plants have developed physiological and biochemical mechanisms to acquire K
+from the external environment (Ashley et al., 2006;
Marschner, 1995). In the present study, three physiological changes [(i) length of shoot and root and (ii) dry weight (DW) of shoot and root (iii) nutrient contents of shoot and root] were measured to determine the effect of K‐starvation on rice growth and the data were compared with an appropriate
control. The growth and dry weights of leaves and roots of rice at seedling stage were comparable with that of control plants grown in a complete nutrient solution for 3 weeks after K was depleted. The means of three experiments were used. These measurements revealed that length of shoots decreased up to 34.4%
but length of roots was little changed (Fig. 1A, 1B).
Dry weight of shoots decreased up to 18.8%, and that of root decreased up to 53.3% compared to the complete nutrient solution after K‐starvation (Fig. 2A, 2B). The inhibition of leaf growth by K‐starvation was probably attributed to the suppression in photo- synthesis (Bednarz et al., 1998; Zhao et al., 2001) and root growth was little affected by K‐starvation.
However, the exact mechanism involved is yet unclear.
It could be hypothesized that plants have possibly developed mechanisms to adapt to short‐term shortage of K
+supply (Armengaud et al., 2004; Marschner, 1995).
To understand the effect of K‐starvation on
availability of other nutrients, we also analyzed N, P,
Treatments (3 week)
Nutrient contents (mg/kg)
N P K Ca Mg Na
Shoot
NPK 29.26 b 3.09 c 25.06 a 1.28 c 2.43 c 0.54 c
NP 29.08 b 4.95 a 3.15 c 2.15 b 4.60 a 3.42 a
Root
NPK 24.96 a 3.56 c 16.07 a 0.69 c 1.09 c 0.59 d
NP 18.06 c 5.66 a 1.61 c 1.64 b 1.81 a 2.92 b
F-test *** *** *** *** *** ***
Each value represents the average of three individual identical experiments. Values followed by different lowercase letters indicate that the means differ significantly (P < 0.05) within a row
Table 1. Major nutrient contents of 3-week stages plant under complete (NPK) media and K-starvation (NP) condition.
Shoot and root tissues of 3‐week stage plant under K starvation condition were harvested. N, P, K, Ca, Mg, and Na contents were measured.
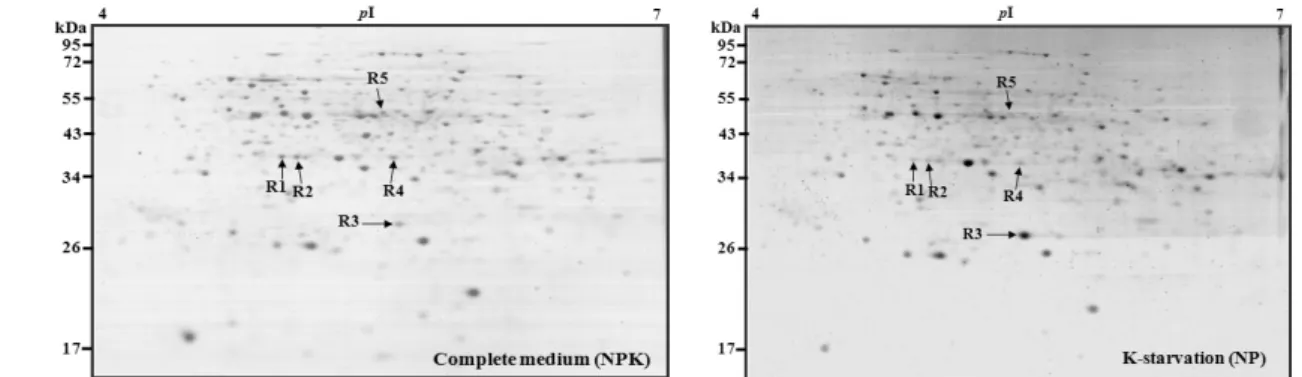
Fig. 3. Two-DE analyses of differentially induced proteins in rice root grown in different starvation medium.
Seedlings were grown for 3 weeks under complete medium (A) and K starvation (B). Root samples in 15%
PEG fractions were separated on 2‐DE gels (pI 4~7).
Ca, Mg, and Na contents in three‐week‐old roots and leaves under complete (NPK) and K‐starved (NP) conditions. Contents of P, Ca, Mg, and Na in both root and leaf were increased under K‐starvation (Table 1). However, contents of N were little changed or reduced in shoot and root (Table 1).
Protein separation by 2-DGE analysis
To compare proteins that were accumulated in complete (NPK) and K‐starvation (NP) conditions, we extracted proteins from rice roots grown in pairs (NPK vs. NP) for 3 weeks using phenol extraction with neutral IPG strips (pH 4–7) to obtain the best resolution of proteins on 2‐DGE gels. CBB‐stained gels were repeated three times with independent protein samples (Fig. 3). More than 150 proteins were detected by 2‐DGE. Five proteins were differentially expressed as are sult of K‐starvation (Fig. 4A, 4B).
Among these proteins, spot 3 was markedly increased under the K‐starvation condition, whereas spots 1, 2, 4, and 5 were decreased (Fig. 4A, 4B). These results
suggest that K‐starvation caused the up‐ or down‐
regulation of a few proteins in rice roots, possibly in response to plant adaptations under K-starvation.
Identification of proteins involved in rice roots responding to K-starvation
For better understanding of the rice plant’s mechanism to adapt under K‐starvation, we analyzed the differentially expressed proteins by MALDI–TOF and identified by database searches with Mascot (http://www.matrixscience.com). These proteins which responded to K‐starvation were found to be involved in defense and stress (spot R3), and metabolism (spots 1, 2, 4, and 5) (Table 2).
The flavone O‐methyltransferase (FOMT, spot R1) is involved in phenylpropanoid. The roles of flavonoid compounds in plants are as diverse as their structures, and their contributions in plant may vary such as coloration, protection from UV irradiation, defense against pathogens (Dixon and Steele, 1999;
Winkel‐Shirley, 2001). In our proteome research,
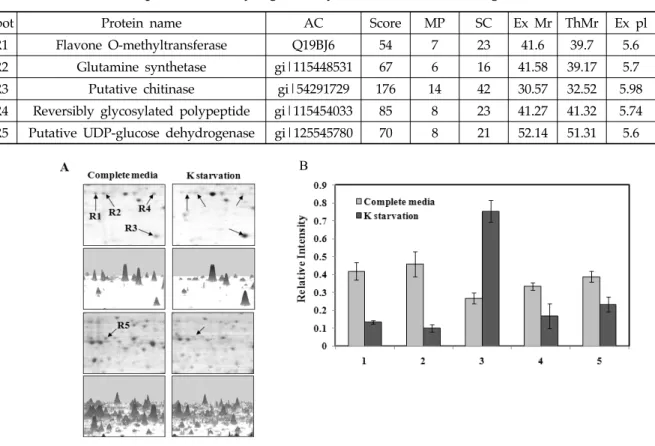
Spot Protein name AC Score MP SC Ex Mr ThMr Ex pl ThpI
R1 Flavone O-methyltransferase Q19BJ6 54 7 23 41.6 39.7 5.6 5.41
R2 Glutamine synthetase gi|115448531 67 6 16 41.58 39.17 5.7 5.51
R3 Putative chitinase gi|54291729 176 14 42 30.57 32.52 5.98 6.08
R4 Reversibly glycosylated polypeptide gi|115454033 85 8 23 41.27 41.32 5.74 5.82 R5 Putative UDP-glucose dehydrogenase gi|125545780 70 8 21 52.14 51.31 5.6 5.67 Table 2. Identification of spots differentially regulated by K-starvation in root using MALDI-TOF
B
Fig. 4. Enlarged images of differentially induced proteins in response to K starvation condition in rice roots. 3‐D image were generated by Imagesmaster 2D Platinum Version 6.0 (GE healthcare Amersham Bioscience) (A) and quantitative analysis of differentially induced root proteins on 2‐DE gels (B).