Korean J Environ Agric (2011) Online ISSN: 2233-4173
Vol. 30, No. 2, pp. 196-201 DOI : 10.5338/KJEA.2011.30.2.196 Print ISSN: 1225-3537
Pharmacokinetic Characterization of Nano-emulsion Vitamin A, D and E (LaVita) in Rats
Young-Ju Lee,
1Min Kwon,
1Tae-Hwan Kim,
2Kyun Kim,
1Sang-Hee Jeong
1and Hee-Ra Chang
1*1Hoseo Toxicological Research Center, Hoseo University, Asan, 336-795, Korea
2Technology Institute, KNBP Inc., Yesan, 340-861, Korea
Received: 1 June 2011 / Accepted: 24 June 2011
ⓒThe Korean Society of Environmental Agriculture
*교신저자(Corresponding author):
Tel: +82-41-540-9696 Fax: +82-41-540-9867 E‐mail: [email protected]
196
Abstract
BACKGROUND: Bioavailability enhancement by solu- bilization of lipophilic drugs in nano-emulsion has been reported and it may be useful in pharmaceutical and nutraceutical products. This study was performed to compare in vivo bioavailability of nano-emulsion formu- lation with that of the general product as control.
METHODS AND RESULTS: The pharmacokinetics assessment of Vitamin A, D and E complex of nano- emulsion formulation (LaVita), in comparison to the general product, was performed in the male rat plasma by a single oral dose at 20 mL/kg body weight (n=3/group).
For nano-emulsion formulation (LaVita), C
maxof vitamin A and E in plasma were much higher and the area under the curve (AUC) of vitamin A, D and E were 14-63%
higher, and the half-life of vitamin E was 2-fold longer than the general product. According to statistical analysis, each C
maxof vitamin A, D & E was significantly higher (p<0.01, 0.05 and 0.01, respectively) than that of general product. Half-life of vitamin A was significantly higher (p<0.01) and AUC of vitamin A and D were also significantly higher than the general product.
CONCLUSION(s): Considering significant increment of C
maxand AUC, LaVita made of nano-emulsion could be more effective the absorption rate and extent for bioavail- ability of vitamin A, D & E than those of general product.
Key Words: Bioavailability, Fat-soluble vitamin, Nano- emulsion, Pharmacokinetics, Plasma
Introduction
LaVita, nano-emulsion vitamin A, D and E, was a newly developed by Korea BNP, INC., for usage in drinking water or feeds of poultry and livestock.
Vitamin A, D and E, have important functions of the human and animal body such as vision (Vitamin A), calcium absorption (Vitamin D) and antioxidant (Vitamin E) (Heudi et al. , 2004; Mendoza ea al., 2003).
These functions are affected by the fat-soluble vitamin concentration and many pathological signs appear with deficiency or overdose of vitamins (Gomis et al. , 1994). Our body has a disposing capability of excess vitamins resulting in a loss to the system of the vitamins taken. Therefore, a critical aspect of vitamin A, D and E supplements is the ability to absorb the composition into the body and maintain effectiveness.
Many unique aspects of nano-emulsions with droplet sizes in the range of 20-200 nm attributes to be utilized within an increasing number of industrial products, including food, pharmaceuticals, cosmetics, personal care products, and chemicals (Lee et al. , 2011; Solans et al. , 2005). Nano-emulsions were pro- posed for application in pharmacy as delivery systems of poorly permeable and highly lipophilic drugs for enhancing solubility and permeation properties (Bruse- witz et al. , 2007; Gutierrez et al. , 2008; Hatanaka et al. ,
Open Access
Research Article
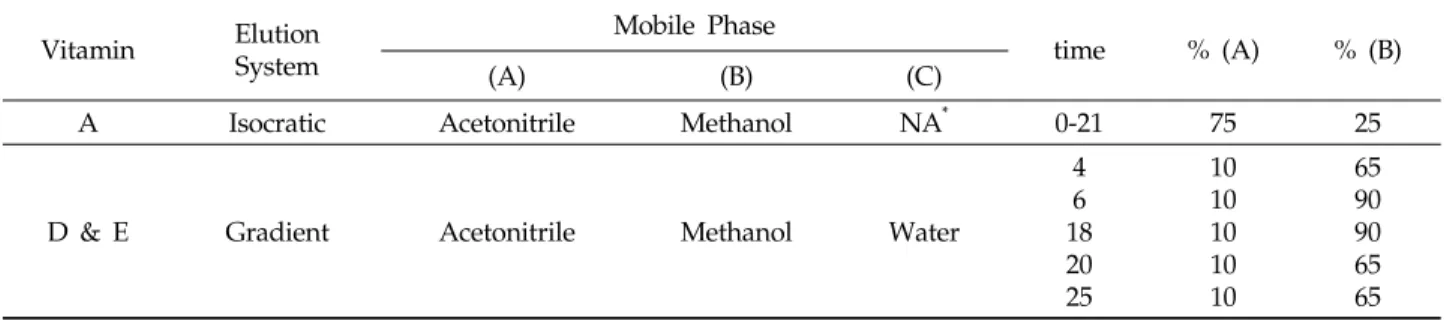
Table 1. The elution methods for vitamin A, D and E analyses by HPLC
Vitamin Elution System
Mobile Phase
time % (A) % (B)
(A) (B) (C)
A Isocratic Acetonitrile Methanol NA* 0-21 75 25
D & E Gradient Acetonitrile Methanol Water
4 6 18 20 25
10 10 10 10 10
65 90 90 65 65
*NA: Not applicable
2010; Solans et al. , 2005; Tadros et al. , 2004). Enhance- ment of bioavailability by solubilization of lipophilic drugs in nano-emulsion has been reported and then in vivo and in vitro studies confirmed that nano- emulsion enhanced the penetration of vitamin E acetate (Kang et al. , 2002).
The purpose of this present study was to evaluate the pharmacokinetic profiles (Tmax, C
max, half-life and AUC) of nano-emulsion vitamin A, D and E in rats by an oral application, in comparison to general product.
Materials and Methods
Chemicals
LaVita and general product were provided by Korea BNP, INC. The contents of vitamin A, D and E in these products were 50,000,000 IU/L, 5,000,000 IU/L and 20,000 IU/L, respectively. Vitamin A (Retinol palmitate, 94.7%), vitamin D (cholecalciferol, 98%), Vitamin E-OAc (DL-α-tocopherol acetate, 97.8%) and Vitamin E-OH (DL-all-rac-α-tocopherol, 95.5%) were purchased from Sigma-Aldrich Co. (St. Louis, MO). High-performance liquid chromatography (HPLC) grade methanol, acetonitrile, hexane and water were purchased from Merck, Germany. All of other reagents were of analytical grade (Junsei Chemical Co., Japan).
Animals and dose administration
Male Sprague-Dawley 9 rats, approximately 5 weeks old, were obtained from Orient Bio Inc.
(Korea) and acclimated for 3 weeks before dosing.
The animals were housed in polycarbonated cages at 22 ± 3°C and 50 ± 20% humidity with a 12 h light/
dark cycle. The food (LabDietM
®, Orient Bio Inc.) and water were available adlibitum during the study. For the study, rats weighing 372.6±14.6 g were separated to three dose groups consist of 3 rats per group
(blank, treatment of general product and treatment of LaVita) and were orally administrated at a single dose of 20 mL containing 1,000,000 IU of vitamin A, 100,000 IU of vitamin D and 400 IU of vitamin E per kg body weight (n=3/group).
Sample collection
Blood samples (2 mL) were taken from the retro- orbital of each rat at 0.5, 3, 6, 24, 48, 72, 168, 196 h after oral administration. Blood samples were col- lected in heparinized tubes and centrifuged at 15000 rpm for 10 min at room temperature to separate plasma.
Sample preparation
Three replicate aliquots (0.4 mL) of plasma in 2 mL tube were added to 0.3 ml of 20% isopropanol in methanol and mixed by vortexing for 15 sec. The mixture was extracted with 0.7 mL of hexane, mixed for 3 min, centrifuged at 10,000 rpm for 3 min, and the hexane layer was removed. The aqueous phase was further extracted twice in the same way. The total extracts were evaporated to dryness under a nitrogen stream, and the residue was re-dissolved in 0.2 ml of 50% methanol in chloroform for HPLC analysis.
HPLC analysis
Determination of vitamin A, D , E-OAc (acetate) and E-OH (phenol) concentration were performed on the Agilent 1200 Series HPLC system equipped with Diode-Array Detector (DAD). A reverse-phase Hypersil
TMGold column (250 mm × 4.6 mm, 5-μm particle;
Thermo Scientific) was used at 40°C and the flow rate
was 1.0 mL/min. Detection monitoring was performed
at 330 nm for vitamin A and 280 nm for vitamin D
and E E (-OAc and -OH). The elution system for
three vitamins was described Table 1. Under these
Table 2. Recovery, limit of detection and limit of quantification for determination of vitamin A, D and E in rat plasma Vitamin Fortified level
(mM)
Recovery ± CV1) (%)
LOD2) (mM)
LOQ3) (mM)
A 0.005 91.9 ± 6.3
0.0005 0.0015
0.0125 87.9 ± 5.0
D 0.005 82.4 ± 8.4
0.00025 0.00075
0.0125 81.6 ± 2.6
E
-OAc 0.005 90.4 ± 6.5
0.0005 0.0015
0.0125 80.5 ± 7.8
-OH 0.005 89.5 ± 2.3
0.0125 83.4 ± 2.0
1)Coefficient of variation = standard deviation / average × 100
2)LOD : Limit of Detection
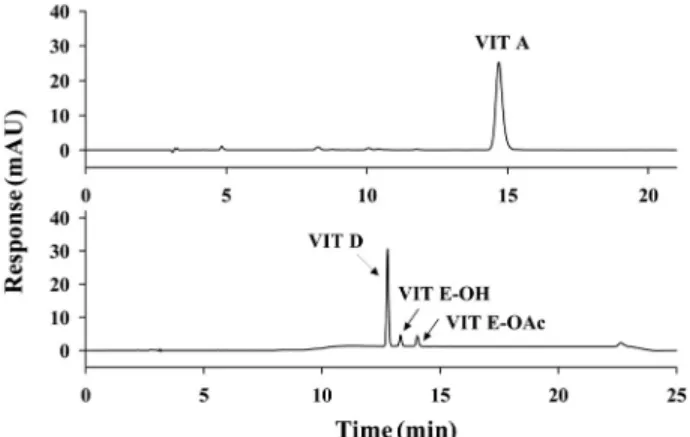
3)LOQ : Limit of Quantification (3 times of LOD) Fig. 1. Representative chromatograms of the standard solutions of vitamin A, D and E(-OAc and -OH) by HPLC analysis.
conditions, the retention times of vitamin A, D, E-OAc and E-OH were 14.7, 12.8, 14.0 and 13.4 min, respectively (Fig. 1).
Analytical method
Limit of detection (LOD) is determined as a signal three times the noise level considering all of the analytical operations on a sample including dilution and concentration factors. Limit of quantification (LOQ) is set at 3 times of LOD. Vitamin A was dis- solved in methanol:chloroform (1:1,v/v) and vitamin D and E (-OAc and -OH) were dissolved in methanol to make stock solution of 2 mM. After the vitamin A, D and E (-OAc and -OH) standard solution was prepared by mixing at the concentration of 0.2 mM with methanol, the working solutions for a calibration curve were prepared at the concentration of 0.0005, 0.001, 0.002, 0.005, 0.01, 0.02, 0.1 mM by serial dilution with methanol. Recovery was carried out by
fortifying untreated blank plasma (400 μl) with standard mixtures of vitamin A, D and E (-OAc and -OH) to reach concentrations of 0.005 and 0.0125 mM.
The sample preparation was carried out by the same procedure as mentioned above for HPLC analysis.
Pharmacokinetic data analysis
Pharmacokinetic analysis for plasma concentration was conducted using WinNonlin (ver.5.2.1, Pharsight Co., USA) and the pharmacokinetic parameters [T
max, t1/2, C
max, AUC
all] were determined. Statistical tests were performed using STATISTICA (’99 Edition, StatSoft, Inc., USA). Comparison between the different groups was analyzed by one-way analysis of variance (ANOVA) was followed by Duncan’s multiple range tests. The P value <0.05 was considered statistically significant.
Results and Discussion
Analytical method
The values of LOD of vitamin A, D and E were 0.0005, 0.00025 and 0.0005 mM, respectively. The values of LOQ determined at 3 times of LOD of vitamin A, D and E (-OAc and -OH) were 0.0015, 0.00075 and 0.0015 mM, respectively (Table 2). The calibration curves were fitted with high linearity in the range of 0.0005 - 0.1 mM, covering the whole range concentrations in samples. The correlation values (R
2) of vitamin A, D and E were higher than 0.999.
The recoveries of vitamin A, D and E were in the
range of 80.5-91.9% for two different concentration
levels (Table 2). Vitamin A, D, E-OAc and E-OH were
recovered from the plasma with a high yield and
reproducibility of 91.9±6.3, 82.4±8.4, 90.4±6.5 and 89.5±2.3% at 0.005 mM and 87.9±5.0, 81.6±2.6, 80.5±7.8 and 83.4±2.0% at 0.0125 mM, respectively, indicating that good extraction method is established.
Plasma Concentration and Pharmacokinetic Analysis The plasma concentrations of vitamin A, D and E (-OAc and -OH) in rat were determined by HPLC analysis (Fig. 2, 3). Vitamin E-OAc is the most commonly used form in vitamin E supplements, but vitamin E-OAc is biologically inactive and rapidly hydrolyzed to the vitamin E-OH in the plasma (Burton et al. , 1988, 1990; Gonzalez et al. , 1990;
Hidiroglou et al. , 1994). Therefore, the level of vitamin E was calculated by summing the concentration of E-OH and E-OAc form. The mean plasma concent- ration versus time profiles in rat plasma after single dose administration is showed in Fig. 4. The plasma concentration of LaVita was higher than general product in rat except for 24 h of vitamin A.
Fig. 2. Representative chromatograms of vitamin A in plasma sample after oral administration of LaVita and general product by HPLC analysis.
Fig. 3. Representative chromatograms of vitamin D and E (-OAc and -OH) in plasma sample after oral administra- tion of LaVita and general product by HPLC analysis.
Fig. 4. Vitamin A, D and E concentrations in rat plasma after a single oral administration of LaVita and general product.
The pharmacokinetic parameters of vitamin A, D, and E are showed in Table 3. The time required to reach peak plasma concentration (T
max) of Vitamin A after dosing was 6 h in LaVita and general product.
Mean peak plasma concentrations (C
max) were 0.39±
0.01 mM for LaVita and 0.25±0.03 mM for general product. The other pharmacokinetic parameters showed that the half-lives for LaVita and general product were 12.70 and 10.52 h, respectively and the area under the plasma concentration-time curve (AUC) for LaVita was higher than for the general product.
According to statistical analysis, C
maxand half-life of
vitamin A in LaVita were significantly higher (p<0.01)
than general product.
Table 3. The pharmacokinetic parameters of vitamin A, D and E in LaVita and general product after single oral administration
Parameters VIT A VIT D VIT E (OAc+OH)
General Product LaVita General Product LaVita General Product LaVita Tmax (h)1) 6.00±0.0 6.00±0.0 24.00±0.0 24.00±0.0 32.00±13.86 24.00±0.0 Cmax (mM)2) 0.25±0.03 0.39±0.015) 0.008±0.001 0.01±0.0016) 0.20±0.004 0.34±0.025)
t1/2λz(h)3) 10.52±0.21 12.70±0.405) 25.35±6.87 26.10±1.46 20.16±10.58 45.26±12.15
AUCall
(μg・h/mL)4) 8.64±0.35 9.87±1.53 0.48±0.03 0.59±0.025) 11.10±1.04 18.08±1.435)
1) time to maximum concentration
2) maximum concentration
3) half-life
4) area under the curve of plasma concentration versus time from t=0 to t=∞ after oral administration
5) p value < 0.01
6) p value < 0.05