1 접수 2012년 3월 26일, 수정(1차: 2012년 4월 16일, 2차: 2012년 5월 9일), 게재확정 2012년 5월 10일 Received 26 March 2012; Revised(1st: 16 April 2012, 2nd: 9 May 2012); Accepted 10 May 2012 2 대전대학교 생명과학과 Dept. of Biology, Daejeon University, Daejeon(300-716)
3 국립환경과학원 National Institute of Environment Research, Incheon(404-708), Korea
* 교신저자 Corresponding author([email protected])
A Study of the Butterfly Community of Mt. Gyeryong National Park, Korea
1Sung-Jae Jeon2, Youngho Cho2, Yong-Gu Han2, Youngjin Kim2, Min-Joo Choi2, Youngjun Park3, Sang-Ho Nam2*
계룡산국립공원의 나비류 군집에 관한 연구1
전성재2․조영호2․한용구2․김영진2․최민주2․박영준3․남상호2*
ABSTRACT
Altitude is a factor that plays an important role in the diversity, richness and composition of species. Recently, much attention has been paid to the distribution of butterflies and insects according to altitude. The purpose of this article is to propose a method to preserve and manage species efficiently by reviewing the distribution of butterflies according to different altitudes in Mt. Gyeryong National Park. This study found that the number of species and individuals decreased as the altitude increased, possibly due to the increased amount of shade caused by the crown density. When analyzing the factors influencing the distribution of species other than altitude, it was found that the slope, vegetative colonies and hydrosphere distance were correlated with the change in species distribution. As these species are closely related to food plants, it may save time and reduce the cost as well as allow an efficient evaluation of the bio-diversity if these species are selected as biological indicator species suitable for detecting the changes in the forest. It is judged to be a more efficient means of species preservation to accumulate and quantify the materials regarding environmental elements such as the climate, microclimate and food plants, as this would allow the butterfly distribution to be estimated.
KEY WORDS: LEPIDOPTERA, DISTRIBUTION, ALTITUDE, INDICATOR SPECIES
요 약
고도의 변화는 종 다양성 및 풍부도 그리고 생물 종 구성에 있어 매우 중요한 역할을 하는 요인으로 최근에는 나비를 비롯하여 곤충의 고도에 따른 분포 형태에 관하여 많은 관심이 집중되고 있다. 본 논문에서는 계룡산국립공원의 고도에 따른 나비분포를 조사하여, 종 보전 및 효율적인 관리방안을 제시하고자 하였다. 본 연구에서는 고도가 증가함에 따라 종과 개체수가 감소하는 경향이 나타났으며, 이는 수관울폐로 인한 그늘의 증가가 원인일 것으로 사료된다.
고도의 영향 이외에도 종의 분포에 영향을 주는 요인을 분석한 결과, 경사도 및 식생군락 그리고 수계거리가 종의 분포 변화와 상관관계가 있는 것으로 조사되었다. 이러한 종들은 먹이식물과 밀접한 관련이 있으므로 추후에 숲 내부의 변화를 감지하는데 적합한 생물지표종을 선정한다면 시간과 비용을 감소시킬 수 있을 뿐만 아니라 효율적인 생물다양성 평가를 내릴 수 있을 것으로 판단된다. 또한 추후에 기후 및 미기후, 그리고 먹이식물과 같은 환경요인들의 자료를 축적하고 정량화 할 경우 나비 분포를 예측할 수 있어 종 보전에 있어 더 효율적이라고 사료된다.
주요어: 나비목, 분포, 고도, 지표종
INTRODUCTION
Insects are the largest animal group, accounting for approximately 50% of the bio-diversity in the world and playing an important role in ecological functions. Such characteristics mean that insects are a biological indicator species and that they are reflected in numerous taxonomic groups and various environmental plans for habitats (Holloway, 1980; Kremen et al., 1993). For example, many single species as well as their upper taxonomic groups have been studied, including communities of dragonflies, beetles, tiger beetles, moths, butterflies, and sawflies, as well as ants living in forests, grass fields, sand dunes, open land, city areas and mining areas. However, studies of bioindicators using many different species of terrestrial insects have not received much attention.
Among them, many studies regarding butterflies as biological indicator species have been conducted using statistical methods to review the correlations with various factors related to what are known as indicator species (Erhardt, 1985; Erhardt and Thomas, 1991). Recently, the distribution of butterflies and insects according to altitude has received much attention(Sanchez-Rodriguez and Baz, 1995), as altitude can provide important information such as the types of environmental factors limiting the distribution of living things for species diversity; and the richness, composition, and aspects of bio-geographical shapes.
Lepidoptera, consisting of approximately 180,000 species around the world, is the second-largest group in Insecta, but butterflies occupy only about 11%(Schappert, 2005). The distribution of butterflies throughout the Korean Peninsula was reported account to 280 species under 5 families in total(Paek and Shin, 2010). Among them, butterflies inhabiting in Mt. Gyeryong were reported by Kim(1976) for the first time, after which 56 species and 5 families were reported by Yoon and Nam(1980).
Additions were made later, bringing the total to 72 species and 5 families(Kim et al., 1993). Factors determining habitats that are suitable for butterflies include the vegetation type, humidity, and the amounts of sunshine and water. Additionally, the shape of each habitat is closely related to these factors(Joshi and Arya, 2007).
Gilbert and Singer(1975) and Shapiro(1975) reported that interactions between food plants and climate could
represent most distributions of Lepidoptera. In fact, this was verified as a useful model to use to determine the influence of graminivorous insects and food plants on the interaction between the species distribution as well as the influence of climate on living things(Hodkinson, 1999).
Additionally, it was verified that climate can limit the distribution by directly influencing the reproduction or the outcomes of species interactions. This is true for plant resources, natural enemies and competitors(Gaston, 2003).
As such, it was found that butterflies were the species most appropriate for evaluating and monitoring bio-diversity, as they are well known as an indicator species for environmental changes(Kremen, 1992; 1994). Mt. Gyeryong is located between Charyeong and Noryeong mountain range and borders the southern and northern areas of Korean Peninsula(Ko and Kang, 2005). Diverse plants from the northern boundary line of southern temperate zone and southern boundary line of northern temperate zone inhabit Mt. Gyeryong area(Yang et al., 2004; Oh and Beon, 2009).
Besides, various northern and southern type of butterflies congregate at Mt. Gyeryong(Yoon and Nam, 1980). As described above, it is obvious that Mt. Gyeryong National Park is a bio-geographically important area.
The purpose of this study is to investigate if there is difference in the composition of butterfly species according to altitude and to propose an efficient method to preserve and maintain butterflies in Mt. Gyeryong National Park by selecting specific indicator species through a statistical analysis according to survey place and altitude.
MATERIALS AND METHODS
1. Investigation spots
Mt. Gyeryong is located at N 36°18´02˝~36°23´38˝ and E 127°11´60˝~127°17´86˝, bordering three cities in one province, specifically Gongju, Nonsan and Daejeon City in Chungcheongnam Province. The spots were Donghaksa, Sangsin-ri, Gapsa and Sinwonsa in Mt. Gyeryong National Park(Figure 1).
2. Investigation methods 1) Collection
Site Date Weather
Donghaksa
Mar. 27 Sunny
Apr. 6 Sunny
May. 24 Partly cloudy
Jun. 14 Sunny
Jul. 18 Partly cloudy Aug. 24 Cloudy Sept. 26 Sunny
Oct. 17 Sunny
Sangsin-ri
Mar. 29 Partly cloudy
Apr. 12 Sunny
May. 17 Sunny
Jun. 30 Cloudy Jul. 26 Cloudy Aug. 29 Cloudy Sept. 30 Sunny Oct. 12 Cloudy
Gapsa
Mar. 28 Cloudy Apr. 25 Cloudy May. 31 Cloudy
Jun. 15 Sunny
Jul. 19 Cloudy
Aug. 25 Sunny
Sept. 28 Partly cloudy
Oct. 19 Sunny
Sinwonsa
Mar. 30 Sunny
Apr. 29 Partly cloudy May. 30 Partly cloudy
Jun. 21 Sunny
Jul. 20 Sunny
Aug. 31 Cloudy Sept. 23 Sunny Oct. 20 Partly cloudy Table 1. Investigation date and weather conditions at
the sites
Figure 1. Map of survey areas in Mt. Gyeryong National Park(N36°18´02˝~36°23´38˝, E 127°11´60˝~127°17´86˝) Donghaksa, Gapsa, Sinwonsa and Sangsin-ri areas in Mt. Gyeryong National Park were investigated once a month from March to October of 2011(Table 1). The collection was done by referring to the line transect method of Pollard(1977). A fixed path(trail) was divided into zones with intervals of approximately 100m using GPS. Individuals were collected while moving 5m left and right from the trail at a steady speed. After collecting them using an insect net, the species identified were released after identification, while unidentifiable species were identified in the lab. In addition, immersion specimens were made. Collections were done during 09:30~17:00 every day, counting butterflies from the beginning point to the peak(Sambulbong and Gwanumbong) at each investigation spot.
2) Analysis
(1) Diversity index
This was calculated using the Shannon-Weaver function (Pielou, 1966), which was influenced by the information theory of Margalef(1958). It shows the complexity of the colony, referring to the relative balance between the species diversity and the number of individuals in a colony.
H' = -∑ (ni/N) Ln (ni/N)
(H': Diversity index, ni: Number of individuals of ithspecies, N: Total number of individuals) (2) Richness index
This is an index which shows the status of the colony in terms of the total number of individuals and species.
A higher value denotes a rich species and a favorable environment. It is calculated using the formula below, with the frequently used coefficient of Margalef(1958).
RI = (S-1) ln(N)
(RI: Richness Index, S: Total Species, N: Total
Figure 2. The number of species and individuals of Mt. Gyeryong National Park Individuals)
(3) Dominance index
This index stems from the perspective that a specific species can be dominant according to environmental changes and thus can be used as a clear indicator. It can be a means of measuring differences between spots by selecting two dominant species. It is calculated according to McNaughton’s dominance index(DI)(McNaughton and Wolf, 1970). If a colony has a single dominant species, the DI of the colony is 1. More species will make the DI closer to 0.
D′ = ∑ (Pi)²
(Pi: calculated as the portion of the ithindividuals (ni/N))
(4) Evenness index
This is expressed as the proportion of the actual value to the possible maximum value of each index. The diversity index can reach its maximum value when the species in the colony all contain the same number of individuals. The evenness index shows the evenness of the species composition in the colony. It is calculated using the formula of Pielou(1975), as shown below.
EI = H′
ln (S)
(EI: Evenness index, S: Total Species, H': Diversity index)
(5) Statistical Analysis
To identify the difference in the species composition of the butterflies in Mt. Gyeryong National Park according to the altitude and to select indicator species, a correlation analysis was conducted on the number of butterfly species and individuals using SPSS 12.0K. For a frequency analysis and distribution estimation diagram, ArcGIS ver.
9.3 was used. Additionally, to analyze the similarity according to the altitude, PRIMER ver.6 was used.
RESULTS AND DISCUSSION
1. Butterfly species composition in Mt. Gyeryong National Park
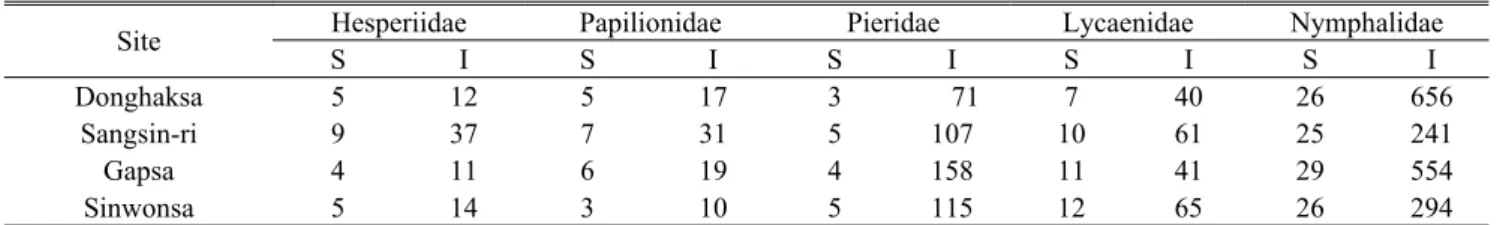
At the Donghaksa, Gapsa, Sangsin-ri, and Sinwonsa locations in Mt. Gyeryong National Park, 2,554 individuals and 80 species were identified. Among them, 74 individuals and 11 species in Hesperiidae, 74 individuals 8 species in Papilionidae, 451 individuals and 5 species in Pieridae, 207 individuals and 16 species in Lycaenidae, and 1,744 individuals and 40 species in Nymphalidae were identified.
Overall, species and individuals of Nymphalidae accounted for more than 50%, whereas Hesperiidae, Papilionidae, Pieridae and Lycaenidae were found to account for less than 20%(Figure 2). In earlier research, there were 72 species of butterflies recorded in Mt. Gyeryong National Park(Kim et al., 1993). Regarding other areas, Kim and Lee(1993) reported 68 species and 5 families in study on
Site Hesperiidae Papilionidae Pieridae Lycaenidae Nymphalidae
S I S I S I S I S I
Donghaksa 5 12 5 17 3 71 7 40 26 656
Sangsin-ri 9 37 7 31 5 107 10 61 25 241
Gapsa 4 11 6 19 4 158 11 41 29 554
Sinwonsa 5 14 3 10 5 115 12 65 26 294
*S: No. of species, I: No. of Individuals
Table 2. The number of butterfly species and individuals at the sites
Figure 3. The number of species and individuals at all sites by altitude
Mt. Chilgap in Chungcheongnam province from 1991 and 1992, and 32 species and 5 families of butterflies were reported in Mt. Sorak National Park in 1994(Kwon and Byun, 1999). These studies reported relatively low numbers of species most likely due to the lower number of surveys used, such as six times in total once a month from April to September. According to Kery and Plattner(2007), there may have been times in which the researchers could not find individuals from any of the butterfly species during a visit. Such a possibility may be a reason for the differences in the number of species identified. Regarding the composition of the butterfly species by region(Table 2), at the Donghaksa location, individuals of Nymphalidae and Pieridae were greater in number compared to any other families, possibly because Libythea celtis of Nymphalidae and Artogeia melete of Pieridae were the dominant species.
In Sangsin-ri, 477 individuals and 56 species were identified. Although the total number of individuals was smaller than that of the other areas, there were more species. In particular, more individuals in Hesperiidae and Papilionidae were identified. The most likely explanation is the open fields and rice fields in their area, with an abundance of nectar plants. At Gapsa, 783 individuals and 54 species were identified. More individuals in Nymphalidae were identified than in other areas. It appears that this area has a diverse range of species owing to its abundant nectar plants in green fields, such as those in Sangsin-ri. At Sinwonsa, 498 individuals and 51 species were identified.
More species and individuals in Lycaenidae were identified in this area, mainly because of the wide green field near Sinwonsa.
2. Distribution of butterflies in Mt. Gyeryong National Park by region according to altitude
In this research, butterflies investigated in four investigation
spots were classified according to the altitude. As shown in Figure 3, in all four spots, more species and more individuals were identified at lower altitudes, though these numbers dwindled in mid-altitude areas. This may be a result of the increase in the amount of shade in the trail area of Mt. Gyeryong National Park owing to the tree canopy as the slope becomes steeper. When shade increases as a result of the crown density, herby ground vegetation disappears. This phenomenon reduces the sunlight in the forest and influences the amount of and the quality of nectar plants for adult insects and feeding grasses for larva.
It influences individual butterflies and increases the degree of local extinction of specific butterflies due to the reduction of the number of suitable habitats(Sparks et al., 1996). This results in a reduction in the number of both species and individuals. However, there can be some open spaces where the heights of the trees are shorter, especially closer to the peak. In such areas, the spaces become more open and the number of species and individuals tends to
Figure 4. The number of species and individuals at each site by altitude increase. As plants are exposed to higher temperatures and
more sunshine, transpiration will increase, causing the moisture content of the soil to decrease(Kapos, 1989).
Thus, plants may die or growth may be disturbed. This reduces the density of the leaves, increases the light arriving at the bottom part of the forest and the diversity and consequently increases the density of the understory vegetation(Faria et al., 2009) and the richness of young plants, shrubs and herbs(Harper et al., 2005). With an increase in the diversity and richness of the vegetation, butterflies can find shelter and sunlight to control their body temperature while they use nectar plants(Sparks et al., 1996). This increases both the number of species and individuals, which explains why more species and individuls were identified in high altitude areas than in mid-altitude areas.
1) Donghaksa
Here, 317 individuals and 30 species were found at an altitude of 100m~200m, 305 individuals and 21 species at an altitude of 200m~300m, 58 individuals and 8 species at an altitude of 300m~400m, 58 individuals and 18 species at an altitude of 400m~500m, 8 individuals and 1 species at an altitude of 500m~600m, 15 individuals and 3 species at an altitude of 600m~700m, and 35 individuals and 15 species at an altitude of 700m~775m. According to Kwon and Park(1997), human disturbance is the major factor determining the species composition and distribution.
It was assumed that fewer species were found in the lower part of the Donghaksa area, as it has more visitors than other areas. As the altitude increases, it was noted that the number of species increases in some zones. This occurs because the space becomes open or may have plenty of sunshine due to the shorter vegetation near the peak.
Additionally, the slope was steeper than it was in the other areas(Figure 4).
Figure 5. The monthly number of species and individuals at all sites
2) Sangsin-ri
At this location, 247 individuals and 36 species were found at an altitude of 100m~200m, 88 individuals and 21 species at an altitude of 200m~300m, 43 individuals and 7 species at an altitude of 300m~400m, 23 individuals and 8 species at an altitude of 400m~500m, 23 individuals and 10 species at an altitude of 500m~600m, 25 individuals and 9 species at an altitude of 600m~700m, and 28 individuals and 15 species at an altitude of 700m~775m. At lower altitudes, fields, rice fields, various types of vegetation, and nectar plants were investigated.
At mid-range altitudes, many open spaces were investigated, although they had increased shade due to the crowns of trees. This is may explain why more species were identified in this area. On the other hand, fewer species were identified at Nammaetap at a high altitude due to the many visitors, although it had open space. Overall, this area showed a low slope compared to other areas(Figure 4).
3) Gapsa
Here, 400 individuals and 35 species were found at an altitude of 100m~200m, 153 individuals and 15 species at an altitude of 200m~300m, 161 individuals and 20 species at an altitude of 300m~400m, 19 individuals and 8 species at an altitude of 400m~500m, 17 individuals and 8 species at an altitude of 500m~600m, 17 individuals and 12 species at an altitude of 600m~700m, and 16 individuals and 10 species at an altitude of 700m~775m. This area has many open slopes and various nectar plants at low altitudes. Near Sinheungam at middle altitudes, there is a wide open slope and public toilets. Many species were identified near the toilets, possibly because it is easy for butterflies to find water and nutrients there. At Geumjandi hill at a high altitude, the number of species tends to increase. This may be a result of the abundance of nectar plants at the wide open space there, which allows butterflies to prosper in terms of both species and individuals. According to Ki and Choi(2004), high altitude areas are where they take a rest, being blown by the wind(Figure 4).
4) Sinwonsa
They were 215 individuals and 33 species found at an altitude of 100m~200m, 78 individuals and 13 species at
an altitude of 200m~300m, 55 individuals and 11 species at an altitude of 300m~400m, 30 individuals and 9 species at an altitude of 400m~500m, 37 individuals and 7 species at an altitude of 500m~600m, 31 individuals and 6 species at an altitude of 600m~700m, and 52 individuals and 16 species at altitude of 700m~775m. There were many species in the Lycaenidae, Pieridae and Nymphalidae families in the green field in the Sinwonsa area, which is at a low altitude. This phenomenon arises owing to the edge effect, in which butterflies inhabiting a green field and a forest coexist, according to Ki and Choi(2004). This area had fewer open slopes than other areas; accordingly, many of Lethe Diana and Mycalesis francisca were identified which inhabit in shaded areas. According to Sparks et al.(1996), there are species that specially prefer shaded areas(Figure 4).
3. Monthly distribution of butterflies in Mt. Gyeryong National Park
Gutierrez and Menendez(1998) reported that a seasonal survey could provide an understanding of the interactions with food plants and the evolution of life history. In other words, this can allow us to understand which environmental factors would influence the emergence of a species in a specific month more than other factors. In this article, the number of species and individuals showed a significant difference according to the month(Figure 5).
1) Donghaksa
In a monthly survey, the fewest species and individuals
Figure 6. The monthly number of species and individuals at each site were identified in March. Only Libythea celtis and
Polygonia c-aureum had emerged from hibernation. The largest number of species and individuals was noted in June, and there were fewer species and individuals in July and August compared to June. It seems that the heavy rainfall during the year of the survey limited the emergence of many species. Additionally, there may be differences in the fruit trees and flowering plants in the areas according to the season(Young, 1982; Wolda, 1987; 1988).
In May and June, Choaspes benjaminii was identified, which is designated as a climate change biological indicator species by the National Institute of Biological Resources (Figure 6).
2) Sangsin-ri
The highest number of species of butterflies was identified in June. This month had more species than other areas because it had fewer artificial disturbances.
Additionally, Mimathyma schrenckii and Sasakia
charonda, inhabiting valley or coppice forest areas, were identified(Kim, 2002). They may have tried to find shelter there from heavy rain. In July, Lycaena dispar was reported to inhabit tropically higher areas than N 37°(Kim, 2002). This species was seen colleting honey from the daisy fleabane plant(Erigeron annuus). More individuals of Sericinus montela and Anthocharis scolymus were identified in this area compared to other areas. According to Owen et al.(1972), the distribution is determined by the preference of larva on feeding plants(Figure 6).
3) Gapsa
Although the most species were identified in May, the number of individuals identified was small. This may be an effect of the cloudy weather on the density of the population, as in the report by Luis and Llorente(1990).
Fixsenia pruni, which used to tropically inhabit in middle and northern part of Korea and which was observed and reported in some areas of Chungcheongbuk province, was
Site H' EI RI
Donghaksa 1.56 0.41 6.74
Sangsin-ri 3.04 0.76 8.92
Gapsa 2.10 0.53 7.95
Sinwonsa 2.65 0.67 8.05
*H': Diversity index, EI: Evenness index, RI: Richness index Table 3. Community analysis at the sites
Site DS DI SDS SDI
Donghaksa
Libythea celtis
0.67 Artogeia melete 0.08
Sangsin-ri 0.19 Polygonia c-aureum 0.16
Gapsa 0.52 Artogeia melete 0.15
Sinwonsa 0.32 Artogeia melete 0.17
*DS: Dominant species, DI: Dominance index, SDS: Sub-dominant species, SDI: Sub-dominance index Table 4. Dominant species and sub-dominant species at the sites
identified(Paek and Shin, 2010). According to Shapiro(1975), the change in the day length influences the emergence of butterfly species. Thus, there were fewer species and individuals identified in March, September and October because of the day length. Although it had artificial disturbances such as the presence of a commercial area and parking lots, like Donghaksa, Gapsa showed more species and individuals, as this area has more green fields which are wide and open compared to the other areas(Figure 6).
4) Sinwonsa
At Sinwonsa, species and individuals were distributed more evenly than in any other area. In May, Taraka Hamada, a carnivorous species inhabiting Sasa coreana and Sasa borealis(Kim, 2002), was identified. Antigius attilia, tropically inhabiting lower hills excluding the southeast area of Gyeongsangnam province(Paek and Shin, 2010), was identified in June. Additionally, in June and July, Dichorragia nesimachus, designated as a climate change biological indicator species by the National Institute of Biological Resources of the Ministry of the Environment, was identified. Thus, Sinwonsa had more species and individuals of Lycaenidae due to the abundant nectar plants in wide open green fields in this area. This is consistent with the report of Pozo et al.(2008), which holds that this type of flight of adult butterflies serves to perform various, active activities, such as reproduction and egg-laying on nectar plants. It is likely that it makes a difference as regards species diversity and the richness of butterflies by season(Figure 6).
4. Butterfly colony analysis by region and altitude 1) Region
The area showing the highest diversity index was Sangsin-ri, at 3.04, while the area showing the lowest
diversity was Donghaksa, at 1.56. The area showing the highest evenness index was Sangsin-ri, at 0.76, and the lowest area was Donghaksa, at 1.56. The area showing the highest species richness index was Sangsin-ri, at 8.92, while the lowest area was Donghaksa, at 6.74. It was previously reported that a lower richness index and lower evenness index would the lower diversity index(Vu, 2008).
When reviewing the dominance index, it was found that Libythea celtis was commonly a dominant species in all of the investigation spots. The sub-dominant species were identified as Artogeia melete and Polygonia c-aureum.
While Kim and Lee(1993) reported that Artogeia melete was the dominant species, the dominant species observed in Mt. Gyeryong National Park was Libythea celtis.
Artogeia melete was the sub-dominant species(Tables 3 and 4).
2) Altitude
Species diversity was the highest at 700m~755m, at 2.94. It was the lowest at 300m~400m, at 1.55. Evenness was the highest at 700m~775m, at 0.84, while it was the lowest at 100m~200m, at 0.61. Richness was the highest at 100m-200m, at 8.91, and the lowest at 500m-600m, at 3.60. As reported by Sanchez-Rodriguez and Baz(1995), species richness tends to decrease as the altitude increases.
The overall dominant species according to altitude was found to be Libythea celtis and Artogeia melete. The sub-dominant species were Artogeia melete at 100m~300m, Lethe Diana at 300m~400m, Artogeia melete at 400m~500m,
Attitude DS DI SDS SDI
100m~200m Libythea celtis 0.37 Artogeia melete 0.12
200m~300m Libythea celtis 0.67 Artogeia melete 0.09
300m~400m Libythea celtis 0.69 Lethe diana 0.07
400m~500m Libythea celtis 0.44 Artogeia melete 0.19
500m~600m Artogeia melete 0.41 Libythea celtis 0.28
600m~700m Artogeia melete 0.29 Libythea celtis 0.23
700m~775m Libythea celtis 0.16 Mycalesis francisca 0.13
*DS: Dominant species, DI: Dominance index, SDS: Sub-dominant species, SDI: Sub-dominance index Table 6. Dominant species and sub-dominant species by altitude
Attitude H' EI RI
100m~200m 2.55 0.61 8.91
200m~300m 1.55 0.42 6.21
300m~400m 1.49 0.43 5.38
400m~500m 2.11 0.67 4.52
500m~600m 1.84 0.65 3.60
600m~700m 2.27 0.75 4.35
700m~775m 2.94 0.84 6.68
*H': Diversity index, EI: Evenness index, RI: Richness index Table 5. Butterfly community analysis by altitude
Month H' EI RI
March 0.65 0.94 0.21
April 1.32 0.47 2.76
May 2.89 0.82 6.19
June 1.80 0.46 7.17
July 2.39 0.67 6.21
August 2.83 0.80 6.08
September 1.45 0.49 3.15
October 2.20 0.83 2.98
*H': Diversity index, EI: Evenness index, RI: Richness index Table 7. Monthly community analysis
Month DS DI SDS SDI
March Libythea celtis 0.65 Polygonia c-aureum 0.34
April Libythea celtis 0.68 Polygonia c-aureum 0.08
May Artogeia rapae 0.16 Mycalesis francisca 0.13
June Artogeia melete 0.59 Colias erate 0.16
July Artogeia melete 0.37 Libythea celtis 0.22
August Libythea celtis 0.17 Lethe diana 0.15
September Libythea celtis 0.54 Polygonia c-aureum 0.23
October Polygonia c-aureum 0.27 Pseudozizieeria maha 0.23
*DS: Dominant species, DI: Dominance index, SDS: Sub-dominant species, SDI: Sub-dominance index Table 8. Monthly dominant species and sub-dominant species
Libythea celtis at 500m~700m, and Mycalesis francisca at 700m~summit(Tables 5 and 6).
3) Month
Species diversity was the highest in May, at 2.89, and the lowest in March, at 0.65, as butterflies emerging out of hibernation as adults in March were limited to Libythea celtis and Polygonia c-aureum. Evenness was the highest in March, at 0.94, and the lowest in April, at 0.47.
Richness was the highest in June, at 7.17, and the lowest in March, at 0.21. In March and April, Libythea celtis was
the dominant species, at 0.65, while Polygonia c-aureum was the sub-dominant species, at 0.34. In May and June, Artogeia rapae and Artogeia melete were the dominant species, at 0.16 and 0.59, respectively, while the sub-dominant species were Mycalesis francisca at 0.13 and Colias erate at, 0.13 respectively. In July and August, dominant species were Artogeia melete at 0.37 and Libythea celtis at 0.17, while the sub-dominant species were Libythea celtis at 0.22 and Lethe Diana at 0.15, respectively. In September, Libythea celtis was the dominant species, at 0.54, while
Figure 8. Correlation relationship between the total number of species and individuals by altitude Figure 7. Similarity analysis of all sites by altitude
the sub-dominant species was Polygonia c-aureum, at 0.23. In October, Polygonia c-aureum was the dominant species, at 0.27, while the sub-dominant species was Pseudozizeeria maha, at 0.23(Table 7, Table 8).
5. Analysis of factors influencing butterfly colonies in Mt. Gyeryong National Park
1) Analysis of similarity according to altitude Using the number of species and individuals in Mt.
Gyeryong National Park according to the altitude, a similarity analysis was performed. The range showing the highest degree of similarity was 400m-500m, at 65.53%,
while that showing the lowest degree of similarity was 100m-700m, at 29.46%. If classifying the type of habitats considering the similarity with a standard of 50%, three groups emerge: the low-altitude group(100m, 200m and 300m), the mid-altitude group(400m, 500m and 600m), and the high-altitude group(700m)(Figure 7). In other words, each type has similar habitats. This may allow us to estimate the species with limited environmental factors and at restricted altitudes more efficiently.
2) Correlation analysis of the total number of species and individuals by altitude
Sanchez-Rodriguez and Baz(1995) reported that there was a highly negative correlation between the altitude and the number of species and individuals. This article also found a highly negative correlation in the distribution of butterflies in Mt. Gyeryong National Park. Although the number of species decreased(r=-0.705, and p=0.077), it exceeded the p>0.05 level. On the other hand, the number of individuals showed a high correlation under the p<0.05 level given that r=-0.842, and p=0.018. Thus, although there was a high correlation between the number of species and individuals and altitude, the number of individuals was found to be more closely related to altitude than the number of species. This may be a result of the irregular distribution owing to the wide open slope near the mid-altitude area(Figure 8).
3) Correlation analysis of species with altitude When performing a correlation analysis on the species identified in Mt. Gyeryong National Park according to altitude, it was found that Polygonia c-aureum had the highest correlation, at r=-0.926 and p=0.003, while Atrophaneura alcinous also had a high correlation, at r=-0.784 and p=0.037. Not all species showed a tendency to decrease in number relative to altitude; some species were limited to a specific altitude, some species contained individuals which were not fully identified, and others showed an uneven distribution. On the other hand, the species with large individual populations and an even distribution at all altitudes showed a tendency to decrease with an increase in the altitude. Artogeia melete, whose individual population was second-largest after Libythea celtis, tended to decrease(r= -709 and p=0.075), although the p>0.05 level was exceeded. Accordingly, it can be forecasted that most of the species influenced by altitude are restricted by some environmental factors(Table 9).
Species R P*
Parnassius stubbendorfii -0.800 0.031
Papilio macilentus -0.802 0.030
Atrophaneura alcinous -0.784 0.037
Libythea celtis -0.926 0.003
Hestina assimilis -0.883 0.008
Sephisa princeps -0.791 0.034
Neptis sappho -0.860 0.013
Neptis philyroides -0.762 0.046
Neptis alwina -0.784 0.037
*P>0.05
Table 9. Correlation analysis of species by altitude
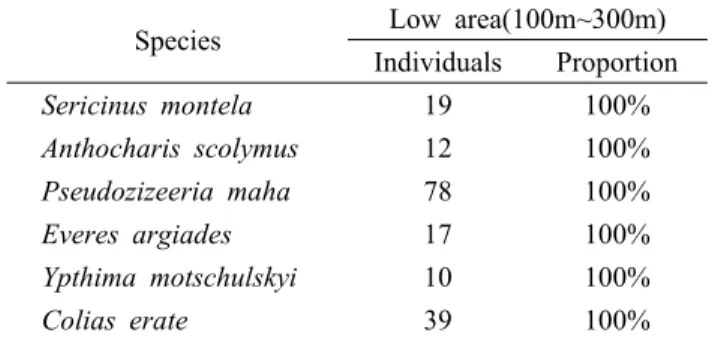
6. Indicator species
Kitahara et al.(2000) and Hogsden and Hutchinson (2004) reported that generalists are distributed widely and repeatedly and that specialists are distributed in a limited manner. For example, according to Fox et al.(2006), the distribution of specialists was widely extended to the north due to changes in the climate. In addition, Kim et al.(2007) and Kim(2000) reported species that were limited to a specific altitude, also finding some species limited to low and middle altitudes. Typically, species limited to a specific altitude are closely related to food plants(Merrill
et al., 2008; Kim, 2000). If those species can be found at other altitudes, they can be used as indicator species for estimating the changes in the distribution due to environmental changes such as climate and habitat change(Table 10).
Species Low area(100m~300m) Individuals Proportion
Sericinus montela 19 100%
Anthocharis scolymus 12 100%
Pseudozizeeria maha 78 100%
Everes argiades 17 100%
Ypthima motschulskyi 10 100%
Colias erate 39 100%
Table 10. Appearance species at limited altitude
Species High area(700m~775m) Individuals Proportion
Kirinia epaminondas 3 100%
Polytremis pellucida 2 100%
Melanargia epimede 5 100%
(Table 10. Continued)
7. Efficient management and preservation of butterflies in Mt. Gyeryong National Park
Humpden and Nathan(2010) reported that the species diversity and richness of butterflies can be used to monitor disturbances in forested areas. Accordingly, we can learn about changes in ecology with a long-term standardized and quantitative survey. As this article chose altitude only as an environmental factor, it did not discuss the distribution of butterflies. However, if we accumulate and quantify more information about environmental factors such as the climate, microclimate and food plants, species preservation efforts can be more efficient as the range of the estimated butterfly distribution becomes wider. At low-altitude areas in the four investigation spots in this article, there were diverse species due to the plentiful nectar plants regardless of whether there were herbs or shrubs due to the wide and open slopes. Consequently, the management and the maintenance of nectar plants are needed. Additionally, several species limited to a specific altitude were identified
in this research. It is supposed that these species were closely related with food plants. If they are chosen as biological indicator species appropriate for detecting changes in forested regions, more efficient bio-diversity evaluations can be made.
LITERATURE CITED
Erhardt, A. and J. A. Thomas(1991) Lepidoptera as indicators of change in semi-natural grasslands of lowland and upland Europe. In The Conservation of Insects and their Habitats(ed.
N.M. Collins and J. A. Thomas), Academic Press, London, pp.
213-236.
Erhardt, A.(1985) Diurnal Lepidoptera: sensitive indicators of cul- tivated and abandoned grassland. J. Appl. Eco. 22(3): 849-862.
Faria, D., E. Mariano-Neto, A.M.Z. Martini, J.V. Ortiz, R. Montingeli, S. Rosso, M.L.B. Paciencia and J. Baumgarten(2009) Forest structure in a mosaic of rainforest sites: The effect of fragmen- tation and recovery after clear cut. For. Ecol. Manage. 257:
2,226-2,234.
Fox, R., J. Asher, T. Brereton, D. Roy and M. Warren(2006) The state of butterflies in Britain and Ireland. Pisces Publications, Newbury.
Gaston, K.J.(2003) The Structure and Dynamics of Geographical Ranges. Oxford University Press, U.S.A.
Gilbert, L.E. and M.C. Singer(1975) Butterfly ecology. Annu. Rev.
Ecol. Syst. 6: 365-397.
Gutierrez, D. and R. Menendez(1998) Phenology of butterflies along an altitudinal gradient in northern Spain. J. Zool. Land.
244: 249-264.
Harper, K.A., S.E. Macdonald, P. Burton, J. Chen, K.D. Brosofske, S.C Saunders, E.S. Euskirchen, D. Roberts, M. Jaiteh and P-A.
Esseen(2005) Edge influence on forest structure and composi- tion in fragmented landscapes. Conser. Biol. 19: 768-782.
Hodkinson, I.D.(1999) Species response to global environmental change or why ecophysiological models are important: A reply to Davis et al., J. Anim. Ecol. 68(6): 1,259-1,262.
Hogsden, K.L. and T.C. Hutchinson(2004) Butterfly assemblages along a human disturbance gradient in Ontario, Canada. Can. J.
Zool. 82: 739-748.
Holloway, J.D.(1980) Insect surveys an approach to environmental monitoring. Atti XII Congressuale Nazionale Italiana Entomologia. pp. 239-261.
Humpden, N.N. and G.N. Nathan(2010) Effect of plant structure on butterfly diversity in Mt. Marsabit Forest - northern Kenya. Afr.
J. Ecol. 48(2): 304-312.
Joshi, P.C. and M. Arya(2007) Butterfly Communities along altitu- dinal Gradients in a Protected Forest in the Western Himalayas,
India. Nat. Hist. J. Chula Univ. 7(1): 1-9.
Kapos, V.(1989). Effects of isolation on the water status of forest patches in the Brazilian Amazon. J. Trop. Ecol. 5: 173-185.
Kery, M. and M. Plattner(2007) Species richness estimation and de- terminants of species detectability in butterfly monitoring programmes. Ecol. Entomol. 32(1): 53-61.
Ki, G.J. and S.W. Choi(2004) Butterfly Population Dynamics at Mt.
Yudal, Mokpo, Korea. Kor. J. Environ. Biol. 22(1): 35-42. (in Korean with English abstract)
Kim, C.W.(1976) Distribution Atlas of Insects of Korea Series 1-Lepidoptera. Korean Entomological Institute, Seoul. (in Korean)
Kim, D.S., H.B. Yi., Y.J. Kwon and M.S. Woo(2007) The Butterfly Community Dynamics at Mt. Midong, Cheongwon-gun, ChungcheongBukdo, Korea. Kor. J. Environ. Biol. 25(4):
319-325. (in Korean with English abstract)
Kim, J.S., H.Y. Oh, Y.H. Byen, J.G. Sim, H.J. Woo, I.S. Kim, N.G.
Paek, J.I. Kim, W.P. Ahn, D.H. Cho, W.M. Kim(1993) National Park Natural Resource Research. Ministry of Public Administration and Security, Korea.
Kim, O.S. and Y. Lee(1993) Studies on the Butterflies in the Mt.
Chilkap Chung-nam Korea Department of Biology Education.
Report of Science Education 24: 1-8. (in Korean with English abstract)
Kim, S.H.(2000) Study on the monthly Distribution of Suborder Rhopalocera by Altitude in Cheju Island. Graduate School of Education, Cheju National University, Cheju, Korea. (in Korean)
Kim, Y.S.(2002) Illustrated Book of Korean Butterflies in Color.
Kyohak Publishing, Korea. (in Korean)
Kitahara, M., K. Sei and K. Fujii(2000) Patterns in the structure of grassland butterfly communities along a gradient of human dis- turbance: further analysis based on the generalist/specialist concept. Popul. Ecol. 42: 135-144.
Ko, S.C. and S.H. Kang (2005) Flora of Dongwol Valley in Mt.
Gyeryongsan, National Park. Korean J. Plant Res. 18(2):
223-239. (in Korean with English abstract)
Kremen, C.(1992) Assessing the indicator properties of species as- semblages for natural areas monitoring. Ecol. Appl. 2: 203-217.
Kremen, C.(1994) Biological inventory using target taxa: a case study of the butterflies of Madagascar. Ecol. Appl. 4: 407-422.
Kremen, C., R.K. Colwell, T.L. Erwin, D.D. Murphy, R.F. Noss and M.A. Sanjayan(1993) Terrestrial arthropod assemblages: their use in conservation planning. Conser. Biol. 7: 796-808.
Kwon, T.S. and B.K. Byun(1999) Diversity and Abundance of Butterflies in the Packdam valley of Mt. Sorak, Kangwon Province. FRI. J. For. Sci. 60: 96-116. (in Korean with English abstract)
Kwon, T.S. and H.C. Park(1997) Assessment on Diversity and Abundance of Butterflies in the Chunbul-dong valley of the Soraksan by Line Transect Method. Kor. J. Environ. Ecol.
10(2): 171-183. (in Korean with English abstract)
Luis, A. and J. Llorente(1990) Mariposas en el Valle de Mexico:
Introduccion e Historia 1. Disribucion local y estacional de los Papilionoidea la Canada de los Dinamos, Magdalena Contreras, D.F. Mexico. Folia Entomol. Mex. 78: 95-198.
Margalef, R.(1958) Information theory in ecology. 3: 36-71.
McNaughton S.J. and L.L. Wolf(1970) Dominance and the niche in ecological systems. Science 167: 131-139.
Merrill, R.M., D. Gutierrez, J. Gutierrez, S.B. Diez and R.J.
Wilson(2008) Combined effects of climate and biotic inter- actions on the elevational range of a phytophagous insect. J.
Anim. Ecol. 77: 145-155.
Oh, H.K. and M.S. Beon(2009) Vascular Plants in the Gyeryongsan National Park. Kor. J. of Environ. Sciences 18(6): 633-644. (in Korean with English abstract)
Owen, D.F., J. Owen and D.O. Chanter(1972) Seasonal changes in relative abundance and estimates of species diversity in a fam- ily of tropical butterflies. Oikos. 23: 200-205.
Paek, M.K. and Y.H. Shin(2010) Butterflies of the Korean Peninsula. Nature and ecology, Seoul, Korea. (in Korean) Pielou, E.C.(1966) The measurement of diversity in different types
of biological succession. J. Theor. Biol. 13: 134-144.
Pielou, E.C.(1975) Ecological diversity. Wiley, New York. 165pp.
Pollard, E.(1977) A method for assessing changes in the abundance of butterflies. Biol. Conser. 12: 115-134.
Pozo, C., A.L. Martinez, G.L. Bousquets, N.S. Suarez, A.M.
Martinez, I.V Fernandez and A.D. Warren(2008) Seasonality and phenology of the butterflies (Lepidoptera: Papilionoidea
and Hesperioidea) of Mexoco’S Calakmul Region. Flor.
Entomol. 91(3): 70-399.
Sanchez-Rodriguez, J.F. and A. Baz(1995) The effects of elevation on the butterfly communities of a mediterranean mountain, si- erra de javalambre, central spain. J. Lepid. Soc. 49(3): 192-207.
Schappert, P.(2005) A world for butterflies: their lives, behavior and future. Firefly books, U.S.A, pp. 20-21.
Shapiro, A.M.(1975) The temporal component of butterflies spe- cies diversity, (In M. L. Cody AND J. M. Diamond [eds.]), Ecology and Evolution of Communities. The Belknap Press of Harvard, U.S.A, pp. 181-195.
Sparks, T.H., G.J.N. Davies, J.O. Mountford, M.L. Hall and R.H.
Marrs(1996) The effects of shade on the plant communities of rides in plantation woodland and implications for butterfly conservation. For. Ecol. Manage. 80: 197-207.
Vu, L.V.(2008) Diversity and similarity of butterfly communities in five different habitat types at Tam Dao National Park, Vietnam.
J. Zool. 277: 15-12.
Wolda, H.(1987) Altitude, habitat and tropical insect diversity.
Biol. J. Linn. Soc. 30(4): 313-323.
Wolda, H.(1988) Insect seasonality: Why?. Annu. Rev. Ecol. Syst.
19: 1-18.
Yang, K.C., M.H. Yeon and M.K. Han(2004) Natural Resources Survey of Mt. Gyeryong National Park. Knps. pp. 137-167. (in Korean)
Yoon, I.B. and S.H. Nam(1980) Insect fauna of Mt. Chilgab and Mt.
Gyeryong area. The Report of the KACN. 17: 129-158. (in Korean)
Young, A.M.(1982) Errata: over-exploitation of larval host plants by Heliconius butterflies. J.N.Y. Entomol. Soc. 90: 117-118.