ISSN 1225-0988 | EISSN 2234-6457 <Original Research Paper>
Augmented Weighted Tchebycheff Modeling and Robust Design Optimization on a Drug Development Process
Le Tuan Ho․Sangmun Shin†
Department of Industrial and Management Systems Engineering, Dong-A University, Busan 604-714, Republic of Korea
의약품개발공정에서의 Augmented weighted Tchebycheff 모델링 및 강건설계최적화
Le Tuan Ho․신상문 동아대학교 산업경영공학과
The quality of the products/processes has been improved remarkably since robust design (RD) methodology is applied into the practice manufacturing processes. A model building method based on the dual responses methods for multiple and time oriented responses on a drug development process is employed in this paper instead of the previous methods that handle the static nature of data and single response. Subsequently, the optimal solutions of a multiple and time series RD problem are obtained by using the proposed augmented weighted Tchebycheff method that has a significant flexibility on assigning weights. Finally, a pharmaceutical case study associated with a generic drug development process is conducted in order to illustrate the efficient optimal solutions from the proposed model.
*
Keywords: Robust Design, Augmented Weighted Tchebycheff Method, Drug Development Process, Optimization
1. Introduction
The robust design (RD) concept introduced by Taguchi pro- vided significant contributions to many industrial situations for more than twenty years. The procedure of RD consists of three stages : design of experiment, model parameter estima- tion, and optimization to obtain the optimal factor settings.
Although, Taguchi’s philosophy demonstrated a useful guide- line to solve complex RD problems based on experimental design and two step model, his approachen countered many technical problems in the assumptions, such that experiment design and statistical analysis which were criticized by Leon
et al. (1987), Box (1988), Nair (1992), and Tsui (1992). There- fore, scientists and researchers have being searched for an alternative approach in order to overcome these problems.
The most important turning-point of a new research trend is that Vining and Myers (1990) proposed a dual response (DR) model based on response surface methodology (RSM), in which a functional approach was utilized to estimate the mean and variance functions separately based on the information between input factors and output responses from the design of experiment. This dual-response approach were extended by Del Castillo and Montgomery (1993), Copeland and Nelson (1996), Kim and Lin (1998), Tang and Xu (2002), and Shin and Cho (2005). In the dual response optimization model, the
This research was supported by Basic Science Research Program through the National Research Foundation of Korea (NRF) funded by the Ministry of Education, Science and Technology (20120463).
†Corresponding Author:Professor Sangmun Shin, Department of Industrial and Management Systems Engineering, Dong-A University, Busan 604-714, Republic of Korea, Tel : +82-51-200-7688, Fax : +82-51-200-7697, E-mail : [email protected]
Received July 31, 2013; Revision Received August 30, 2013; Accepted September 16, 2013.
404 Le Tuan Ho․Sangmun Shin
process mean is kept at the desired value target value while the variance is minimized. In this optimization procedure, the process mean is prioritized and has lack of flexibility in RD modeling. For this reason, a new RD model based on mean squared error (MSE) concept was proposed by Lin and Tu, 1995. A number of extension of MSE model was proposed by using the weighted-sum approach, such as Cho et al. (1996), Koksoy and Doganaksoy (2003), Ding et al. (2004), and Robinson et al. (2006). In addition, Reddy (1998), Kim (2002), and Kovach and Cho (2008) proposed a number of multi- objective RD models.
The mission of the pharmaceutical industry is to provide the best drug products to ensure the human health. Therefore, the pharmaceutical scientists and technologists put tremendous focuses and efforts in the formulation of new effective compounds with the low price as much as possible. This is the key to be successful in fierce competitive environment nowadays. Probably, finding the optimal pharmaceutical for- mulation may be a significant challenge. The conventional experimental design format often deals with the static and single response. However, this is not suitable in real-world pharmaceutical situations associated with experimental design and formulation in which the output characteristics are mea- sured in a dynamic nature based on an observed time-domain of multiple responses. These multiple responses are simul- taneously optimized in the feasible set of solutions in pro- blems of multi-objective optimization. A set of accommo- dations between these conflicted responses is often created in multi-objective optimization problems by the consideration of the trade-off between objectives based on the preference information from a human decision maker’s opinions concer- ning to the multiple criteria. Shin et al. (2011), Choi et al.
(2012) and Nha et al. (2013) developed a two directions approach to model the multiple time-oriented responses as a function of control factors and time for pharmaceutical pro- blems. Truong et al. (2011) integrated the inverse problem to robust design modeling for the generic drug development. To the pharmaceutical formulation development associated with in-vitro in-vivo correlation, a weight assignment problem is an unresolved significant issue. The preference information between characteristics from the decision maker was not concerned in Shin et al. (2011), Choi et al. (2012) and Truong et al. (2011) while the priority between the gelation kinetics and drug release was mentioned in Nha et al. (2013).
Therefore, it is necessary to provide an alternative approach to solve the problem with the information from the decision maker by considering the tradeoff between gelation kinetics and drug release. Also, the Pareto optimal solutions are often considered in multiple responses optimization problems.
The weighted sum model is one of the simplest ways to perform that problem. The weight of each of responses can be chosen based on their relative importance in the problems.
This method is rather simple and easy to apply into the robust design multi-objective optimization. However, this model is less effective to the problems with the non-convex Pareto
optimal frontiers. The weighted sum model does not provide a necessary condition for Pareto optimality (Zionts, 1988).
Another difficulty with the weighted sum method is that varying the weights consistently and continuously may not necessarily result in an even distribution of Pareto optimal points and an accurate, complete representation of the Pareto optimal set (Marler and Arora, 2004). Another common de- composition approach, the weighted Tchebycheff norm, takes the replacement of a multi-objective optimization problem by a suitable scalar optimization problem. Unlike the weighted sum model, the weighted Tchebycheff can be utilized to achieve the Pareto optimal solution even if the non-convex Pareto frontier problems. In other words, every non- domi- nated point can be generated in the multiple-objective opti- mization problems by appropriately adjusting the weight value and/or the reference point (Dachert et al., 2012). The weighted min-max formulation, or weighted Tchebycheff model method proposed by Steuer and Choo (1983), Steuer (1986) and Tind and Wiecek (1999) can give almost efficient solu- tions in the bi-objective optimization problems. There is at least one non-dominated criterion vector in the weighted Tchebycheff model (Steuer and Choo, 1983).
The decision makers’ preferences to responses are depicted through the weights. The weakness of the weighted Tchebycheff approach is that besides non-dominated points also weakly non-dominated points are generated in general (Miettinen, 1999, and Dachert et al., 2012). The way to overcome this drawback is to add an augmentation l1 norm, with the augmentation coefficient , to the weighted l∞ norm between the utopia point and the feasible set of a given problem is proposed by Steuer and Choo (1983). In other words, the way to ensure the generated outcome closet to the ideal point along one edge of the optimal level line is to utilize both l1 norm and l∞ norm (Ralphs et al., 2006). This is called the augmented weighted Tchebycheff model. The augmented weighted Tchebycheff model combines the advantages of the original (not augmented) approach, namely the potential gene- ration of every non-dominated point by appropriately modi- fying the weights and/or the reference point, with the property that weakly non-dominated points are avoided (Steuer and Choo, 1983). Also, the main advantage of the augmented weighted Tchebycheff approach compared to the lexicographic weighted Tchebycheff approach is discussed particularly in Dachert et al. (2012). The proposed augmented weighted Tchebycheff method may provide significant alternatives to avoid the weakly efficient optimum in multiple responses optimization problems. By considering the weight between the gelation kinetics and drug release, a set of efficient solutions can be generated in the proposed method instead of the single optimal solution in RD literature.
To this end, a model building method for the multiple and time oriented responses to RD problems is proposed in this paper. The efficient optimal solutions of this kind of data can be obtained by using the proposed augmented weighted Tchebycheff method. A pharmaceutical case study which
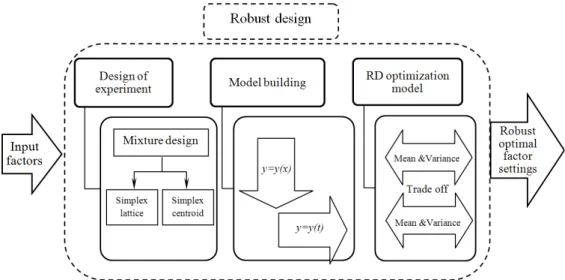
Figure 1. Overview of the proposed methodology for dynamic multiple responses includes the multiple and dynamic responses is utilized to
demonstrate the Pareto solutions using the proposed RD model based on the augmented weighted Tchebycheff approach.
Finally, an overview of the proposed RD method is illustrated in <Figure 1>. The remainder of this paper is organized as follows : Section 2 describes the modeling method based on dual responses method for the observed time-domain res- ponses, the augmented weighted Tchebycheff model for robust design multi- objective optimizationis discussed in section 3, the pharmaceutical case study is conducted to illustrate the Pareto solutions in the section 4, finally, the conclusions are drawn in section 5.
2. Modeling Method
The joint estimation for the multiple and time series data in robust design modelling is proposed by Shin et al. (2011), Choi et al. (2012), Nha et al. (2013). This modelling method is constructed based on two stages. First of all, the infor- mation about the relationship between input factors and output responses is explored in the design of experiments (DoE) stage. Secondly, the model parameters to determine the func- tional form of the relationship between input factors and output responses are estimated in the estimation stage.
2.1 Experimental Design Stage
The experimental design stage has the significant influence on the quality of the pharmaceutical products in the early stages of drug development. Since, the particular trait of for- mulation of drugs is the mixture of a lot of compositions and the interaction between of them, the percentage of different components in the mixture is often considered in the phar- maceutical experimental design rather than their amounts.
Therefore, the mixture experiment is used in which the quality characteristics or responses are conditional upon the propor- tions of ingredients of a mixture (i.e., inputs). Simplex-lattice designs and simplex-centroid designs are two standard mixture designs that are often used in a mixture experiment.
It is assumed that there are ingredients in the mixture with the percentage ⋯ . The fact that the pro- portions of these ingredients must sum to 100% compli- cates the design as well as the analysis of mixture experi- ments. Also, it is assumed that the usual assumptions made for factorial experiments are also made for mixture experi- ments and that the errors are independent and identically distributed with zero mean and common variance.
In the literature, the traditional design methods were dealt with the time-insensitive characteristics of interest in which all the responses are often collected at a given time. In many circumstances, especially in pharmaceutical study processes, the characteristics of interest are time-dependent. Therefore, it is necessary to perform experiments in which responses are collected as dynamic responses, or multiple observed time- domain data for all experimental runs.
It is necessary to build the experimental design format with
output responses ⋯ ⋯ in which each of these responses consists of responses at each point of time
in this pharmaceutical study. replications are taken for each of responses with experiments runs and input control factors . The estimators of mean and variance at the design point can be obtained in formulation (1) and formulation (2).
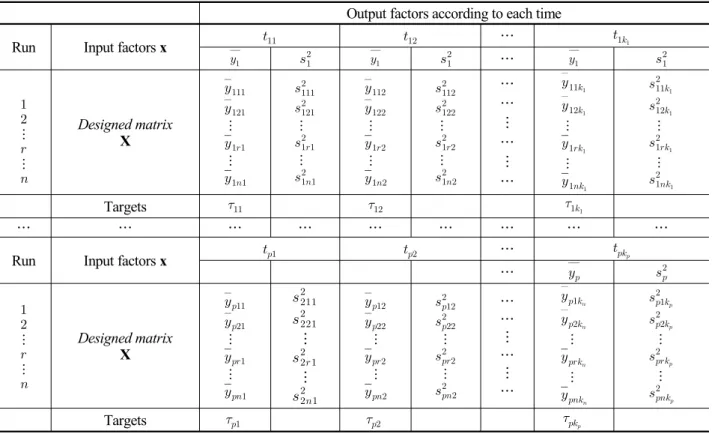
The experimental design format for multiple observed time-domain responses is illustrated in <Table 1>.
̅
∑
(1)
∑
̅
(2)
406 Le Tuan Ho․Sangmun Shin
Output factors according to each time
Run Input factors x …
…
⋮
⋮
Designed matrix X
⋮
⋮
⋮
⋮
⋮
⋮
⋮
⋮
…
…
⋮
…
⋮
…
⋮
⋮
⋮
⋮
Targets
… … … …
Run Input factors x …
…
⋮
⋮
Designed matrix X
⋮
⋮
⋮
⋮
⋮
⋮
⋮
⋮
…
…
⋮
…
⋮
…
⋮
⋮
⋮
⋮
Targets
Table 1. Experimental design format for multiple observed time-domain responses 2.2 Model Building Method Based on the
Dual Responses Approach
Starting from the requirement of practice in pharmaceu- tical industry, it is necessary to handle the responses (i.e., drug release rate and gelation rates) as multiple observed time-domain data. The modeling of functional relationships between time series mean and variance responses with control factors is the combination of two ways : in the vertical way, the responses can be modeled as functions of control factors, while they will be functions of time in horizontal way.
Following that idea, the mean response matrix is the function of the control factors as
̂ ̃ × . (3) where denotes a matrix of parameters in vertical analysis and can be estimated by least squares method as follows :
⋯ (4) Each of model parameter vectors can be estimated by least square method as
. (5)
where is mean column vector of
. The general horizontal form of the relationship between mean matrix and time can be derived as follows:
× (6) where ⋯ is the transposed matrix of parameters for horizontal analysis, and ⋯ is a polynomial vector of time .
Denote T as the designed matrix of t. Each of model parameter vectors can be estimated by least square method
(7) where is the mean row vector and ×. Using Equations (3), (4) and (7), the general combined relationship of mean response matrix can be illustrated as a function of control factors and time t, and the estimated functioncan be expressed as
(8) Similarly, let be the variance response matrix. In the horizontal way approach, the variance response matrix can be considered horizontally as ⋯ ⋯ where
represents uth row vector of the variance response matrix.
Therefore, the functional relationship between variance response matrix and input control factors over time can be expressed as
(9) where ⋯ is the transposed matrix of parameters for horizontal analysis with variance response matrix; is the uth model parameter vector
(10) The relationships between mean, variance responses and control factors at any given time are described by Equations (9) and (10) which are able to handle the interested RD problem.
3. The proposed Augmented Weighted Tchebycheff Model
In robust design, the mean square error is often used to consider the simultaneous bias (i.e., the deviation between the mean and the target) and the variance of each of the quality characteristics of interest. Also, in the pharmaceutical case study, two quality characteristics of drug products such as drug release and gelation kinetics are considered. Conse- quently, the robust design optimization model using the weighted Tchebycheff multi-objective method for time oriented responses can be written in the bi-objective optimization model as
Minmax
× ̂
× ̂
(11)
where the weight ≥ , and and represent the utopia points for the gelation kinetics response and the drug release response, respectively. and denote as the target values of gelation kinetics and drug release at each point of time, respectively.
Ageneralized approach for handling the above function (11) is to introduce an additional unknown parameter and new constraints as follows :
Minimize Subject to
× ̂ ≤
× ̂ ≤ (12)
In order to avoid the weakly non-dominated points in the weighted Tchebycheff model, the augmented weighted Tcheby- cheff method is proposed for this robust design problem. The proposed model can be expressed as
Minimize
̂
̂
Subject
× ̂ ≤
× ̂ ≤ (13)
where augmentation coefficient is a sufficiently small positive scalar assigned by the decision maker. Every solu- tion of robust design augmented weighted Tchebycheff model with coefficient is a properly non-dominated.
A point x*∈ S is nondominated solution if there does not exist another point x∈ S, such that fi(x) ≤ fi(x*) for all i = 1, …, k, and fj(x) < fj(x*) for at least one j. A point x* ∈ S is weakly nondominated solution if there does not exist another point x ∈ S such that fi(x) < fi(x*) for all i = 1, …, k.
A detail instruction in chosen of the weights and the aug- mentation coefficient in the augmented weighted Tchebycheff method can be seen in Dachert et al. (2012).
4. Case Study
The brand name drugs with their copyright and registered trademark are protected by U.S. Patent and Trademark Office.
With their reputation, the price of these kinds of drugs is rather expensive. Therefore, the patients and insurance companies often meet many difficulties in order to be able to use them. After about 17 years-registered trademark of brand name drugs, the other companies can produce the similar drugs, called generic drugs.
The main difference of these kinds of drugs is their prices. The appearance of the generic drugs can make the price of drugs decrease significantly. However, the US Food and Drug Admi- nistration forces the generic manufacturers must conform to the following requirements : the generic drug shave to have the same substances, effects, dose, usage the brand name drug and be produced under the strict manufacturing process of Good Manu- facturing Production. The generic drug must release the same drug substance from two or more drug products or formulations.
In order to conduct a bio equivalent test in vitro, a tablet gelation and drug release test case study is performed. For the case study, the experimental data are used in Shin et al. (2011).
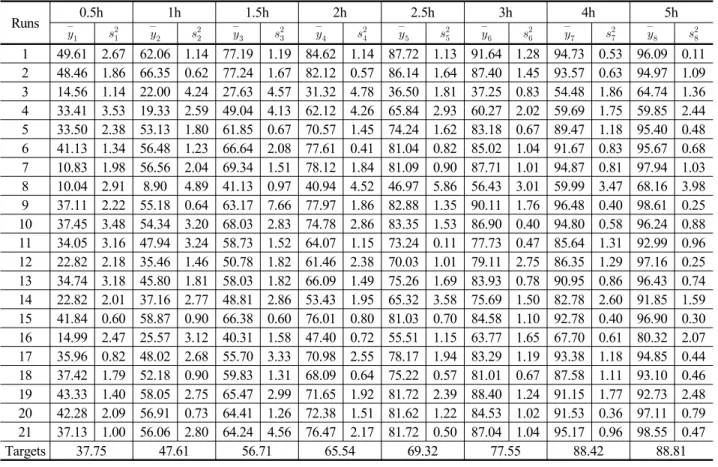
In this study, ten factors from x1 to x10 are used in the simplex-lattice mixture design with 21 experimental runs. At each treatment, four replications to measure the gelation kinetics and drug release rates are performed at a given time.
408 Le Tuan Ho․Sangmun Shin
Runs 0.5h 1h 1.5h 2h 2.5h 3h 4h 5h
1 49.61 2.67 62.06 1.14 77.19 1.19 84.62 1.14 87.72 1.13 91.64 1.28 94.73 0.53 96.09 0.11 2 48.46 1.86 66.35 0.62 77.24 1.67 82.12 0.57 86.14 1.64 87.40 1.45 93.57 0.63 94.97 1.09 3 14.56 1.14 22.00 4.24 27.63 4.57 31.32 4.78 36.50 1.81 37.25 0.83 54.48 1.86 64.74 1.36 4 33.41 3.53 19.33 2.59 49.04 4.13 62.12 4.26 65.84 2.93 60.27 2.02 59.69 1.75 59.85 2.44 5 33.50 2.38 53.13 1.80 61.85 0.67 70.57 1.45 74.24 1.62 83.18 0.67 89.47 1.18 95.40 0.48 6 41.13 1.34 56.48 1.23 66.64 2.08 77.61 0.41 81.04 0.82 85.02 1.04 91.67 0.83 95.67 0.68 7 10.83 1.98 56.56 2.04 69.34 1.51 78.12 1.84 81.09 0.90 87.71 1.01 94.87 0.81 97.94 1.03 8 10.04 2.91 8.90 4.89 41.13 0.97 40.94 4.52 46.97 5.86 56.43 3.01 59.99 3.47 68.16 3.98 9 37.11 2.22 55.18 0.64 63.17 7.66 77.97 1.86 82.88 1.35 90.11 1.76 96.48 0.40 98.61 0.25 10 37.45 3.48 54.34 3.20 68.03 2.83 74.78 2.86 83.35 1.53 86.90 0.40 94.80 0.58 96.24 0.88 11 34.05 3.16 47.94 3.24 58.73 1.52 64.07 1.15 73.24 0.11 77.73 0.47 85.64 1.31 92.99 0.96 12 22.82 2.18 35.46 1.46 50.78 1.82 61.46 2.38 70.03 1.01 79.11 2.75 86.35 1.29 97.16 0.25 13 34.74 3.18 45.80 1.81 58.03 1.82 66.09 1.49 75.26 1.69 83.93 0.78 90.95 0.86 96.43 0.74 14 22.82 2.01 37.16 2.77 48.81 2.86 53.43 1.95 65.32 3.58 75.69 1.50 82.78 2.60 91.85 1.59 15 41.84 0.60 58.87 0.90 66.38 0.60 76.01 0.80 81.03 0.70 84.58 1.10 92.78 0.40 96.90 0.30 16 14.99 2.47 25.57 3.12 40.31 1.58 47.40 0.72 55.51 1.15 63.77 1.65 67.70 0.61 80.32 2.07 17 35.96 0.82 48.02 2.68 55.70 3.33 70.98 2.55 78.17 1.94 83.29 1.19 93.38 1.18 94.85 0.44 18 37.42 1.79 52.18 0.90 59.83 1.31 68.09 0.64 75.22 0.57 81.01 0.67 87.58 1.11 93.10 0.46 19 43.33 1.40 58.05 2.75 65.47 2.99 71.65 1.92 81.72 2.39 88.40 1.24 91.15 1.77 92.73 2.48 20 42.28 2.09 56.91 0.73 64.41 1.26 72.38 1.51 81.62 1.22 84.53 1.02 91.53 0.36 97.11 0.79 21 37.13 1.00 56.06 2.80 64.24 4.56 76.47 2.17 81.72 0.50 87.04 1.04 95.17 0.96 98.55 0.47
Targets 37.75 47.61 56.71 65.54 69.32 77.55 88.42 88.81
Table 2. Experiment results for gelation study
Runs 0.5h 1h 1.5h 2h 3h 4h 6h 8h 10h 12h 24h
1 13.0 0.9 21.2 1.6 28.4 1.9 35.4 2.5 48.4 4.0 60.9 5.1 77.5 6.9 88.0 6.4 92.5 6.6 95.6 6.6 103.8 6.8 2 7.1 0.7 12.6 1.7 18.0 2.5 23.7 3.9 32.0 4.1 41.5 5.1 54.4 6.7 64.5 7.4 72.9 7.8 80.7 8.8 105.0 3.9 3 7.4 0.8 11.6 0.6 15.0 1.6 18.3 1.3 25.2 1.5 32.5 2.6 45.9 2.9 58.3 3.8 68.6 5.1 76.8 4.8 98.7 3.4 4 5.9 1.0 9.4 1.3 14.8 1.8 17.8 1.9 23.7 2.2 32.0 2.2 47.3 2.7 61.0 4.4 73.4 5.4 83.8 5.4 104.4 0.7 5 3.9 0.4 8.1 1.0 8.1 1.0 9.6 1.1 13.7 1.1 19.3 1.8 28.2 2.0 38.3 2.6 49.9 4.0 60.6 4.4 107.4 4.9 6 5.6 0.9 9.2 1.0 12.7 1.4 16.1 1.3 22.5 2.3 30.0 2.8 45.1 5.0 61.7 9.0 73.5 8.8 86.4 10.4 107.7 0.5 7 4.6 0.2 7.9 0.6 9.9 0.8 12.9 0.5 17.9 1.4 23.3 1.8 34.9 2.9 46.9 5.6 58.8 7.1 71.0 8.7 102.5 3.9 8 7.2 0.5 10.0 0.8 13.1 1.2 16.0 1.5 21.6 2.0 27.1 3.1 38.2 5.3 48.9 7.5 59.6 8.9 68.6 9.8 100.6 3.0 9 4.7 0.3 7.5 0.5 10.1 0.5 13.0 0.1 18.7 1.1 25.1 1.0 35.6 2.3 47.3 3.8 55.1 2.0 66.1 4.5 104.5 0.9 10 3.6 0.4 6.4 0.2 8.6 1.0 10.9 0.7 15.7 1.3 21.5 2.4 31.4 4.0 42.5 5.5 52.6 6.7 62.4 8.0 96.9 4.6 11 4.9 0.3 8.3 0.7 11.6 0.1 13.8 0.1 19.9 1.2 25.8 1.4 35.6 2.0 45.6 3.1 54.7 3.6 64.2 7.1 99.6 1.8 12 7.2 0.5 9.2 0.3 10.5 0.2 11.8 0.3 15.7 0.6 20.1 0.5 28.2 1.2 37.5 2.1 47.2 3.4 56.9 4.9 90.3 4.7 13 4.2 0.3 7.0 0.7 9.3 0.5 12.0 0.7 16.8 0.9 22.2 1.9 32.4 2.9 43.1 4.4 53.6 6.0 93.6 7.2 99.3 3.0 14 4.0 0.4 6.9 0.5 9.5 0.6 12.2 1.1 17.4 2.1 23.4 3.0 33.8 5.0 44.3 6.8 54.6 8.6 63.6 8.8 92.6 5.0 15 3.6 0.1 6.5 0.3 8.1 0.4 10.2 0.3 14.3 0.3 19.2 0.8 27.9 1.2 36.5 1.5 44.4 1.7 52.2 1.8 88.9 1.4 16 5.0 0.8 8.4 0.7 12.1 0.5 15.3 0.9 20.9 0.9 26.6 1.6 35.5 1.4 44.0 1.8 51.0 1.85 56.9 1.6 78.2 1.8 17 4.8 0.2 7.5 0.3 10.8 0.7 13.4 0.5 18.3 1.0 22.8 1.2 31.7 1.9 40.2 2.5 48.50 3.9 55.8 4.3 95.0 5.8 18 3.2 0.4 5.3 0.4 7.6 0.7 9.5 1.0 14.1 1.2 19.39 2.2 28.1 3.1 36.7 3.3 44.1 4.8 50.3 4.5 76.8 7.3 19 6.0 0.7 10.7 1.2 15.6 1.5 21.4 2.3 31.0 3.1 38.6 4.5 50.8 6.8 62.2 8.2 70.6 8.7 76.2 8.9 100.1 10.8 20 4.9 0.3 7.7 0.9 10.5 1.0 13.0 1.9 18.7 2.9 24.5 4.1 37.1 7.3 49.4 11.7 61.3 14.2 70.6 15.9 105.7 2.0 21 2.2 0.6 4.8 1.1 6.3 1.0 8.8 1.1 13.3 1.9 18.0 3.5 28.1 6.1 39.4 8.3 49.5 10.6 60.4 12.3 100.1 9.9
6.0 11.0 12.8 16.1 22.6 29.8 43.5 51.4 60.3 68.5 82.3
Table 3. Experiment results for drug release kinetics
Five basic ingredients Polyethyleneoxide WSR-303 (PEO, x1), Low-substituted hydroxypropyl cellulose (LH-11, x2), Syloid Silica C 1007 (Syloid , x3), Citric acid monohydrate (Citric acid, x8), and Hypromellose USP (pharma coat 603, x9) are selected as considerable factors to conduct the effect of them on the gelation kinetics () for tablets which are recorded at various increments within a time interval from 0.5 to 5 hours and on drug release rates () which is taken the measurements from 0.5h to 24h. The mean and variance of the gelation kinetics and drug release rates are calculated based on the formulas (1) and (2). The experimental results for gelation test included mean and variance associated with target values are shown in <Table 2>. The experimental results for mean and variance drug release kinetics over the time are calculated and illustrated in <Table 3>.
From the experimental results in <Tables 2> and <Table 3>, the empirical functions between output responses and input control factors over time are illustrated in both analysis ways: vertical and horizontal. In medicine, the screening procedure is often used in order to select the significant input factors because of the large number of input factors. In this study, five input control factors are picked out for estimating the mean and variance functions of gelation kinetics and drug release rates.
Based on the experimental format and equations (8) and (9), the parameter matrix of the mean and variance functions for gelation kinetics are respectively expressed as
20.49 0.04 -0.13 -0.15 0.12 33.12 -0.03 -0.01 -0.12 -0.01 -3.75 0.004 0.004 0.02-0.003 -0.08 -0.01 0.006
,
3.51 -0.55 0.01 -0.009 0.001 0.001 0.004 -0.003 0.007 0.0024 -0.0085 -0.0015 -0.0036 -0.0006 0.0001 -0.0001 -0.003 -0.0005
,Similarly, the parameter matrix of the mean and variance functions for drug release kinetics are respectively achieved as
0.2149-0.0017 0.0228 0.0200 0.0867 8.2445-0.0156-0.0102 0.0075 0.0321 - 0.1350 0.0003-0.0004-0.0015 0.0001 -0.0049 -0.0045 -0.0001
,
-1.3394 0.0056 0.0087 0.0040 0.0142 1.7358 -0.0059 -0.0074 0.0017 0.0012 - 0.0620 0.0002 0.0000 0.0010 0.0003 -0.0030 -0.0009 0.0000
The proposed augmented weighted Tchebycheff optimi- zation solutions can be obtained by solving the problem (13) using the Matlab software package. The efficient Pareto solu-
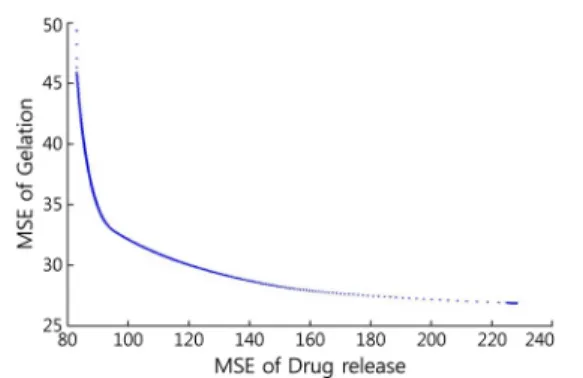
tions are drawn in the objective space with the mean square error of the drug release in x-axis and the mean square error of the gelation in the y-axis, as shown in the <Figure 2>.
Figure 2. Pareto frontier using the proposed augmented weighted Tchebycheff model
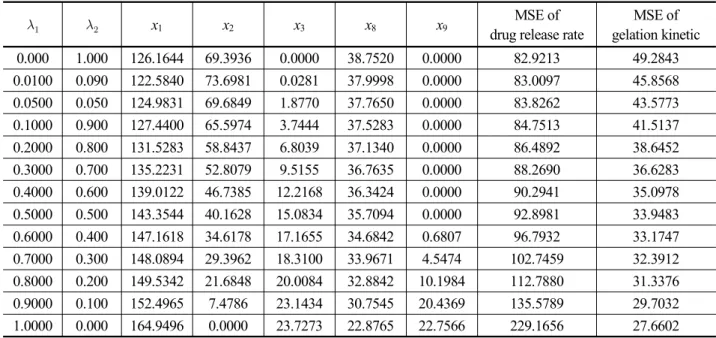
The Matlab program codes for solving the proposed aug- mented weighted Tchebycheff model can automatically gene- rate a number of Pareto solutions and Pareto frontier based on the given weights and . As can be seen in the <Figure 2>, the Pareto frontier is convex and the efficient solutions can be generated in the entire region. By considering the tradeoff between two responses (i.e., gelation kinetics and drug re- lease) while changing the weights of two responses from 0.0 to 1.0 with the increment 0.01, the proposed method can generate all the efficient solutions (x1, x2, x3, x8, and x9) in the entire region. The resulted Pareto solutions obtained from the augmented weighted Tchebycheff can be represented in the
<Table 4>. As shown in <Table 4>, while increasing , MSEs of drug release rate were increased, but MSEs of gelation kinetic were decreased. In order to demonstrate the optimi- zation results in terms of criterion spaces, the squared bias vs.
variance of the drug release and gelation are illustrated in
<Figure 3>. Blue area in <Figure 3> represents the set of the possible values calculated from the estimated process bias and variance functions of the drug release rate and gelation kinetic that correspond to the control vectors of the feasible domain.
Figure 3. Criterion spaces of drug release and gelation
410 Le Tuan Ho․Sangmun Shin
x1 x2 x3 x8 x9 MSE of
drug release rate
MSE of gelation kinetic 0.000 1.000 126.1644 69.3936 0.0000 38.7520 0.0000 82.9213 49.2843 0.0100 0.090 122.5840 73.6981 0.0281 37.9998 0.0000 83.0097 45.8568 0.0500 0.050 124.9831 69.6849 1.8770 37.7650 0.0000 83.8262 43.5773 0.1000 0.900 127.4400 65.5974 3.7444 37.5283 0.0000 84.7513 41.5137 0.2000 0.800 131.5283 58.8437 6.8039 37.1340 0.0000 86.4892 38.6452 0.3000 0.700 135.2231 52.8079 9.5155 36.7635 0.0000 88.2690 36.6283 0.4000 0.600 139.0122 46.7385 12.2168 36.3424 0.0000 90.2941 35.0978 0.5000 0.500 143.3544 40.1628 15.0834 35.7094 0.0000 92.8981 33.9483 0.6000 0.400 147.1618 34.6178 17.1655 34.6842 0.6807 96.7932 33.1747 0.7000 0.300 148.0894 29.3962 18.3100 33.9671 4.5474 102.7459 32.3912 0.8000 0.200 149.5342 21.6848 20.0084 32.8842 10.1984 112.7880 31.3376 0.9000 0.100 152.4965 7.4786 23.1434 30.7545 20.4369 135.5789 29.7032 1.0000 0.000 164.9496 0.0000 23.7273 22.8765 22.7566 229.1656 27.6602
Table 4. Pareto solutions using the proposed augmented weighted Tchebycheff model
5. Conclusion
The proposed augmented weighted Tchebycheff-based RD model successfully generated the non-dominated efficient Pareto solutions for the multiple and time-series responses.
The optimal solutions obtained from the proposed method may consider significantly low potential possibility of weakly Pareto optimum in this particular case study. This research can be extended for investigation Pareto frontiers of all the variations of the weighted Tchebycheff approach and a com- parison of all the scalarization functions should be taken to get the best efficient solutions for further studies. In addition, the weight assignment problem is critically important in pharma- ceutical formulation development including in vivo-in vitro correlation. Further extension of the proposed augmented weighted Tchebycheff method to modified new drug develop- ment can be possible by considering a weight assignment method.
References
Box, G. (1988), Signal-to-Noise Ratios, Performance Criteria, and Trans- formations, Technometrics, 30(1), 1-17.
Castillo, E. and Montgomery, D. C. (1993), A nonlinear programming solution to the dual response problem, Journal of Quality Technology, 25, 199-204.
Cho, B. R., Philips, M. D., and Kapur, K. C. (1996), Quality improvement by RSM modeling for robust design, The 5th Industrial Engineering Research Conference, Minneapolis, MN, 650-655.
Cho, B. R., Shin, S. M., Choi, Y., and Kovach, J. (2009), Development of a Multidisciplinary Optimization Process for Designing Optimal Pharmaceutical Formulations with Constrained Experimental Regions, International Journal of Advanced Manufacturing Technology, 44, 841-853.
Choi, D. H., Shin, S. M., Truong, N. K. V., Jung, Y. J., Chu, K. R., and Jeong, S. H. (2012), A new experimental design method to optimize formulations focusing on a lubricant for hydrophilic matrix tablets, Journal of Drug Development and Industrial pharmacy, 38(9), 1117- 1127.
Copeland, K. A. F. and Nelson, P. R. (1996), Dual Response Optimization via Direct Function Minimization, Journal of Quality Technology, 28 (3), 331-336.
Dachert, K., Gorski, J., and Klamroth, K. (2012), An augmented weighted Tchebycheff method with adaptively chosen parameters for discrete bicriteria optimization problems, Computers and Operations Research, 39(12), 2929-2943.
Del Castillo, E. and Montgomery, D. C. (1993), A nonlinear programming solution to the dual response problem, Journal of Quality Technology, 25, 199-204.
Ding, R., Lin, D. K. J., and Wei, D. (2004), Dual Response Surface Optimization : A Weighted MSE Approach, Quality Engineering, 16(3), 377-385.
Ehrgott, M. (2006), A discussion of scalarization techniques for multiple objective integer programming, Ann Oper Res, 147, 343-360.
Goethals, P. L. and Cho, B. R. (2011), The development of a robust design methodology for time-oriented dynamic quality characteristics with a target profile, Quality and Reliability Engineering International, 27, 403-414.
Hsieh, K., Tong, L., Chiu, H., and Yeh, H. (2005), Optimization of a multi- response problem in Taguchi’s dynamic system, Computers and In- dustrial Engineering, 49, 556-571.
Kasimbeyli, R. (2013), A conic scalarization method in multiobjective op- timization, J Glob Optim, 56, 279-297.
Kim, Y. J. and Cho, B. R. (2002), Development of Priority-Based Robust
Design, Quality Engineering, 14, 355-363.
Kim, K. J. and Lin, D. K. J. (1998), Dual response surface optimization : A fuzzy modeling approach, Journal of Quality Technology, 30, 1-10.
Koksoy, O. and Doganaksoy, N. (2003), Joint optimization of mean and standard deviation using response surface methods, Journal of Quality Technology, 35, 239-252.
Kovach, J. and Cho, B. R. (2008), Development of a multidisciplinary- multiresponse robust design optimization model, Engineering Optimi- zation, 40, 805-819.
Leon, R. V., Shoemaker, A. C., and Kacker, R. N. (1987), Performance measures independent of adjustment-An explanation and extension of Taguchi’s signal-to-noise ratios, Technometrics, 29(3), 253-265.
Lin, D. K. J. and Tu, W. (1995), Dual response surface optimization, Journal of Quality Technology, 27, 34-39.
Marler, R. T. and Arora, J. S. (2004), Survey of multiobjective optimi- zation methods for engineering, Struct Multidisc Optim, 26, 369-395.
Miettinen, K. (1999), Nonlinear multiobjective optimization, Boston : Kluwer Academic Publishers.
Miettinen, K. and Makela, M. M. (2002), On scalarizing functions in multi- objective optimization, OR Spectrum, 24, 193-213.
Myers, R. H. and Montgomery, D. C. (2002), Response surface metho- dology : process and product optimization using designed experi- ments (2nd ed.). J. Wiley, New York.
Nair, V. N. (1992), Taguchiʼs Parameter Design : A Panel Discussion, Technometrics, 34, 127-161.
Nha, V. T., Shin, S. M., and Jeong, S. H. (2013), Lexicographical dynamic goal programming approach to a robust design optimization within the pharmaceutical environment, European Journal of Operational Re- search, 229(2), 505-517.
Ralphs, T. K., Saltzman, M. J., and Wiecek., M. M. (2006), An improved algorithm for solving biobjective integer programs, Annals of Opera- tions Research, 147(1), 43-70.
Reddy, K., Nishina1, A., and Babu, S. (1998), Unificationofrobust de- sign and goal programming for multiresponse optimization-a case study, Quality and Reliability Engineering International, 13(6),
371-383.
Robinson, T. J., Wulff, S. S., Montgomery, D. S., and Khuri, A. I. (2006), Robust parameter design using generalized linear mixed models, Journal of Quality Technology, 38, 65-75.
Shin, S. M. and Cho, B. R. (2005), Bias-specified robust design opti- mization and an analytical solutions, Computers and Industrial Engi- neering, 48, 129-148.
Shin, S., Choi, D. H., Truong, N. K. V., Kim, N. A., Chu, K. R., and Jeong, S. H. (2011), Time-oriented experimental design method to optimize hydrophilic matrix formulations with gelation kinetics and drug re- lease profiles, International Journal of Pharmaceutics, 407, 53-62.
Steuer, R. E. (1986), Multiple Criteria Optimization : Theory, Computa- tion and Application, Wiley, New York, NY.
Steuer, R. E. and Choo, E. U. (1983), An interactive weighted Tchebycheff procedure for multiple objective programming, Mathematical Pro- gramming, 26, 326-344.
Tang, L. C. and Xu, K. (2002), A Unified Approach for Dual Response Surface Optimization, Journal of Quality Technology, 34(4), 437-447.
Tind, J. and Wiecek, M. M. (1999), Augmented Lagrangian and Tcheby- cheff approaches in multiple objective programming, Journal of Global Optimization, 14, 251-266.
Truong, N. K. V., Shin, S. M., and Jeong, S. H. (2011), Integrating Inverse problem to robust design for a generic drug development process, Journal of the Korean Society for Quality Management, 39(3), 365- 376.
Tsui, K. L. (1992), An overview of Taguchi method and newly developed statistical methods for robust design, IIE Transactions, 24(5), 44-57.
Vining, G. G. and Myers, R. H. (1990), Combining Taguchi and Response Surface Philosophies : A dual Response Approach, Journal of Quality Technology, 22, 38-45.
Zadeh, L. A. (1963), Optimality and non-scalar-valued performance criteria, IEEE Trans, Autom. Control AC-8, 59-60.
Zionts, S. (1988), Multiple criteria mathematical programming : an up- dated overview and several approaches. In : Mitra, G. (ed.) Mathemati- cal Models for Decision Support, 135-167. Berlin : Springer-Verlag.