Journal of the Korean Institute of Industrial Engineers http://dx.doi.org/10.7232/JKIIE.2012.38.4.237
Vol. 38, No. 4, pp. 237-243, December 2012. © 2012 KIIE
ISSN 1225-0988 | EISSN 2234-6457
변동성지수와 관리도를 이용한 KOSPI200 지수선물 투자전략
유재필 신현준 상명대학교 경영공학과
Investment Strategies for KOSPI200 Index Futures Using VKOSPI and Control Chart
Jaepil Ryu Hyun Joon Shin
Dept. of Management Engineering, Sangmyung University
This paper proposes quantitative investment strategies for KOSPI200 index futures using VKOSPI and control chart. Stochastic control chart is employed to decide when to take a position as well as what position out of long and short should be taken by monitoring whether VKOSPI or difference of VKOSPI touches the control limit lines. The strategies include 4 approaches, which are traditional control chart and 2-Area control chart coupled with VKOSPI and its difference, respectively. Computational experiments using real KOSPI200 futures index for recent 3 years are conducted to show the excellence of the proposed investment strategies under control chart framework.
Keywords: VKOSPI, KOSPI200 Index Futures, SPC Control Chart, Investment Strategies, Volatility
1. 서 론
(volatility) (risk) (investment strategy) .
. .
(derivatives) .
,
. (indicator)
, (Korea Exchange; KRX)
2009 4 13 KOSPI200
VKOSPI(Volatility index of KOSPI200) ,
2003 1 2 VKOSPI
. 2003
(CBOE)
(volatility index; VIX) .
(market risk) (hedge) .
.
(Lee, 2009).
연락저자 신현준 교수, 330-720 충남 천안시 동남구 안서동 300 상명대학교 경영공학과, Tel : 041-550-5374, Fax : 041-550-5185, E-mail : [email protected]
2012년 10월 2일 접수; 2012년 11월 13일 수정본 접수; 2012년 11월 15일 게재 확정.
238 유재필 신현준
.
KRX KOSPI200 VKOSPI
, . (statistical quality control)
(chart) VKOSPI
KOSPI200 .
2 ( ) 2 2-Area
VKOSPI
. VKOSPI KOSPI200
2009 1 2011
12 KOSPI200
, .
2. 기존연구
,
(Corrado et al., 2005; Koopman et al., 2005; Martens, 2002).
(Choi and Kim, 2009).
, GARCH (implied vola-
tility) . Christen and Prabhala(1998), Jorion(1995), Day and Lewis(1992)
. Canina (1993) 1983 3 1987 3 S&P100
. Black-Scholes
, Black-Scholes . Giot(2005) S&P 100
Nasdaq 100 VIX VXN
. Becker et al.(2009)
(jump activation) .
Ock(1997) GJR-GARCH 8
. Choi(2010) KOSPI200 VKOSPI
, VKOSPI
. Kim and Ryoo(2007)
KRX, AMEX, NYSE
.
. SPC chart
KOSPI200 ,
.
3 KOSPI200 VKOSPI
, 4
KOSPI
200 . 5
, 6
.
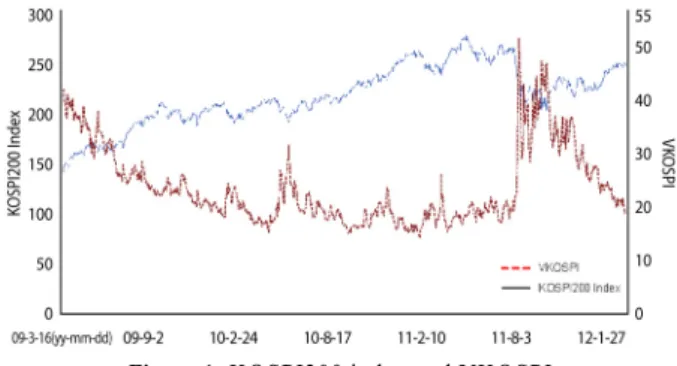
Figure 1. KOSPI200 index and VKOSPI
3. KOSPI200과 VKOSPI 간의 상관관계
KRX VKOSPI KOSPI200
KRX
. ,
(contrarian psychology)
. ,
,
. ( )
변동성지수와 관리도를 이용한 KOSPI200 지수선물 투자전략 239
(Lee, 2009).
VKOSPI KOSPI200 . <Figure 1> 3
KOSPI200 VKOSPI .
2011 8 KOSPI200
VKOSPI .
<Table 1> VKOSPI 2009 2012
5 KOSPI200 -0.804
. KOSPI200 ( ) VKOSPI
( ) , KOSPI200
. 2010
-0.521 , 5
.
Table 1. Correlation between KOSPI200 and VKOSPI
Year 2009 2010 2011 2012
Correlation -0.933 -0.521 -0.901 -0.864
VKOSPI KOSPI200
VKOSPI .
VKOSPI KOSPI
200 .
Figure 2. An example of control chart
4. 관리도를 이용한 KOSPI200 지수선물 투자전략
4.1 전통적인 관리도를 이용한 투자전략
.
.
( , )
.
<Figure 2>
. CL(center line) , UCL(upper control limit) LCL(lower control limit)
.
40 (abnormal
situation) .
VKOSPI
(control limit line)
(touch) (abnormal situation)
KOSPI200
. UCL LCL .
(1)
(2)
,
VKOSPI
VKOSPI
( , 0 < k < 1)
(1) (2)
,
. 5.1
. 1
1 .
Figure 3. An investment procedure using control chart
240 Jaepil Ryu Hyun Joon Shin
<Figure 3> VKOSPI
.
VKOSPI UCL LCL
KOSPI200 (Short; S.No) ,
(Long; L.No) (
No ).
(cash settlement) .
<Figure 3> VKOSPI UCL
KOSPI200 (S.1)
VKOSPI UCL
(L.1) (S.1)
. VKOSPI LCL
(L.2)
(L.1) . VKOSPI
UCL LCL
KOSPI200 .
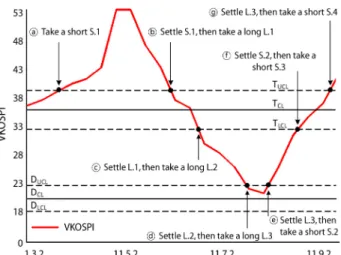
Figure 4. An investment procedure using 2-Area control chart
4.2 2-Area 관리도를 이용한 투자전략
VKOSPI (jump activation)
. VKOSPI
top down 2- (2-Area)
(UCL LCL)
. 2-Area top down VKOSPI
28 , VIX CBOE
, 28 VIX
. 2-Area
<Figure 4> , <Table 2>
<Figure 3>
.
top ,
down
, 1
1 .
.
(3)
(4)
(5)
(6)
,
VKOSPI 2 8 VKOSPI
VKOSPI 28 VKOSPI
VKOSPI < 28 VKOSPI
VKOSPI < 28 VKOSPI
Table 2. Investment strategy using 2-Area control chart Control limit
lines
Direction for
touch Investment actions
,
,
,
Upward Take a short position and settle previous positions if any Downward Take a long position and
settle previous positions if any
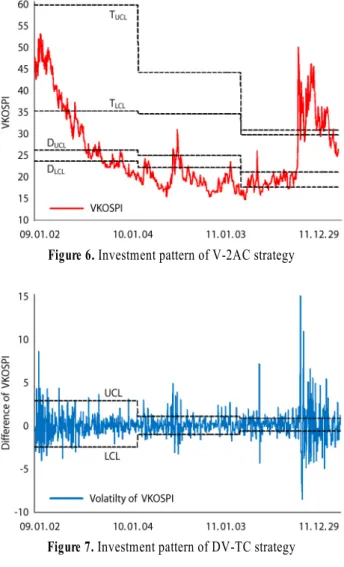
4.3 VKOSPI 차분과 관리도를 이용한 투자전략
VKOSPI VKOSPI
VKOSPI (=