한국정보통신학회논문지 Vol. 25, No. 9: 1199~1205, Sep. 2021
빅데이터 분석 도구 R을 이용한 비정형 데이터 텍스트 마이닝과 시각화
남수태1·신성윤2·진찬용3*
Text Mining and Visualization of Unstructured Data Using Big Data Analytical Tool R
Soo-Tai Nam
1· Seong-Yoon Shin
2· Chan-Yong Jin
3*1
Lecturer, Institute of General Education, Pusan National University, Busan, 46241 Korea
2
Professor, School of Computer Information & Communication Engineering, Kunsan National University, Kunsan, 54150 Korea
3*
Professor, Division of Information & Electronic Commerce, Wonkwang University, Iksan, 54538 Korea
요 약
빅데이터 시대에는 단순히 데이터베이스에 잘 정리된 정형 데이터뿐만 아니라 인터넷, 소셜 네트워크 서비스, 모 바일 환경에서 실시간 생성되는 웹 문서, 이메일, 소셜 데이터 등 비정형 빅데이터를 효과적으로 분석하는 것이 매우 중요하다. 빅데이터 분석은 데이터 저장소에 저장된 빅데이터 속에서 의미 있는 새로운 상관관계, 패턴, 추세를 발견 하여 새로운 가치를 창출하는 과정이다. 빅데이터 분석 도구인 R 언어를 이용하여 비정형 논문 데이터를 빈도분석을 통해 분석결과를 요약과 시각화하고자 한다. 본 연구에서 사용된 데이터는 한국정보통신학회 학회지 논문 중에서 2021년 1월호-5월호 총 논문 104편을 대상으로 분석하였다. 최종 분석결과 가장 많이 언급된 키워드는 “데이터”가 1,538회로 1위를 차지하였다. 따라서 분석결과를 바탕으로 연구의 한계와 이론적 실무적 시사점을 제시하고자 한다.
ABSTRACT
In the era of big data, not only structured data well organized in databases, but also the Internet, social network services, it is very important to effectively analyze unstructured big data such as web documents, e-mails, and social data generated in real time in mobile environment. Big data analysis is the process of creating new value by discovering meaningful new correlations, patterns, and trends in big data stored in data storage. We intend to summarize and visualize the analysis results through frequency analysis of unstructured article data using R language, a big data analysis tool. The data used in this study was analyzed for total 104 papers in the Mon-May 2021 among the journals of the Korea Institute of Information and Communication Engineering. In the final analysis results, the most frequently mentioned keyword was
“Data”, which ranked first 1,538 times. Therefore, based on the results of the analysis, the limitations of the study and theoretical implications are suggested.
키워드
: 네트워크 분석, 비정형 데이터, 빅데이터, 연관성 분석, 텍스트 마이닝
Keywords
: Network analysis, Unstructured data, Big data, Association analysis, Text mining
Received 15 July 2021, Revised 23 July 2021, Accepted 8 August 2021
* Corresponding Author Chan-Yong Jin (E-mail:[email protected], Tel:+82-63-850-6567) Professor, Division of Information & Electronic Commerce, Wonkwang University, Iksan, 54538 Korea
Open Access
http://doi.org/10.6109/jkiice.2021.25.9.1199
print ISSN: 2234-4772 online ISSN: 2288-4165Ⅰ. INTRODUCTION
Big data analysis refers to a technology which effectively analyzes not only structured data well- organized in databases, but also unstructured data such as web documents, e-mails, and social data generated in the Internet, social network services and mobile environments. Most of the big data analysis technology methods include data mining, machine learning, natural language processing, and pattern recognition used in statistics and computer science. In addition, the development of information communication technology collects large volume unstructured data that occurs in our lives and uses it for future prediction. Recently, the importance of big data technology is being emphasized, and it is being used in various industries. Text mining can be said to be a technology that finds new and useful information in unstructured text data, and processes the unstructured data based on natural language processing technology. Thus, it means to the process of extracting features by changing from unstructured data to structured data through pre-processing.
Sentiment analysis explains the classification of emotions expressed in texts by analyzing opinions, emotions, attitudes, and evaluations on entities and attributes expressed in texts. Sentiment analysis is divided into two main categories. When there is a label in the analysis data, it is called supervised learning, and when there is no label, it is called unsupervised learning [1]. The big data analysis techniques are very varied existence. The R programming language was first introduced in 1995 by Ross Ihaka and Robert Gentleman of the university of Auckland, New Zealand. Based on the open source, it has good interoperability and compatibility with high performance computing speed, data processing capability, and API with Google or Amazon cloud services. R is a language that efficiently provides statistical analysis, data mining, and visualization. In particular, it is attracting attention for the purpose of big data analysis, and more than 5,000 packages support various functions.
Ⅱ. RELATED RESEARCH
Today, in big data analysis research, it can be seen that big data analysis research through various statistical techniques such as data mining, text mining, opinion mining, web mining, and social mining is rapidly increasing. A study of text mining and visualization analysis using the domestic R language is as follows.
First, in the domestic convergence academic research trend analysis [2] using the word cloud technique, Quantitative analysis was conducted to identify trends in convergence research over the past 10 years, the purpose of this study is to extract key-words, apply word cloud techniques, and visualize academic research trends on convergence. And visualization of air pollution data using R software [3], air pollution data are implemented in various methods of graph such as histograms, scatter plots, box plots, 3D scatter plots, perspective diagrams, etc. through data visualization of several methods to determine the effect between ozone concentration and variables.
Next, in the visualization of educational materials
using the big data analysis tool R language [4], the big
data analysis technology was applied to visualize the
educational materials including the contents of elementary
and middle school subjects and to grasp the
characteristics. Also, in a study on word cloud techniques
for unstructured text data analysis [5], problems and
usefulness in the practical application of the word cloud
technique were verified. Next, in the recent consumer
studies research trend analysis [6] using the word cloud
method, quantitative and qualitative analysis were
performed to understand the consumer studies research
trends in the last 10 years. In addition, by applying the
word cloud analysis method using key-words for each
paper, it was attempted to identify consumer research
trends. Finally, it was possible to find previous studies
that analyzed various unstructured data using the R
language.
Ⅲ. RESEARCH METHOD
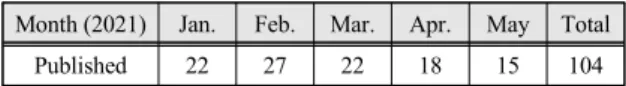
For unstructured data used in this analysis, “Journal of the Korea Institute of Information and Communication Engineering”, the representative domestic information communication technology (ICT) research journal, was selected and the analysis was conducted focusing on the main body of the target thesis. It was judged as an efficient way to look at research trends in the field and summarize the current trends. There are various methods for text data mining and visualization analysis, but R studio tool was used. Based on the frequency of key-words appearance among all words, it was expressed using a word cloud visualization method. As of June 2021, the journal of the Korea institute of information and communication engineering was based on the last 5 months. It was confirmed that there were 104 papers between January and May 2021 during the period, and is shown in Table 1 below.
Table. 1 Articles of published in the JKIICE
Month (2021) Jan. Feb. Mar. Apr. May Total
Published 22 27 22 18 15 104
Unstructured text data in the big data analysis is generally required for pre-processing and refining process for converting a type of data analysis as possible.
Refinement into data suitable for data analysis is very important. If purification is not performed properly, analysis may be impossible or inconsistent results and reliability are compromised. Therefore, the following Fig. 1 shows the analysis process using the unstructured data of this study. For word cloud visualization, the target thesis data were collected from the publication
data reading on the website of the journal of the Korea institute of information and communication engineering.
Based on R language, a script was written using a word cloud function, implemented as shown in Fig. 2 below and the results were analyzed. Next, the papers to be analyzed were manually collected. In addition, basic data papers should be prepared in the form of text data files for word cloud visualization. After performing visually pre-processing in the “notepad” format, the text file is saved by setting “encoding UTF-8” to pass the last sentence to the next line. If these rules are not followed, an error may occur when reading the document file in the R program [5].
Using the prepared text data, we want to display it using the visualization tool provided by R Studio. First, data must be pre-processed and post-processed using a word cloud function corresponding to frequency analysis.
Next, data analysis was performed using the KoNLP package function provided in the R language to extract Korean words from the target thesis data. KoNLP is a package that provides Korean text based morphological analysis and morphological analysis [7]. The function provided in the KoNLP package is a function to extract Korean nouns, and only the noun part is extracted from the target paper using the “extracNoun” function. In addition, data unnecessary for visualization analysis was purified through filtering. And, the filtered data was
Fig. 1 Process for a data analysis Fig. 2 Source cording for data process in the R studio
saved as a text file to extract only nouns with more than two digits [7]. In addition, the results of the top 50 were output as a graph in the form of a word cloud. By the way, if a word is expressed as a node and the relationship between a word and a word is expressed in an edge form, a social network graph can be created, but it is not covered in this study [8, 9].
Next, the script below in Fig. 2 is the code to remove the unnecessary words. In the refining process, the frequency is very high but unnecessary words “Fig”,
“of”, “Table”, “the”, “and”, “10”, “11”, “next”, “one”,
“to”, “below” has been removed. In some cases, when a word occurs, that is high in frequency but does not appear in the word cloud visualization, it may be added to the redefinition dictionary. Also, there may be words that cannot be regarded as core issues because of their high frequency of occurrence. Therefore, the intuition of an expert is essential. In this process, it is easy to extract significant key issues. Then, if the heuristic purification method by the analyst is repeated, the reliability of the extraction of important key issues may be improved [5].
Sometimes the same results may not necessarily be the same. Here, a person in charge of a practical analysis who has sufficient competence to determine non- qualified values with heuristics or an expert with a high understanding of the raw data domain, can provide clear answers to these issues. In big data analysis, the volume and quality of data are also very important factors, but the most important thing is how to massage the data.
Ⅳ. TEXT MINING
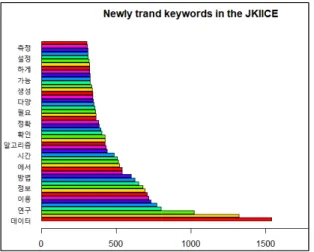
The data used in this study were the 104 papers published from January to May, 2021, among the papers of Journal of the Korea Institute of Information and Communication Engineering. Among the 104 papers, the papers written in English were excluded from the analysis, and the remaining papers were used for the final analysis. First, based on the data extracted using the chart provided in the R language, 50 words from 1st to
50th obtained through frequency analysis were visualized and expressed in the form of a bar graph as shown in Fig. 3. The word with the highest frequency is Data (1,538), which can be seen in the lower part of Fig.
3. And, the word with the lowest frequency is Measure (307), which can be seen at the top of Fig. 3.
Next, Table 2 shows the 30 words and their frequency in the top 1-30 among the words extracted through frequency analysis from the analysis target papers in a Table format. Data (1,538) was in first place, Usage (1,322) was in second place, and Picture (1,021) was in third place. And, fourth place was study (801), fifth place was System (771), and sixth place was Image (730).
Fig. 3 Frequency analysis using word cloud
Table. 2 Frequency of words in the analysis article (1-30) Frequency of words Frequency of words
Data 1538 From 520
Usage 1322 Article 512
Picture 1021 Signal 508
Research 801 Time 486
System 771 Efficiency 440
Image 730 Scheme 433
Using 717 Algorithm 426
Analysis 707 Construct 424
Model 691 Perform 424
Information 679 Confirm 403
Learning 649 Utilize 395
Suggestion 623 Plan 386
Next, Table 3 shows the 20 words and their frequencies in the top 31-50 among the words extracted through frequency analysis from the analysis target paper in a Table format. As a result of the analysis, 31st places were Need (359), 32st place was Environment (356), and 33st place was Input (350). It can be seen that most of the words listed here are words used in the descriptive part of the study. Location (319), Experiment (317), Setup (311), Implement (309), Output (309), and Measure (307) were in the listed respectively.
Table. 3 Frequency of words in the analysis article (31-50) Frequency of words Frequency of words
Need 359 Progress 323
Environment 356 Compare 322
Input 350 With 321
Variety 345 Location 319
Problem 343 Experiment 317
Process 341 Setup 311
Produce 339 Implement 309
Existing 336 Output 309
Calculate 326 Measure 307
Possible 323 Because 304
Most words can be seen as verbs in the description of a sentence. Next, Fig. 4 is a representation of words and
frequencies using a word cloud visualization tool.
The word cloud is a technique which visually shows key words so that words and concepts of the content of the document to be analyzed can be intuitively understood.
For example, the more words are mentioned, the more the meaning can be emphasized. This is a method of expressing words in a large way and showing them intuitively at a glance. Then, it is not easy to understand the relationship or relevance between words as a whole because word cloud is simply to identify repetition of words.
Looking at the final analysis result, the most mentioned word is Data (1,538), and it can be seen that it is located in the middle horizontal of Fig. 4, and it is expressed in the largest font size, so that anyone can know that it is the first word. The second word is Usage (1,322), and it is arranged vertically below the center so that anyone can easily check it. Next, the word in the third place is Picture (1,021), and it was located in the center right of the font with a smaller size than the font in the 2nd place. Next, the fourth word is Research (801), the fifth word is System (771), and the sixth word is Image (730). All six words are expressed in a central position on the word cloud graph, greatly highlighting strength of the visualization tool. In conclusion, we cannot define a word with high frequency as a meaningful word, but the meaning of being mentioned frequently can sometimes have significant meaning.
Ⅴ. CONCLUSIONS
This study is the raw data of Journal of the Korea Institute of Information and Communication Engineering, a leading information communication technology (ICT), using the visualization tool provided by the R language.
The final analysis was performed using the word cloud of R language using the most recent 104 papers from January to May 2021. The analysis results of this study can be concluded as follows.
First, according to the results of word cloud analysis,
Frequency of words Frequency of wordsMethod 601 Accuracy 380
User 537 Technology 364
Apply 537 Occur 362
Fig. 4 Data visualization using word cloud
we can confirm the most mentioned key words are displayed in the center of the graph and in the largest font size. The core of this study is the process of finding new values through data mining based on unstructured data. A word in the Data (1,538) located in the center of the graph be explained a fact or meaning.
Next, the most frequently mentioned words are Usage (1,322) and Picture (1,021), which help explain the overall trend. However, this does not mean that the few words mentioned here are unimportant. Through text mining of this project, it can be recognized which the recent core key-words of the “Journal of the Korea Institute of Information and Communication Engineering”
are Data, Usage, and Picture. In addition, it was confirmed through big data analysis which Research and System are assisting key-words supporting the overall trend. It is not easy to read trends only in this study.
Therefore, research results may vary depending on alternatives to this research method, basic data collection methods, and other analysis techniques. We would like to suggest continuous research is needed to find out more clear trends.
Today, government and companies are trying to find a way to create new value through big data analysis. One of these methods is big data analysis and text mining as an alternative. Perhaps it may be already standing on the central point, not the starting point, in the era of the 4th industrial revolution. The academic contributions and future research directions of this study are as follows. In this study, we decided to only rank the keywords through frequency analysis after classifying only the noun part from the data of the latest 104 papers of the Journal of the Korea Institute of Information and Communication Engineering.
First, in the field of information communication technology, it is the interest of all researchers about which topic the thesis is receiving attention on. Although the raw data used in this study cannot generalize all fields of information communication technology in Korea, it is judged that research trends can be read.
Therefore, it is an academic contribution that keywords
with high frequency in the research results can be defined as recent trends in information communication technology. By the way, there is a limit to research in which the data used for big data analysis cannot be used as all the keywords of Korea information communication technology. Thus, it is necessary to conduct a segmentation study through comparative analysis not only with the basic data used in this study, but also with the data of other conferences.
Second, rather than presenting the results of keyword frequency analysis in fragments, it is also meaningful to look at changes in keywords through continuous research in the future. Finally, it will be possible to study alternative selection further from the keyword frequency analysis related to this study. In addition, the combination of frequency analysis with other techniques and comparative analysis with other competitive methods are directions that should be carried out in the future.
REFERENCES
[ 1 ] H. Kim, S. Kim, and H. Kim, “Crisis Prediction of Regional Industry Ecosystem based on Text Sentiment Analysis Using News Data - Focused on the Automobile Industry in Gwangju-,” International Journal of contents, vol. 20, no. 8, pp. 1-9, Aug. 2020.
[ 2 ] J. Kim, H. Moon, and W. Lee, “A Study on Trend Analysis in Convergence Research Applying Word Cloud in Korea,”
Journal of Digital Convergence, vol. 19, no. 2, pp. 33-38, Feb. 2021.
[ 3 ] Y. Oh and E. Park, “Data visualization of air quality data using R software,” Journal of the Korea Data and Information Science Society, vol. 26, no. 2, pp. 399-408, Feb. 2015.
[ 4 ] Y. Kang, M. Kim, C. Hong S. Kim, and S. Kwon,
“Visualizing Educational Material using a Big Data Analytical Tool R Language,” Asia-pacific Journal of Multimedia Services Convergent with Art, Humanities, and Sociology, vol. 8, no. 3, pp. 915-924, Mar. 2018.
[ 5 ] W. Lee, “A Study on Word Cloud Techniques for Analysis of Unstructured Text Data,” The Journal of the Convergence on Culture Technology, vol. 6, no. 4, pp. 715-720, Nov.
2020.
[ 6 ] E. Lee, K. Chu, and D. Lee, “A Study on Recent Trend Analysis in Consumer Research Applying Word Cloud,”
Journal of Product Research, vol. 37, no. 1, pp. 1-7, Feb.
2019.
[ 7 ] J. Ban, J. Ha, and D. Kim, “Frequency and Social Network Analysis of the Bible Data using Big Data Analytics Tools R,” Journal of the Korea Institute of Information and Communication Engineering, vol. 24, no. 2, pp. 166-171, Feb. 2010.
[ 8 ] J. Huh, “Designing of Image Processing Curriculum Considering Network Security,” Asia-pacific Journal of Multimedia Services Convergent with Art, Humanities, and Sociology, vol. 7, no. 6, pp. 861-869, Jun. 2017.
[ 9 ] S. Kim and S. Choi, “Analyzing the level of resilience by gender in computational thinking classes,” Journal of the Korea Institute of Information and Communication Engineering, vol. 25, no. 2, pp. 252-258, Feb. 2021.
남수태(Soo-Tai Nam)
2009년 부산대학교 일반대학원 석사 2011년 부산대학교 일반대학원 박사수료 2014년 원광대학교 정보관리학 박사
2014년 ~ 2019년 전 원광대학교, 군산대학교, 한밭대학교 초빙교수 및 시간강사 2019년 ~ 현 원광대학교, 부경대학교, 부산대학교 강사
※관심분야 : MIS, Technology Management, Big-Data
신성윤(Seong-Yoon Shin)
1994년 군산대학교 컴퓨터과학 학사 1997년 군산대학교 컴퓨터통신공학 석사 2003년 군산대학교 컴퓨터과학과 박사
2013년 ~ 현 한국정보통신학회 상임이사, 편집위원장, 수석부회장 등 2006년 ~ 현 군산대학교 교수
※관심분야 : Computer Engineering, Multimedia System
진찬용(Chan-Yong Jin)
1984년 고려대학교 경영학 학사 1987년 한국과학기술원 경영과학 석사 1990년 한국과학기술원 경영과학 박사수료 2009년 서남대학교 경영정보학 박사 2014년 ~ 2015년 UCLA, visiting scholar 1990년 ~ 현 원광대학교 교수
※관심분야 : MIS, E-Business, Venture Start-Up, Big-Data