Random Forest를 이용한 남한지역 쌀 수량 예측 연구
김준환1*⋅이주석2⋅상완규1⋅신평1⋅조현숙1⋅서명철1*1)
1농촌진흥청 국립식량과학원 작물재배생리과, 2한국생명공학연구원 바이오평가 센터
(2019년 5월 26일 접수; 2019년 6월 10일 수정; 2019년 6월 17일 수락)
Rice yield prediction in South Korea by using random forest
Junhwan Kim
1*, Juseok Lee
2, Wangyu Sang
1, Pyeong Shin
1, Hyeounsuk Cho
1, Myungchul Seo
11
Divison of Crop Physiology and Production, National Institute of Crop Science, Rural Development Administration, Wanju-Gun, Jeollabuk-do, Republic of Korea
2
Bio-Evaluation Center, Korea Research Institute of Bioscience and Biotechnology, Cheongju-si, Chungcheongbuk-do, Republic of Korea
(Received May 26, 2019; Revised June 10, 2019; Accepted June 17, 2019)
ABSTRACT
In this study, the random forest approach was used to predict the national mean rice yield of South Korea by using mean climatic factors at a national scale. A random forest model that used monthly climate variable and year as an important predictor in predicting crop yield.
Annual yield change would be affected by technical improvement for crop management as well as climate. Year as prediction factor represent technical improvement. Thus, it is likely that the variables of importance identified for the random forest model could result in a large error in prediction of rice yield in practice. It was also found that elimination of the trend of yield data resulted in reasonable accuracy in prediction of yield using the random forest model. For example, yield prediction using the training set (data obtained from 1991 to 2005) had a relatively high degree of agreement statistics. Although the degree of agreement statistics for yield prediction for the test set (2006-2015) was not as good as those for the training set, the value of relative root mean square error (RRMSE) was less than 5%. In the variable importance plot, significant difference was noted in the importance of climate factors between the training and test sets. This difference could be attributed to the shifting of the transplanting date, which might have affected the growing season. This suggested that acceptable yield prediction could be achieved using random forest, when the data set included consistent planting or transplanting dates in the predicted area.
Key words: Random forest, Rice yield, Yield prediction, Empirical
I. Introduction
Precise pre-harvest prediction of crop yield is very important for both commercial and public sectors.
Thus, each country needs to establish a national food security policy. The agriculture and food industries also need to analyze the global food supply and demand in order to ensure stable resource management.
* Corresponding Author : Junhwan Kim ([email protected])
DOI: 10.5532/KJAFM.2019.21.2.75
ⓒ Author(s) 2019. CC Attribution 3.0 License.
Various crop yield forecasting methods have been developed to address these social needs (Baruth et
al., 2005; Basso et al., 2013). Yield forecasting
methods include statistical models, crop growth models, and remote sensing approach. Statistical models are traditional regression models that have long been used to predict crop yield. They evaluate the relationship between climate factors and crop yield by using regression and develop equations to predict crop yield (Landau et al., 2000; Lobell et al., 2010; Ray et al., 2015). Statistical models require sufficient long-term data from numerous local sites as training or calibration sets. The crop growth models are process-oriented models that require many input factors for precise prediction and can simulate crop growth processes and yield (Boote et al., 1996;Kim et al., 2012). Occasionally, an intensive input factor is a major hindrance for the application of crop growth models. Remote sensing has been developed and widely used over the last decades (Knipling et
al., 1970; Tucker et al., 1981; Moran et al., 1994;
Wardlow et al., 2008). It can monitor the status of crops in large areas and analyze the data; however, obtaining data from a required area by using this approach is not always possible. The advantage of statistical models is that the information n required is less and the approach is cost-effective, unlike other forecasting methods. Recently, random forest, one of the ensemble machine-learning techniques, was adopted for crop yield prediction; it showed promising results over the traditional regression models (Jeong et al., 2016). This method successfully improved crop yield prediction over various locations by using soil and cultivation information as well as climatic factors as input data. However, in practical prediction, obtaining required information in the intact form is difficult, for example, specific local climate data corresponding to crop yield of a specific local area.
Rice is the most important crop in South Korea, and its yield prediction is essentially required for both the government to establish agriculture policies and farmers to manage their business. Crop yield
forecasting by using the random forest method requires regional climate data and cultivation information from every rice field. Further, it is associated with two issues: limitation of input data and temporal yield trend. First, since specific regional climate data are not available for most rice fields in South Korea, the rice yield prediction should be evaluated using the nationwide average yield and nationwide averaged climate data. Second, the random forest approach predicts yield by determining the relationship between variation in climate and crop yield. When temporal yield trend is caused by technical improvements instead of climate variations, such as genetic improvement and pesticide or herbicide application, the underlying assumption of crop yield prediction might not hold true and lead to a biased conclusion or mislead the result interpretation. Year has been reported to be the most influential predictor variable for yield prediction in random forest and reflected the yield trend (Jeong
et al., 2016). However, yield prediction has to be
conducted every year, and the future trend needs to be assumed to be the same as the past evaluated trend.In this study, we evaluated the performance of random forest to predict the average rice yield by using average climate factors in South Korea. Further, we addressed the temporal yield trend issues to improve the practical prediction using random forest.
II. Materials and Methods
2.1. Rice yield and climate data in South Korea
The national average of milled rice yield data over 25 years from 1991 to 2015 was obtained from the Korean Statistical Information Service (www.kosis.kr). Climate data included minimum, mean, and maximum temperatures and sunshine hour, which were obtained from the Korea Meteorological Administration (www.kma.go.kr/weather/climate/past_table.jsp); for 54 sites, sunshine hour was recorded for more than 30 years (Lee et
al., 2011). Precipitation was not included as a
climatic factor in this study, because rice fields inSouth Korea are equipped with irrigation systems, and about 80.6% of rice fields are well irrigated (www.index.go.kr/potal/info/idxKoreaView.do?idx_
Cd=1287). Furthermore, the total precipitation ranged from 1030 to 1900 mm, and most rainfall was distributed in the summer season.
2.2. Random forest predictions
The random forest is an ensemble technique based on a combination of a large decision tree (Breiman
et al., 2001). Individual decision trees for prediction
in random forest are trained by randomly selecting candidate variables, i.e., predictors, from the training data set. The final prediction in random forest is the average of predictions from individual decision trees.In this study, the random forest prediction was conducted using the statistical program R v2.15.3 with ‘Random Forest’ package.
2.3. Yield prediction using mean yield and climate data
Three climate factors including monthly maximum/
minimum temperature and sunshine hour per month- were averaged over 54 sites, which were used as predictors of a random forest. In this evaluation, year was also included as a predictor. The number of ensemble for the random forest was 300. Year was also used as a predictor for the random forest as Jeong et al.(2016) suggested. Data for 15 years from 1991 to 2005 were used for the random forest prediction.
2.4. Yield prediction using detrended yield data
Previous report showed the successful prediction by including the observation year as social and technical factors, such as developing cultivars or cultivation (Jeong et al., 2016). However, in this study, the trend induced by technical improvement was removed to predict the yield by using only climate data. The moving average was used to remove the trend; moving averages of 3, 5, and 10 years were applied, and an optimum moving averagewas selected for further analysis. The trend-removed yield, (Eq. 1), was used for random forest prediction instead of the observed yield, . Thus, the predicted yield was obtained as Eq. 2.
(Eq. 1)
(Eq. 2)
where Yieldn represents the observed yield of year of n, and MAn-1 is the moving average up to year
n - 1. Briefly,
was obtained using the random forest prediction from the relationship between climate data and trend-removed yield, (Eq.1). Moving average (MAn-1) was added to convert to predicted yield, (Eq. 2). Data obtained from 1991 to 2005 were used as the training set, and those obtained from 2006 to 2015 were used as model test set.
2.5. Evaluation of random forest performance in rice yield prediction
Three statistical methods, which are commonly used as measures for agricultural system and crop models, were used to evaluate the random forest performance in this study (Knipling et al., 1970; Kim
et al., 2012). These are relative root mean square
error (RRMSE, Eq. 3) (Loague et al., 1991), Nash–Sutcliffe model efficiency (EF, Eq. 4) (Nash et al., 1970), and index of agreement (d, Eq. 5) (Willmott
et al., 1981).
(Eq. 3)
(Eq. 4)
(Eq. 5)
where, O represents observation, P is the predictions, and
is the observation mean in the dataset. RRMSEis a measure of deviation between observed and model prediction. EF is used to evaluate the predictive power by comparing with the observed mean. Willmott’s d indicates the agreement between the observed and predicted data. The model performance was visualized by generating the observed vs. predicted variable importance plots.
III. Results and Discussion
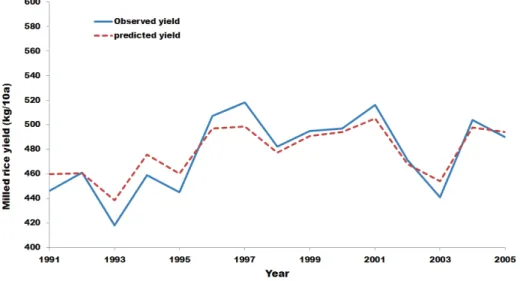
The national mean rice yield prediction results are shown in Figures 1 and 2. The results showed that the predicted values were significantly close to the observed ones, even though the national mean climatic factors were very limited data with significant information losses (Fig. 1 and Fig. 2).
RRMSE was as low as 2.4%, and EF was 0.94, suggesting the high efficiency of the model.
Willmott’s agreement index, d, was also close 1, which indicated good agreement between predicted and observed yields. In the time series data, predicted and observed yields showed a good agreement (Fig.
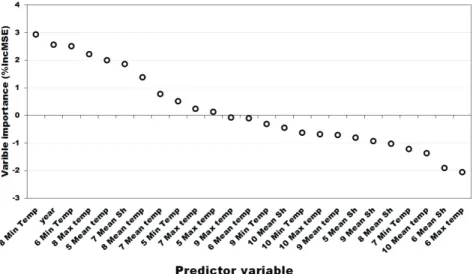
2). However, this significant agreement might not show actual cause-and-effect relationship. To address this issue, we generated the variable importance plot to evaluate the importance of each predictor (Fig. 3).
The evaluation results suggested that the minimum temperature in August, year, minimum temperature in June, maximum temperature in August, and mean temperature in May were the important predictors (Fig. 3). The climate condition of the reproductive period is more important than that of the vegetative period in South Korea (Yun et al., 2013). Therefore, the temperature of August was reliable as an important predictor.
Fig. 1. Performance of Random forest in national
mean rice yield of South Korea with train data (1991-2005).Fig. 2. Time series comparison between observed rice yield and predicted rice yield in South Korea from
1991 to 2005.However, sunshine hour of August and September were less important predictors compared to that of other seasons. This was not in agreement with the findings of empirical research (Yun et al., 2013).
Moreover, the partial dependence plot with year as the variable showed that milled rice yield in South Korea was remarkably increased between 1995 and 1998 (Fig. 4). However, this increase in yield for the 3 years could not be explained by the technical or
social factors. Even though random forest showed good prediction performance, this model could not be applied to practical prediction because of insufficient reasonable explanation for the relationship between predictor and yield.
Improvement of the reliability of random forest prediction required that the trend in time series data should be removed. The commonly used detrend method involves the application of the moving
Fig. 3. Variable importance plot from Random Forest in rice prediction with train data (1991-2005). Max
temp: Monthly mean temperature, Mean temp: Monthly mean temperature, Min temp: Monthly minimum temperature, Mean sh: Monthly mean sunshine hour. %IncMSE: mean square error, the higher %IncMSE is more important.Fig. 4. Partial dependence plots for the top ranked predictor variable, year, from variable importance measures
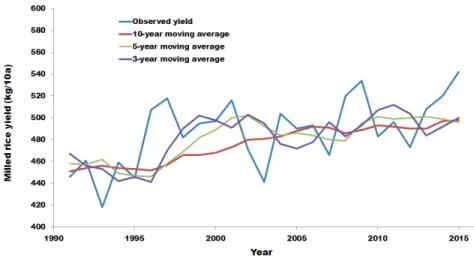
of Random Forests models with train data (1991-2005).average. The optimum moving average was selected by conducting random forest prediction by using 3 moving averages: obtained over 3, 5, and 10 years.
Each trend line of moving average is shown in Figure 5, and the statistical comparisons after detrending are shown in Table 1. The results indicated that the moving average of 3-, 5-, and 10-year data showed similar performance. Thus, these moving averages could be used for yield prediction. However, the moving average of 10 years was more suitable because of smoothing without fluctuation (Fig. 5).
The social and technical factors were considered in the trend line. If these are not considered, yield change could be expected by only climate factors, and more precise information regarding the relationship between climate factors and rice yield could be obtained.
Moving average
RRMSE
(%) EF
d
10-year 2.5 0.84 0.95
5-year 2.8 0.80 0.93
3-year 2.4 0.85 0.94
Table 1. Comparison of model predictive performance
when trend is removed by using the moving averageThe variable importance plot from random forest prediction after detrending yield data is shown in Figure 6. The maximum and average temperatures in August, the maximum temperature in September, and the mean sunshine hour in July were high-ranked values. Moreover, the sunshine hour in September and August was in a higher position than that shown in Figure 3. In Korea, August and September correspond to the heading and grain filling periods, respectively, and climate conditions in these months are more important than those in other seasons in South Korea for rice yield (Yun et al., 2013). Thus, random forest with detrended yield data could be more reliable for further prediction.
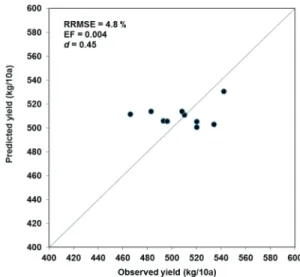
Rice yield prediction with random forest after detrending yield data was validated using the remnant set (from 2006 to 2015) as the test set (Fig. 7 and Fig. 8). Interestingly, the prediction of test set was significantly different from that of the observed yield.
The model efficiency parameter, EF was 0.004, and Willmott’s d was also only 0.45 (Fig. 7). In the training set, random forest prediction with climate factor after detrending rice yield was found to be an empirically reasonable approach. However, validation with test set revealed that the accurate rice yield prediction with random forest could not be achieved using the previously described approach.
Fig. 5. Observed yield and 10-year moving average, 5-year moving average and
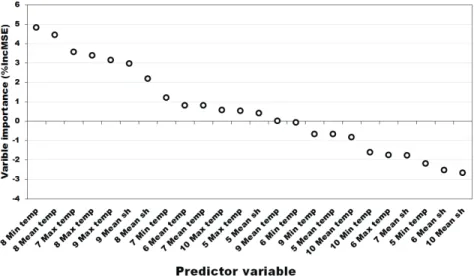
3-year moving average of National mean yield in South Korea.The reason for the low prediction performance in the test set was determined by obtaining and comparing the variable importance plots of the training set (1991-2005) and test set (2006-2015; Fig. 9).
The importance of each variable was significantly different. The important climatic factors in the training set were sunshine hour in July, mean/maximum temperature in August, and maximum temperature in September. However, minimum temperature in
August and September and sunshine hour in October were important in the test set. This difference can be explained by several reasons. First, this might be caused by the insufficient removal of trend biases in the time series data. Various subspecies could cause response fluctuation in climatic factors, since two subspecies of rice, japonica and indica-japonica hybrid, are cultivated at the same time in South Korea, and their response to climate would be
Fig. 6. Variable importance plot from Random Forest in yield fluctuation prediction with detrended train
data(1991-2005). Max temp: Monthly mean temperature, Mean temp: Monthly mean temperature, Min temp:Monthly minimum temperature, Mean sh : Monthly mean sunshine hour. %IncMSE: mean square error, the higher %IncMSE is more important.
Fig. 7. Time series comparison between observed rice yield and predicted rice yield in South Korea with
train data (1991-2005) and test data (2006-2015).different (Ahn, 1973). However, japonica rice has been dominantly cultivated since the 1980’s.
Therefore, various responses to climatic factors by the different subspecies were not expected. Another reason for rice response changes to climatic conditions could be the moving of rice cropping season by climate changes. Since 2006, Rural Development Administration (RDA) in South Korea recommended farmers to delay the rice transplanting date up to maximum of 15 days according to the sites.
If the recommended transplanting date of RDA was generalized among farmers, the difference in the
importance of these variables between the training and test sets could be explained. A previous study showed successful yield prediction by using the random forest approach at various sites and in different crops, because they used the data from sites with consistent conditions, for example, planting date (Jeong et al., 2016). If the cultivation conditions such as planting or transplanting date were changed, precise prediction could be obtained only from specific time periods having consistent condition.
Therefore, even if local climate data and local yield data are available, predicting yield using random forest would be difficult when the seeding date is not constant.
In this study, the prediction performance with random forest was evaluated to predict the national mean milled rice yield by using the national mean climatic factors. This approach was improved by systematically eliminating the trend of time series data. Although a previous study (Jeong et al., 2016) showed successful prediction by using random forest for various sites and crops, our results were not in agreement those results. The results of variable importance plot in this study showed significant difference in the importance of climate factors between the training and test sets. This could be because of the change in the transplanting date, which might affect the growing season and yield. Thus, acceptable prediction could be achieved when the
Fig. 8. Performance of Random forest in national
mean rice yield of South Korea with test year (2006-2015).
Fig. 9. Variable importance comparison between train set (1991-2005) and test set (2006-2016).
data set with consistent planting or transplanting date was used.
적 요
이 연구의 목적은 random forest 를 활용하여 기상 요소만을 이용하여 우리나라 전체의 벼 평균수량을 예 측하는데 있다. Random forest 는 예측에 사용되는 각 predictor variable 을 분리할 수 있는데 이를 통해 분리 된 시계열 상의 추세가 비정상적인 증가형태를 보였
다. 이는 결국 예측능력의 저하로 이어지기 때문에 이
를 제거할 필요가 있고 본 연구에서는 이동 평균을 이용하여 제거한 후 예측을 하였다. 1991 년부터 2005 년까지의 기상자료와 수량자료를 학습에 사용하 였고 2006 년부터 2015 년까지의 자료들을 검증용으
로 사용하였다. 학습자료에 대해서는 상당히 정확한
예측 능력을 보여주었으나 검증 자료에서는 그렇지 못
하였다. 그 이유를 분석하기 위해 학습 자료와 검증
자료에 대해서 각각 변수 중요도를 산출하여 비교한 결과 두 자료 간에 월별 기상 자료에 대한 중요도가
변동되었음을 발견하였다. 이러하 차이가 발생한 이유
는 학습자료와 검증 자료에서의 전국적으로 표준이앙 기가 이동하여 벼의 생육기간 자체가 변하였기 때문이 다. 따라서, 정확한 예측을 위해서는 지역별 파종기 또는 이앙기에 대한 자료가 필요하며 단순히 기상 자 료만을 활용한 예측은 어려운 것으로 생긱된다.
Acknowledgment
This study was supported by a Cooperative Research Program for Agricultural Science and Technology Development of Rural Development Administration (Project No. PJ0101152017).
REFERENCES
Ahn, A. B., 1973: Studies on the varietal difference in the physiology of ripening in rice with special reference to raising the percentage of ripened grains. Korean Journal of Crop Science 14, 1-40.
Baruth, B., A. Royer, A. Klisch, and G. Genovese, 2008: The use of remote sensing within the mars crop yield monitoring system of the european commission. The International Archives of Photo-
grammetry Remote Sensing and Spatial Information Sciences, 37, 935-940.
Basso, B., D. Cammarano, and E. Carfagna, 2013:
Review of crop yield forecasting methods and early warning systems. In: Proceedings of the
First Meeting of the Scientific Advisory Committee of the Global Strategy to Improve Agricultural and Rural Statistics, FAO Headquarters, Rome,
Italy, 18-19.Boote, K. J., J. W. Jones, and N. B. Pickering, 1996: Potential uses and limitations of crop models.
Agronomy Journal 88(5), 704-716.
Breiman, L., 2001: Random Forest. Machine Learning
45, 5-32.
Jeong, J. H., J. P. Resop, N. D. Mueller, D. H.
Fleisher, K. Yun, E. E. Butler, D. J. Timlin, K.
M. Shim, J. S. Gerber, V. R. Reddy, and S. H.
Kim,2016: Random forests for global and regional crop yield predictions. PLoS One 11(6):e0156571.
doi:10.1371/journal.pone. 0156571.
Kim, J., C. K. Lee, J. Shon, K. J. Choi, and Y.
Yoon, 2012: Comparison of statistic methods for evaluating crop model performance. Korean Journal
of Agricultrual and Forest Meteorology 14(4),
269-276.Knipling, E. B., 1970: Physical and physiological basis for the reflectance of visible and near-infrared radiation from vegetation. Remote Sensing of Environ-
ment 1(3), 155-159.
KOSIS (Korean Statistical Information Service):
www.kosis.kr
KMA (Korea Meteorological Administration):
www.kma.go.kr/weather/climate/past_table.jsp.
K-indicator: www.index.go.kr/potal/info/idxKoreaView.
do?idx_Cd=1287.
Kim, S. H., Y. Yang, T. J. Dennis, D. H. Fleisher, A. Dathe, V. R. Reddy, and K. Staver, 2012:
Modeling temperature responses of leaf growth, development, and biomass in maize with MAIZSIM. Agronomy Journal 104(6), 1523-1537.
Landau, S., RAC Mitchell, V. Barnett, J. Colls, J.
Craigon, R. W. Payne, 2000: A parsimonious, multiple-regression model of wheat yield response to environment. Agricultural and Forest Meteorology
101(2-3), 151-166.
Lee, C. K., K. S. Kwak, J. H. Kim, J. Y. Son, and W. H. Yang, 2011: Impacts of climate change and follow-up cropping season shift on growing period and temperature in different rice maturity types. Korean Journal of Crop Science 56(3), 233-243.
Loague, K., and R. E. Green, 1991: Statistical and graphical methods for evaluating solute transport models: Overview and application. Journal of
Contaminant Hydrology 7(1), 51-73.
Lobell, D. B., and M. B. Burke, 2010: On the use of statistical models to predict crop yield responses to climate change. Agricultural and Forest Meteor-
ology 150(11), 1443-1452.
Moran, M. S., T. R. Clarke, Y. Inoue, and A. Vidal, 1994: Estimating crop water deficit using the relation between surface-air temperature and spectral vegetation index. Remote Sensing of Environment
49, 246-263.
Nash, J. E., and J. V. Sutcliffe, 1970: River flow forecasting through conceptual models part I - A discussion of principles. Journal of Hydrology
10(3), 282-290.
Ray, D. K., J. S. Gerber, G. K. MacDonald, and P.
C. West, 2015: Climate variation explains a third of
global crop yield variability. Nature Communications
6, 5989. doi:http://doi.org/10.1038/ncomms6989.
Tucker, C. J., B. N. Holben, J. H. Elgin, and J. E.
McMurtrey., 1981: Remote sensing of total dry-matter accumulation in winter wheat. Remote
Sensing of Environment 11, 171-189.
Wardlow, B. D., and S. L. Egbert, 2008: Large-area crop mapping using time-series MODIS 250 m NDVI data: An assessment for the U.S. Central Great Plains. Remote Sensing of Environment
112(3), 1096-1116.
Willmott, C. J., 1981: On the validation of models.
Physical Geography 2(2), 184-194.
Yun, Y. H., C. K. Lee, J. Y. Shon, J. H. Kim, K.
J. Choi, and J. K. Kim, 2013: Analysis of current climate effect on rice yield in South Korea.