Corresponding author: Myung Hwa Ha, Department of Preventive Medi- cine, Ewha Wonans University School of Medicine, 911-1, Mock 6-dong Yangchun-gu, Seoul 405-760, Korea Tel: +82-2-2650-5824, E-mail: [email protected] Received April 13, 2010, Revised May 30, 2010
Accepted June 10, 2010
The Influence of Stress on the Change of Health Behavior among Industrial Workers: A 4-Year Follow-up Study
*Medical Informatics, Graduate School of Public Health, Gachon University of Medicine and Science, Inchon,
†
Seoul National University, Biomedical Informatics (SNUBI), Seoul National University College of Medicine,
‡
Department of Preventive Medicine, Ewha Womans University School of Medicine, Seoul, Korea
Hwa Jeong Seo*, Hye Hyeon Kim
†, Myung Hwa Ha
‡The purpose of this study is to see if stress affects health behavior risk factors such as smoking, drinking, exercise and obesity.
Periodic medical examinations of the workers were performed and a survey of self-answered questionnaire - medicalhistories, histories of smoking, drinking and physical activity with calculating BMI (Body Mass Index) - were conducted both in 1999 and 2002 to 7,471 male workers. We utilized a measuring tool for stress; PWI (Psychological Wellbeing Index) which is a reduced form of GHO-60 (The General Health Questionnaire). It has 5 stress levels with 4 specific factors, i.e., social performance and self-confidence, depression and so on. Type A Behavior Pattern (TABP) is formed with results by 19 questionnaire of social personality type. Higher average age was observed in lower PWI and lower average pack-years of smoking and alcohol consumption with its frequency were observed in the lower PWI, and higher frequency of exercise and BMI were observed in higher PWI. During the 4-year period, the rate for smoking cessation was lower compared to the score for stress which was higher and a higher frequency of regular exercise was observed in lower PWI. The proportion of TABP was higher in higher PWI, but the proportion of Type B behavior pattern was decreased in 2002. Levels of stress appear to be closely related to health behavior.
As the score for PWI increases, the proportion for improper health behaviors tended to be higher and the rate of change to the good health behavior was lower. (Korean J Str Res 2010;18:87∼97)
Key Words: Decision support system, Health behavior factors, Psychological Wellbeing Index (PWI), Body Mass Index (BMI), Sleeplessness
INTRODUCTION
Stress is a personal response to external psychological and phy- sical demands and is known to be related to various diseases in-
cluding cardiovascular disease (Hwang CK et al., 2007; Yoon HS
et al., 2007). When the degree of stress becomes higher people
tend to have more unhealthy behavior which finally could cause
cardiovascular diseases (Koh SB, 2002; Laitinen et al., 2002; Park
JK et al., 2005). The relationship between stress and
cardiovascular disease is generally explained in that stress affects
not only the cardiovascular systems but also the endocrine
systems. Stress affects the human body directly and affects
indirectly improper health behaviors. These combined factors can
cause diseases. Psychosocial characteristics have been linked to
coronary heart disease in large Belgian occupational cohort study, the independent role of perceived job stress on the short-term incidence of coronary events were examined and showed asso- ciation with the social support scale independently of other risk factors (Cherry et al., 2006).
Influence of stress can appear as physical symptoms or some- times as mental illnesses. Physical symptoms caused by stress have been observed in some studies (E van der et al., 2003; Chen WQ et al., 2005) and the relationship between stress and mental illnesses have been investigated in workers (Cha BS et al., 1989;
Chen WQ et al., 2005; Cherry et al., 2006). Studies were done about the relationship between life style and health status (Molarius et al., 2007; van den Berg et al., 2008), and about the relationship between health behavior risk factors and stress (Laitinen et al., 2002; Park JK et al., 2005). Research on evaluating degrees of stress on life style and behavior reaction have been done before (Kang MK et al., 2007; Molarius A et al., 2007; Van den berg et al., 2008), and recently a study for behavior reaction according to the degree of stress was done (Yoon HS et al., 2007).
A study showing the relation between unhealthy eating beha- vior and stress was performed. It showed that unhealthy eating behavior was used as a coping mechanism in stressful situations in school-age children and could induce obesity (Goldberg, 1978;
Chang SJ, 1993; Chang SJ, 2000). Smoking and alcohol are known to influence the waist/hip circumference ratio (WHR), symptoms of depression and anxiety, sleep disturbances, psychoso- matic disease as well as psychosomatic symptoms and dissatisfac- tion which were proved to be related to WHR. It was hypothe- sized that the mechanism involved might be increased secretion of cortisol directing storage of fat to the central adipose tissue deposits (Chang SJ, 1993; Rosmond et al., 1996).
Stress can be grouped into 3 categories: factors for stress, response to stress and related mediating factors (Park JS et al., 2004). Different ways of measuring stress for the different categories should be applied. The category of factors for stress include job requirements, unstable work, social support by one’s superior and peers, Type A behavior pattern (TABP) and recent experience or events in one’s life. These can be measured by JCQ (Job Content Questionnaire). Response to stress can be classified into psychological, physical and behavior pattern. It can be
recognized by subjective symptoms as anxiety, strain, anger, palpitation, fatigue and sleeplessness. It also can be recognized by behavioral responses and factors such as smoking and drinking, and therefore, it induces endocrine and vascular circulatory changes. There is GHQ (General Health Questionnaire) and its reduced form of PWI (Psychological Wellbeing Index) (Chang SJ, 1993; Rosmond, 1996) which is a measurement tool for evaluating total health status. GHQ besides evaluating individual target symptoms and syndromes and TABPs can also measure mediating factors for stress. People with TABP do not become impatient when they are faced with a special situation, become offensive and have a feeling of urgency and have a strong motivation for achievement. In analyzing the influence of stress on health behavior, it was necessary to take into account a TABP (Haynes et al., 1978; Rosenman et al., 1996; Park JS et al., 2004).
The aim of this study is to see if stress affects health behavior risk factors such as smoking, drinking, lack of exercise and obesity, and whether stress influences the change of these health behavior risk factors after 4 years of follow up among industrial workers. In this study as a measuring tool for stress, PWI was used to evaluate levels of stress and its relation to health indices.
Total score of PWI and its 4 factors, i.e., social performance and self-confidence, depression, sleeping disturbance and anxiety and general well-being and vitality were used as independent variables and health behavior reaction such as smoking, drinking, exercise and BMI were used as dependent variables. In the analysis, PWI scores were adjusted for TABP to exclude the effect of Type behavior patterns.
MATERIALS AND METHODS
This study is performed to see the relationship between the
degree of stress and health behavior such as histories of smoking,
drinking, exercise and obesity in industrial workers. First, a study
of 7,471 workers employed in a manufacturing plant between
1999 and 2002 given a questionnaire asking about health
behavior and stress from the examinees of periodic medical
examinations was performed. Second, medical histories, histories of
smoking, drinking and exercise and BMI were calculated. Third,
total scores of stress and scores of stress of four factors, i.e., social
performance and self-confidence, depression, sleeping disturbance
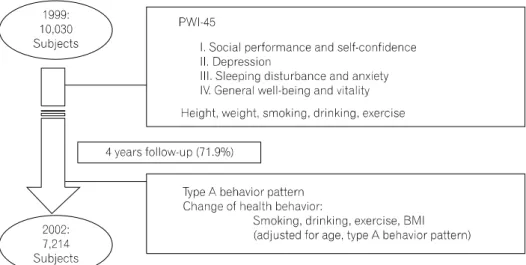
Fig. 1. Study subjects, measurement of stress and questionnaire inclu- ded in the analysis.
and anxiety and general well-being and vitality, were examined.
And the relationship between levels of stress and health behavior and change of health behavior according the levels of stress were evaluated.
1. Subjects
10,030 workers from a manufacturing factory in P city who took medical examination in 1999 were followed up for 4 years and 7,214 workers who took periodic medical examinations both in 1999 and 2002 were included in the final analysis. They were all male and engaged in the production line.
During this period, an active health promotion program was promoted among the workers to induce smoking cessation, moderation in alcohol consumption and regular exercise with weight control (Fig. 1).
2. Self-answered Questionnaire About Health Behavior
Both in 1999 and 2002 subjects were asked by a self-answered questionnaire about medical history and health behavior including smoking, drinking, and exercise. BMI for both years were calcula- ted using heights and weights of subjects.
3. Tools for Measuring Stress
PWI-45 Psychosocial Well-being Index which was revised from the GHQ-60 (General Health Questionnaire) developed by Goldberg was used to measure socio-psychological stress of
workers in 1999 (Bortner, 1969; Goldberg, 1978; Jenkins et al., 2005). PWI with 4 factors, i.e., social performance and self-confidence, depression, sleeping disturbance and anxiety and general well-being and vitality were considered, and they were grouped into quartiles. Cronbach’s α which shows internal reli- ability coefficients for PWI and its 4 factors were 0.761, 0.717, 0.767, 0.794 and 0.775, respectively. Type A Behavior Pattern (TABP) was evaluated in 2002 using 10 items of the Fra- mingham TABP. People tend to have TABP with higher total score. In this study people with total score higher than its mean value were defined as TABP and those with total score lower than its mean value were defined as Type B behavior pattern.
Cronbach’s α which means internal reliability of TABP was 0.803.
4. Statistical Analysis
The total scores for PWI and its four factors, i.e., social per-
formance and self-confidence, depression, sleeping disturbance and
anxiety and general well-being and vitality, were grouped into
quintiles, i.e., total scores for PWI was categorized into five
groups, i.e., <18, 18∼28, 28∼40, 41∼51 and ≥52. The 4
factors for PWI, first, the factor of social performance and
self-confidence scores were categorized into <5, 5∼11, 12∼16,
17∼22, ≥23, second, for the factor of depression the scores of
stress are categorized into <2, 2∼5, 6∼8, 9∼11, ≥12, third,
for the factor of sleeping disturbance and anxiety the scores of
stress are categorized into <3, 3∼4, 5∼6, 7∼9, ≥10 and
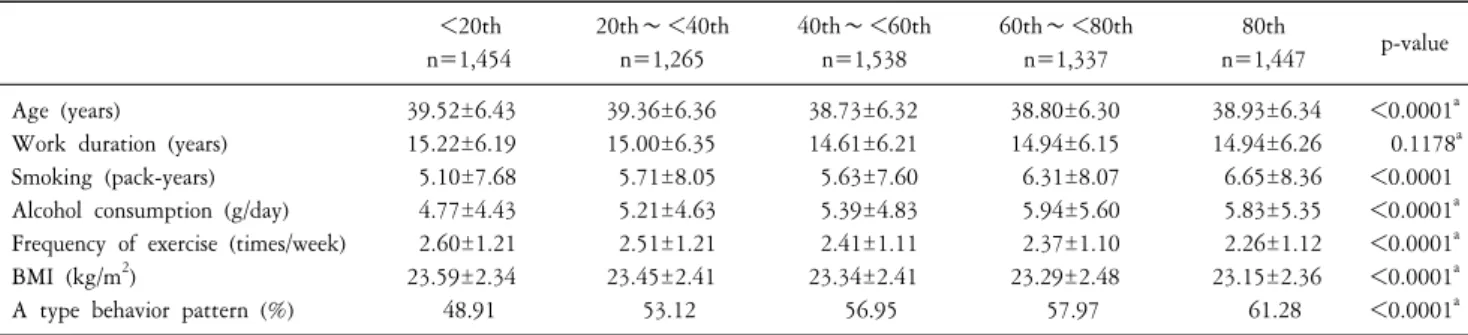
Table 1. General characteristics and health behavior factors of subjects in 1999 and Type A behavior pattern surveyed in 2002 according to the quintiles of total scores of PWI.
<20th n=1,454
20th∼<40th n=1,265
40th∼<60th n=1,538
60th∼<80th n=1,337
80th
n=1,447 p-value Age (years)
Work duration (years) Smoking (pack-years) Alcohol consumption (g/day) Frequency of exercise (times/week) BMI (kg/m
2)
A type behavior pattern (%)
39.52±6.43 15.22±6.19 5.10±7.68 4.77±4.43 2.60±1.21 23.59±2.34 48.91
39.36±6.36 15.00±6.35 5.71±8.05 5.21±4.63 2.51±1.21 23.45±2.41 53.12
38.73±6.32 14.61±6.21 5.63±7.60 5.39±4.83 2.41±1.11 23.34±2.41 56.95
38.80±6.30 14.94±6.15 6.31±8.07 5.94±5.60 2.37±1.10 23.29±2.48 57.97
38.93±6.34 14.94±6.26 6.65±8.36 5.83±5.35 2.26±1.12 23.15±2.36 61.28
<0.0001
a0.1178
a<0.0001
<0.0001
a<0.0001
a<0.0001
a<0.0001
aa
p-values were based on one-way analysis of variances.
fourth, for the factor of general well-being and vitality the scores of stress are categorized into <3, 3∼5, 6∼7, 8∼10, ≥11.
The following data was collected in 1999: the mean age, work duration, pack years of smoking obtained by number of packs of cigarettes smoked per day multiplied by years of smoking, grams of alcohol consumption were calculated, and the number of current smokers, current drinker, people who did regular exercise and TABP were obtained according to the quintiles for the scores for PWI. Analysis of variance and Chi-square test were used to see if there was any statistical significance between the different groups.
Means for variables related to health behavior such as age, pack years of cigarette smoking, alcohol consumption per day and frequency of exercise according to the total scores for PWI and its four factors were evaluated by a generalized linear model adjusting for age and TABP.
Change in health behaviors after the 4-year follow-up study was evaluated. The following variables were evaluated: the number of people who had quit smoking by 2002 from among the smokers in 1999, the number of people who reduced their alcohol consumption by 2002 from among the drinkers who drank more than the average alcohol consumption per day among the drinkers in 1999, the number of people whose BMI was less than 23 in 2002 from among the people with a BMI higher than 23 in 1999 and the people who changed to having regular exercise more than 3 times per week in 2002 from among those who did not exercise or did irregular exercise in 1999. Odds ratio and confidence interval were calculated for these variables related to health behavior according to the quintiles of total scores for
PWI and its 4 factors.
RESULTS
General characteristics and health behavior risk factors of subjects according to the quintiles for PWI and its 4 factors were observed (Table 1).
Higher average age was observed in lower quintiles for PWI (p<0.0001). Lower average pack-years of smoking and alcohol consumption were observed in the lower quintiles for PWI (p
<0.0001) and higher frequency of exercise and BMI were observed in higher quintiles for PWI (p<0.0001). Statistical means for work duration did not show any statistical significance between the different groups. A higher proportion of people with A type behavior pattern was evident in the higher quintiles for PWI (p<0.0001).
Table 2 shows the comparison for the average means for health behavior factors surveyed in 1999 according to the quintiles of Total PWI Scores and its 4 factors of PWI.
Higher average age was observed in lower quintiles of PWI (p=0.0324) and with sleeping disturbance and anxiety factors (p
<0.0001). Higher pack-years of smoking and alcohol consump- tion were observed in the lower quintiles of PWI and its 4 factors (p<0.0001) and higher frequency of exercise and BMI were ob- served in higher quintiles of PWI and its 4 factors (p<0.0001).
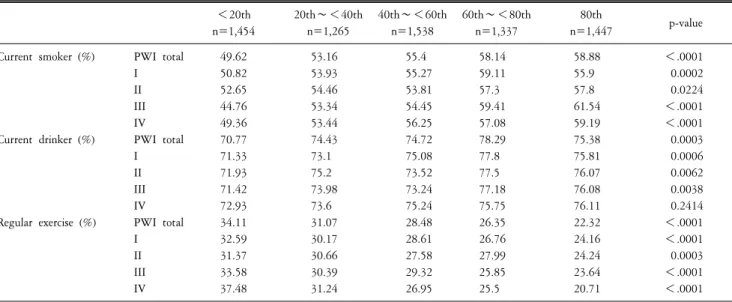
Table 3 shows the comparison between the proportion of
health behavior risk factors among subjects collected in 1999
according to the quintiles of PWI and its 4 factor. Proportion of
current smoker was lower in lower quintiles of PWI (p<0.0001)
Table 2. Comparison of means for health behavior factors according to the quintiles of Total PWI Scores and 4 factors of PWI (1999).
<20th n=1,454
20th∼<40th n=1,265
40th∼<60th n=1,538
60th∼<80th n=1,337
80th
n=1,447 p-value Age (years)
Smoking (pack-years)
Drinking (g ETOH/day)
BMI (kg/m
2)
Exercise (frequency/week)
PWI total I II III IV PWI total I II III IV PWI total I II III IV PWI total I II III IV PWI total I II III IV
39.42 39.01 39.18 40.55 39.28 5.07 5.16 5.42 4.81 5.04 4.7 4.8 4.79 4.84 4.9 23.58 23.5 23.53 23.71 23.73 2.58 2.54 2.52 2.57 2.64
39.32 39.46 38.97 39.18 39.28 5.66 5.61 6 5.64 5.63 5.17 5.2 5.38 5.13 5.22 23.43 23.38 23.36 23.41 23.34 2.5 2.45 2.5 2.49 2.51
38.78 39.03 39.23 39.22 38.88 5.65 5.9 5.48 5.74 5.91 5.42 5.48 5.29 5.46 5.51 23.35 23.37 23.39 23.41 23.37 2.42 2.46 2.4 2.38 2.41
38.83 38.77 38.85 38.39 38.85 6.43 6.42 6.17 6.24 6.28 6.01 5.88 5.86 5.76 5.7 23.3 23.34 23.23 23.26 23.24 2.38 2.38 2.39 2.38 2.32
38.87 39.02 38.89 38.21 38.83 6.69 6.36 6.63 6.94 6.69 5.82 5.74 5.96 5.92 5.84 23.17 23.23 23.27 23.08 23.18 2.26 2.32 2.33 2.3 2.25
0.0324 0.1681 0.5382
<.0001 0.1882
<.0001
<.0001
<.0001
<.0001
<.0001
<.0001
<.0001
<.0001
<.0001
<.0001
<.0001
<.0001
<.0001
<.0001
<.0001
<.0001
<.0001
<.0001
<.0001
<.0001 I: social performance and self-confidencc, II: depression, III: sleeping disturbance and anxiety, IV: general well-being and vitality p-values were based on General Linear Model with adjusting for age & A type behavior pattern.
Table 3. Comparison of proportion of health behavior factors among subjects according to the quintiles of PWI and its 4 factors (1999).
<20th n=1,454
20th∼<40th n=1,265
40th∼<60th n=1,538
60th∼<80th n=1,337
80th
n=1,447 p-value
Current smoker (%)
Current drinker (%)
Regular exercise (%)
PWI total I II III IV PWI total I II III IV PWI total I II III IV
49.62 50.82 52.65 44.76 49.36 70.77 71.33 71.93 71.42 72.93 34.11 32.59 31.37 33.58 37.48
53.16 53.93 54.46 53.34 53.44 74.43 73.1 75.2 73.98 73.6 31.07 30.17 30.66 30.39 31.24
55.4 55.27 53.81 54.45 56.25 74.72 75.08 73.52 73.24 75.24 28.48 28.61 27.58 29.32 26.95
58.14 59.11 57.3 59.41 57.08 78.29 77.8 77.5 77.18 75.75 26.35 26.76 27.99 25.85 25.5
58.88 55.9 57.8 61.54 59.19 75.38 75.81 76.07 76.08 76.11 22.32 24.16 24.24 23.64 20.71
<.0001 0.0002 0.0224
<.0001
<.0001 0.0003 0.0006 0.0062 0.0038 0.2414
<.0001
<.0001 0.0003
<.0001
<.0001
p-values were based on χ
2test.
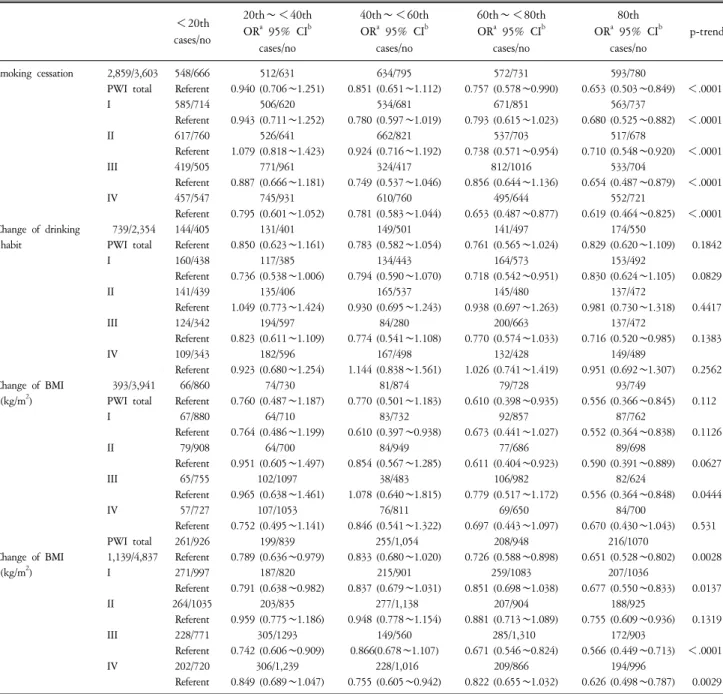
Table 4. Change of health behavior factors observed according to the quintiles of PWI and its four factors between 1999 and 2002.
<20th cases/no
20th∼<40th OR
a95% CI
bcases/no
40th∼<60th OR
a95% CI
bcases/no
60th∼<80th OR
a95% CI
bcases/no
80th OR
a95% CI
bcases/no
p-trend
Smoking cessation
Change of drinking habit
Change of BMI (kg/m
2)
Change of BMI (kg/m
2)
2,859/3,603 PWI total I II III IV 739/2,354 PWI total I II III IV 393/3,941 PWI total I II III IV PWI total 1,139/4,837 I II III IV
548/666 Referent 585/714 Referent 617/760 Referent 419/505 Referent 457/547 Referent 144/405 Referent 160/438 Referent 141/439 Referent 124/342 Referent 109/343 Referent 66/860 Referent 67/880 Referent 79/908 Referent 65/755 Referent 57/727 Referent 261/926 Referent 271/997 Referent 264/1035
Referent 228/771 Referent 202/720 Referent
512/631 0.940 (0.706
∼1.251)
506/620 0.943 (0.711
∼1.252)
526/641 1.079 (0.818
∼1.423)
771/961 0.887 (0.666
∼1.181)
745/931 0.795 (0.601
∼1.052)
131/401 0.850 (0.623
∼1.161)
117/385 0.736 (0.538
∼1.006)
135/406 1.049 (0.773
∼1.424)
194/597 0.823 (0.611
∼1.109)
182/596 0.923 (0.680
∼1.254)
74/730 0.760 (0.487
∼1.187)
64/710 0.764 (0.486
∼1.199)
64/700 0.951 (0.605
∼1.497)
102/1097 0.965 (0.638
∼1.461)
107/1053 0.752 (0.495
∼1.141)
199/839 0.789 (0.636
∼0.979)
187/820 0.791 (0.638
∼0.982)
203/835 0.959 (0.775
∼1.186)
305/1293 0.742 (0.606
∼0.909)
306/1,239 0.849 (0.689
∼1.047)
634/795 0.851 (0.651
∼1.112)
534/681 0.780 (0.597
∼1.019)
662/821 0.924 (0.716
∼1.192)
324/417 0.749 (0.537
∼1.046)
610/760 0.781 (0.583
∼1.044)
149/501 0.783 (0.582
∼1.054)
134/443 0.794 (0.590
∼1.070)
165/537 0.930 (0.695
∼1.243)
84/280 0.774 (0.541
∼1.108)
167/498 1.144 (0.838
∼1.561)
81/874 0.770 (0.501
∼1.183)
83/732 0.610 (0.397
∼0.938)
84/949 0.854 (0.567
∼1.285)
38/483 1.078 (0.640
∼1.815)
76/811 0.846 (0.541
∼1.322)
255/1,054 0.833 (0.680
∼1.020)
215/901 0.837 (0.679
∼1.031)
277/1,138 0.948 (0.778
∼1.154)
149/560 0.866(0.678
∼1.107)
228/1,016 0.755 (0.605
∼0.942)
572/731 0.757 (0.578
∼0.990)
671/851 0.793 (0.615
∼1.023)
537/703 0.738 (0.571
∼0.954)
812/1016 0.856 (0.644
∼1.136)
495/644 0.653 (0.487
∼0.877)
141/497 0.761 (0.565
∼1.024)
164/573 0.718 (0.542
∼0.951)
145/480 0.938 (0.697
∼1.263)
200/663 0.770 (0.574
∼1.033)
132/428 1.026 (0.741
∼1.419)
79/728 0.610 (0.398
∼0.935)
92/857 0.673 (0.441
∼1.027)
77/686 0.611 (0.404
∼0.923)
106/982 0.779 (0.517
∼1.172)
69/650 0.697 (0.443
∼1.097)
208/948 0.726 (0.588
∼0.898)
259/1083 0.851 (0.698
∼1.038)
207/904 0.881 (0.713
∼1.089)
285/1,310 0.671 (0.546
∼0.824)
209/866 0.822 (0.655
∼1.032)
593/780 0.653 (0.503
∼0.849)
563/737 0.680 (0.525
∼0.882)
517/678 0.710 (0.548
∼0.920)
533/704 0.654 (0.487
∼0.879)
552/721 0.619 (0.464
∼0.825)
174/550 0.829 (0.620
∼1.109)
153/492 0.830 (0.624
∼1.105)
137/472 0.981 (0.730
∼1.318)
137/472 0.716 (0.520
∼0.985)
149/489 0.951 (0.692
∼1.307)
93/749 0.556 (0.366
∼0.845)
87/762 0.552 (0.364
∼0.838)
89/698 0.590 (0.391
∼0.889)
82/624 0.556 (0.364
∼0.848)
84/700 0.670 (0.430
∼1.043)
216/1070 0.651 (0.528
∼0.802)
207/1036 0.677 (0.550
∼0.833)
188/925 0.755 (0.609
∼0.936)
172/903 0.566 (0.449
∼0.713)
194/996 0.626 (0.498
∼0.787)
<
.0001
<
.0001
<
.0001
<
.0001
<
.0001
0.1842 0.0829 0.4417 0.1383 0.2562 0.112 0.1126 0.0627 0.0444 0.531 0.0028 0.0137 0.1319
<
.0001
0.0029
a
OR: odds ratio,
bCI: confidence interval.
and its 4 factors (p<0.05).
Proportion of current drinkers was lower in lower quintiles of PWI (p<0.0001) and its factors with social performance and self-confidence, depression, sleeping disturbance and anxiety and general well-being and vitality (p<0.01). Proportion of people with regular exercise was lower in higher quintiles of PWI and its 4 factors (0.001).
Change of health behavior factors were analyzed according to
the quintiles of PWI and its four factors between 1999 and 2002
(Table 4). Adjusted odds ratios of smoking cessation were higher
in lower quintiles of PWI and its 4 factors (p<0.0001). Change
of drinking habit did not show any statistical significance between
the different groups of quintiles. Adjusted odds ratio for change
in BMI was observed as significant in the factors for sleeping
disturbance and anxiety (p=0.0444). Higher adjusted odds ratio for change in exercise was observed in the lower quintiles for PWI (p=0.0028). Lower adjusted odds ratio for change in exercise was observed in the lower quintiles for the factor with social performance and self-confidence (p=0.0137) and for the factor with sleeping disturbance and anxiety and general well-being and vitality (p<0.001).
DISCUSSION
Job performance for workers is very important to increase the productivity of a particular industry. The industry’s performance is affected by the health status of its workers and at the same time by their health behavior which is directly related to stress.
Occurrence of diseases caused by stress is presumed to be caused by direct and indirect factors combined together.
Results of this study showed that the degree of stress is closely related to health behavior. The total score of stress was higher in direct proportion to current smokers, drinkers and workers not doing exercise. Also, pack-years of smoking and daily alcohol consumption increased significantly as total score of stress was higher. The one exception was for the aging worker. It showed an interesting result. As age increased for the worker, the score for stress was higher in factors for social performance and self-confidence compared to the total score for stress in the other 3 factors, depression, sleeping disturbance and anxiety and general well-being and vitality. It seems that people tend to loose their confidence in social performance as they get older.
A cross-sectional survey was done in workers for a commercial services industry to explore the associations of psychosocial factors at work, life style and stressful life events on health and work ability. It revealed that their work performance is largely dependent on their health status and related factors such as smoking, drinking and exercise (Van den Berg et al., 2008).
During the 4-year period, an active health promotion program was promoted among the workers and changes for health behavior were observed according to the degree of stress measured for base line. Rate change for health behaviors was observed and it was found to be different from the one observed in cross-sectional survey.
When the changes for health behavior after the 4-year
follow-up were compared, the rate for smoking cessation was lower compared to the score for stress which was higher.
However, the rate for changing drinking habits did not show any difference when compared to the score for stress at the beginning of the study, and to the contrary, frequency of exercise was lower when compared to a higher PWI.
People drank frequently regardless of their degree of stress while smoking cessation, change of rate for exercise and BMI seemed to be affected by the degree of stress. BMI was lower with a higher PWI score at the beginning of this study, however the rate of change for BMI increased as the score of stress from the base line increased. The extent of the relationship became stronger when observing the factors for sleeping disturbance and anxiety. Results related to BMI and sleeping disturbance observed in this study have been shown in several studies.
Sleep disorders are known to be affected by stress. A study about sleep disorders showed that sleeplessness is associated with medical, psychological and social disturbances and when chronic reflects psychological and behavioral disturbances. Results of this study showed that sleeplessness is more common in middle age people and is associated with obesity and cardiovascular problems (Bortner, 1969; Jenkins et al., 1979; Lee CW et al., 1990;
Vgontzas et al., 1999). The importance of stress associated with diet should also be considered. Some people with stress cope with it using an abnormal eating behavior. A longitudinal, population-based study for both men and women in 1966 in Northern Finland was conducted. The relationship between the intake of food and weight was studied. The predictive factors adult obesity, socioeconomic status and social support were included. People with BMI over 31 are drinkers and the intake of food was accompanied with stress. People with stress intake more fast food and chocolate and drink more (Laitinen et al., 2002). In one study done in U.S.A. in school-aged children, unhealthy eating behavior used as a coping mechanism in stressful situations was observed to lead to obesity (Jenkins et al., 2005).
In a study in Sweden, symptoms of depression and anxiety, sleep disturbances, psychosomatic disease as well as degree of life satisfaction were analyzed in relation to BMI and WHR. Smoking and alcohol are known to have an influence on abdominal obesity;
these factors were, in addition to BMI, entered into the analyses
as confounding variables. It was concluded that in contrast to
BMI, WHR is associated with symptoms of depression and anxiety, sleep disturbances as well as psychosomatic symptoms and dissatisfaction. It was hypothesized that the mechanism involved might be increased secretion of cortisol directing storage of fat to central adipose tissue deposits (Rosmond et al., 1996).
A study performed in Australians showed that Type A behavior and depression was associated with smoking and unsafe drinking in both men and women, but young men with stress had greater physical activity while unhealthy dietary habits was observed in young women with stress. There were gender-related differences in attitudes on health behaviors. The influence of depression and Type A characteristics also had an effect on health-related behaviors (Bortner, 1969). The result for the Australian study about greater physical activity observed in young men with stress was opposite of this study’s results which showed lower BMI and reduced frequency of regular exercise in higher PWI. Besides showing this interesting result that a lower BMI was observed in higher PWI with a lower frequency of regular exercise, the results after 4 years of follow-up showed a higher BMI loss in higher PWI.
The proportion of TABP was higher in higher PWI. In other words, people with high stress tend to have more of a TABP than Type B behavior pattern. Therefore, that factor should be adjusted in the analysis seeing whether stress affected health behavior or changed them during certain time periods. People with TABP are known to have more stressful life events and this TABP itself is known to shift over to illnesses related to cardiovascular disease.
Studies have been done about TABP and its relationship with stress or cardiovascular diseases. Among 197 Japanese men, the relationship between Type A social behavior and tension from the patients’ occupation who are diagnosed with atherosclerotic stenosis was observed. These findings suggest that both the behavioral pattern and psychosocial work environment may be related to coronary artery stenosis (Milligan et al., 1997; Yoshimasu, 2007).
In Belgium, a study of the relationship between socio-psychological characteristics and cardio-atherosclerotic diseases was surveyed. Job stress (1994∼1999) was observed to have a relationship between incidence of acute atherosclerotic disease and job stress in occupational cohort (De Bacquer et al., 2005). Rosenman et
al.(1996) concluded that TABP is strongly related to stress or atherosclerotic diseases in studies which examined the relationship between specific behavior patterns and stress or atherosclerotic diseases (Rosenman et al., 1996). TABP has the following characteristics: offensiveness, competitiveness, pressures on time, hostility, anxiety and impatience on closing. Sometimes speed, eagerness to finish work on time and enthusiasm shown in persons with a TABP are useful in a social organization; however, extreme hostility, offensive, anger and a tendency to neurosis are reported as risk factors for occurring atherosclerotic diseases. Tools for measuring a TABP include the Structured Interview (SI), Jenkins Activity Survey (JAS), Framingham Type A Scale and Bortner Rating Scale (BAS) (Haynes et al., 1978; Jenkins et al., 1979; Rosenman et al., 1996; Park JS et al., 2004). In this study, Framingham Type A Scale was used and internal consistency was examined. Cronbach' α was relatively high as 0.803. People with more stress tend to have TABP, it could cause erroneous result when changes of behavior pattern influenced by stress were examined. Thus, it was adjusted for the factor for TABP in the analysis.
A proper selection and validation of tools for measuring stress and investigation of psychosocial factors for each tool are necessary in advance (Koh SB et al., 1997). PWI which is designed for measuring levels of stress for normal people has specific meaning as an index to determine levels of stress for people with normal daily lives and explores variables related to those levels of stress. Thus, it includes the factors not only physiological, psychological and symptomatic response against stress but also the view point of social performance, self-reliance and reliability. It should be checked whether one index brings the same results after applying it several times on the same subjects.
It can be examined with test-retest, split-half and internal consistency (Chang SJ, 1993; Chang SJ, 2000). The test for reliability for PWI-45 and its 4 factors was performed. Cronbach' α which reveals internal consistency for total PWI was 0.761, that of the factor for sleep disturbance and anxiety was highest at 0.794, the factor for social performance and self-confidence was 0.761, the factor for depression was 0.767 and the factor for general wellbeing and vitality was 0.775.
When PWI is used to measure stress for workers for a certain
community, it has limitations and needs to be used with precautions. An error range could be introduced in the subjective view and critics of the PWI index say it is a miniature of GHQ which cannot be avoided.
Regardless of several limitations, PWI revealed good results for health behavior risk factors affected by stress as a screening tool and showed useful results to see the change in health behavior risk factors after a certain follow up period.
As seen in the results of this study, people with higher stress tend to have more improper health behaviors and to have difficulty in change them to good health behaviors. To achieve successful result of health promotion program proper stress management in industrial field is necessary. Stress can be relieved by social support, good relationship between colleagues and in organizations and by allocating resources for psychological counseling (Bech et al., 2005; Fortes-Ferreira et al., 2006). Stress affects the human body directly and affects indirectly improper health behaviors. These combined factors can cause diseases. If stress can be properly controlled and relieved, people with improper health behaviors will change to having good health behaviors and they will be protected from the occurrence of health abnormalities which are a direct result from improper health behavior and stress.
Most of the studies done to date show a relationship between stress and health behaviors and that health behavior risk factors are regarded as independent variables and indices for stress as dependent variables. However in this study, health behavior risk factors affected by stress and change of health behaviors according to the degree of stress were observed. Mechanisms of stress having influence on health behavior risk factors should be examined and explored with further research.
REFERENCES