http://e-nrp.org
Structural relations of late night snacking choice attributes and health promotion behaviors according to dietary style of industrial workers
Young Il Park and Nami Joo§
Department of Food and Nutrition, Sookmyung Women’s University, 100 Cheongpa-ro 47-gil, Yongsan-gu, Seoul 140-742, Korea
BACKGROUND/OBJECTIVES: This research was conducted to develop a construct model regarding the dietary style, late night snacking choice attributes and health promotion behaviors of industrial workers.
SUBJECTS/METHODS: The surveys were collected during the period between January and February 2013. A statistical analysis of 888 industrial workers was conducted using SPSS 12.0 for Windows and SEM (Structural Equation Model) using AMOS (Analysis of Moment Structure) 5.0 statistics package.
RESULTS: The results of the correlations between all variables showed significant positive correlations (P < 0.05). Results of factors analysis on dietary styles were categorized into five factors and health promotion behaviors were categorized into four. The reliability of these findings was supported by a Cronbach’s alpha coefficient of 0.6 and higher for all other factors.
After obtaining the factors from processing an exploratory factor analysis and the end results supported the validity. In an attempt to study the late night snacking choice attributes in accordance to dietary styles and the health promotion behaviors of industrial workers, a structural equation model was constructed and analyzed.
CONCLUSIONS: All tests proved the model satisfied the recommended levels of the goodness on fit index, and thus, the overall research model was proved to be appropriate.
Nutrition Research and Practice 2014;8(4):432-438; doi:10.4162/nrp.2014.8.4.432; pISSN 1976-1457 eISSN 2005-6168
Keywords: Industrial workers, dietary style, late night snacking choice attributes, health promotion behaviors, SEM (Structural Equation Model)
INTRODUCTION13)
As the industrial sector increases, a growing number of workers are coping with lifestyle changes and occupation- related accidents and diseases [1]. Concurrently, with the increase of industrialization, the health profile of the country is also changing. Presently, metabolic syndromes such as cardiovascular diseases and type2 diabetes have become the leading causes of morbidity and mortality in Korea. Both of these conditions are linked to unhealthy consumption behaviors and physical inactivity [2].
To prevent or manage metabolic syndrome, it has been suggested that we need to understand lifestyle-associated risk factors, and then modify them. Several lifestyle factors including a smoking, alcohol consumptions, exercising, and eating habits have been found to influence metabolic syndrome abnormalities [3-7]. Up until today, many studies have reported associations between dietary patterns and metabolic syndromes [8-11].
Dietary pattern approaches are beneficial as they capture the complex nature of dietary intakes and explore its relationship with health outcomes.
The notion that late evening meals promote weight gains is popular, and many diets recommend limiting food intakes
during the late night hours [12] because metabolic rate decreases during sleep [13]. Late evening meals may also elicit postprandial hyperglycemia, since glucose tolerance decreases from morning to midnight [14].
Health promotion can be regarded as a combination of educational, organizational, economic and political actions designed with consumer participation, to enable individuals, groups and whole communities to increase control over, and to improve their health through attitudinal, behavioral, social and environmental changes, as stressed by the World Health Organization [15,16]. As individuals live longer, health promotion behaviors become even more important, particularly with regards to maintaining function and independence, and improving quality of life [17-19]. Since the National Health Promotion Act was enacted in [20], there has been a growing need for developing community-focused health promotion programs that are directed towards the population in Korea.
Therefore, this study examined the degree of health promotion behaviors and the relationship between dietary styles, late night snacking choice attributes and health promotion behaviors among the Korean industrial workers who live within the community. This study elucidated the health promotion behaviors that Korean industrial workers are engaged in, how they
§Corresponding Author: Nami Joo, Tel. 82-2-710-9471, Fax. 82-2-710-9479, Email. [email protected] Received: September 5, 2013, Revised: April 25, 2014, Accepted: April 28, 2014
This is an Open Access article distributed under the terms of the Creative Commons Attribution Non-Commercial License (http://creativecommons.org/licenses/by-nc/3.0/) which permits unrestricted non-commercial use, distribution, and reproduction in any medium, provided the original work is properly cited.
Category N %
Gender Male 742 83.60
Female 146 16.40
Age(yrs) 20-29 174 19.60
30-39 325 36.60
40-49 299 33.70
≥50 90 10.10
Education Under middle school 11 1.20
Middle school 45 5.10
High school 545 61.40
University 276 31.10
Over university graduate 11 1.20
Marital status Married 600 67.60
Single 279 31.40
etc 9 1.00
Household income (10,000 won/month)
≤100 8 9.26
100-199 203 23.46
200-299 366 18.52
300-399 160 26.54
≥400 151 8.64
Table 1. Demographic characteristics of the questionnaire from respondents (N = 888)
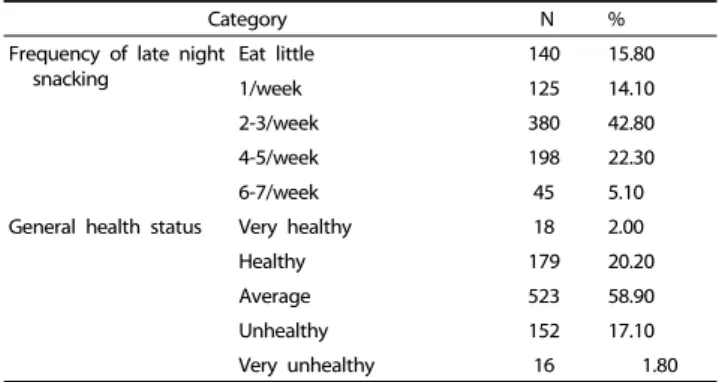
Category N %
Frequency of late night snacking
Eat little 140 15.80
1/week 125 14.10
2-3/week 380 42.80
4-5/week 198 22.30
6-7/week 45 5.10
General health status Very healthy 18 2.00
Healthy 179 20.20
Average 523 58.90
Unhealthy 152 17.10
Very unhealthy 16 1.80
Table 2. Frequency of late night snacking and general health status of the questionnaire from respondents (N = 888)
evaluate their dietary styles, and whether their dietary style varies by the degree of health promotion behaviors.
SUBJECTS AND METHODS Study participants
Survey questionnaires were directly distributed to the industrial workers in Kyungsangnamdo. The data were collected from 888 industrial workers from January to February 2013, and approxi- mately 30 to 40 minutes was used per person.
Survey protocols, instruments and the process for obtaining informed consent for this study were approved by the institu- tional review committees of Sookmyung Women’s University (Approval No. 13-0923-007). All participants gave their written informed consent.
Questionnaire
The questionnaire for industrial workers’ dietary style was constructed with reference to relevant previous studies [21-23]
and consisted of 17 items on eating habits and the question- naire for late night snaking choice attributes was constructed with reference to relevant previous studies [12-14] and consisted of 5 items on quality, price, sanitation, quantity and nutrition.
The questionnaire for industrial workers’ health promotion behavior was constructed with reference to relevant previous studies [24-27] and consisted of 16 items on exercise manage- ment, personal relationship, self-realization and nutrition management. The 5-point Likert scale was utilized to evaluate the items, and selecting 1 point means ‘strongly disagree’ while 5 points refers to ‘strongly agree.’
Research model and hypotheses
Independent variables were dietary life where late night snacking choice attributes was introduced as a parameter and the dependent variable of health promotion behavior. The following hypotheses were set up based on the assumption that the variables of this model were closely related.
Hypothesis 1: The dietary style of industrial workers will significantly affect late night snacking choice attributes.
Hypothesis 2: The late night snacking choice attributes of industrial workers will significantly affect health promotion behavior.
Hypothesis 3: The dietary style of industrial workers will significantly affect health promotion behavior.
Statistical analysis
The data were analyzed by SPSS 12.0 for Window and SEM which was created by AMOS 5.0 packages. Firstly, the reliability was deduced by an exploratory factor analysis and a Cronbach's alpha coefficient, and then, the validity was established by a confirmatory factor analysis. Secondly, a correlation analysis was performed for each factor. Thirdly, the SEM was utilized to identify a path coefficient for the current study model on the basis of reliability and validity results.
RESULTS Participants
According to the demographic analysis, frequency of late night snacking and general health status of the industrial workers in Table 1 and Table 2, 70.30% of the industrial workers were aged 30-49, 61.40% had completed education of high school. Most of them (67.60%) were married and 31.40% of them were still single. The largest percentage (42.80%) of industrial workers had late-night snacks twice or three times a week, and 22.30% of them took late-night meals. Nearly half of the workers (58.90%) were in normal health, and 18.90% was either unhealthy or very unhealthy.
Exploratory factor analysis of questionnaire item of industrial worker’s dietary style
The results of the dietary life 17 items as determined by the exploratory factor analysis are presented in Table 3. Dietary styles were categorized into five factors such as trend-oriented,
Question Factor1 Factor2 Factor3 Factor4 Factor5 Cronbach's alpha Trend-oriented Easily follow the latest trend of foods 0.847
0.836
Try to have a variety of foods 0.810
Enjoy eating trendy foods 0.774
Know famous restaurants and foods 0.719
Economy-oriented Always check the price when buying groceries 0.830
0.802 First consider discount products when buying groceries 0.811
Buy groceries after comparing price 0.762
Buy cheaper product when quality is similar 0.743
Health- oriented First consider food additives when buying groceries 0.866
0.750
Always buy organic foods 0.842
Carefully choose food for health 0.680
Convenience- oriented
Eat delivery food often 0.828
0.759
Often purchase the ready-to-eat food 0.804
Eat fast food often 0.778
Gourmet- oriented Consider nutrition than taste when purchase food 0.807
0.716
Not fear of new flavors 0.747
However much it costs, purchase if it looks tasty 0.720
Explained variance 2.706 2.572 2.131 2.084 1.908
Explained rate (%) 15.902 15.130 12.536 12.261 11.221
Cumulative percentage 15.920 31.050 43.586 55.847 67.068
Table 3. Explorative factor analysis on dietary style of industrial workers
Question Factor Cronbach's alpha
Quality 0.780
0.809
Price 0.776
Sanitation 0.756
Quantity 0.741
Nutrition 0.713
Explained variance 2.839
Explained rate (%) 56.775
Table 4. Explorative factor analysis of late night snacking choice attributes
economy-oriented, health-oriented, convenience-oriented and gourmet-oriented. The reliability of these findings was supported by a Cronbach’s alpha coefficient of 0.836, 0.802, 0.750, 0.759 and 0.716, respectively. The validity was established by 67.068%
of the explained rate for the factors of dietary style.
Exploratory factor analysis of questionnaire item of industrial worker’s late night snaking choice attributes
The results of the daily activities items as determined by the exploratory factor analysis are presented in Table 4. The items include ‘Quality’, ‘Price’, ‘Sanitation’, ‘Quantity’ and ‘Nutrition’.
Reliability and validity were established by 0.809 of Cronbach’s alpha, and 56.775% of the explained rate for the factors on the late night snacking choices.
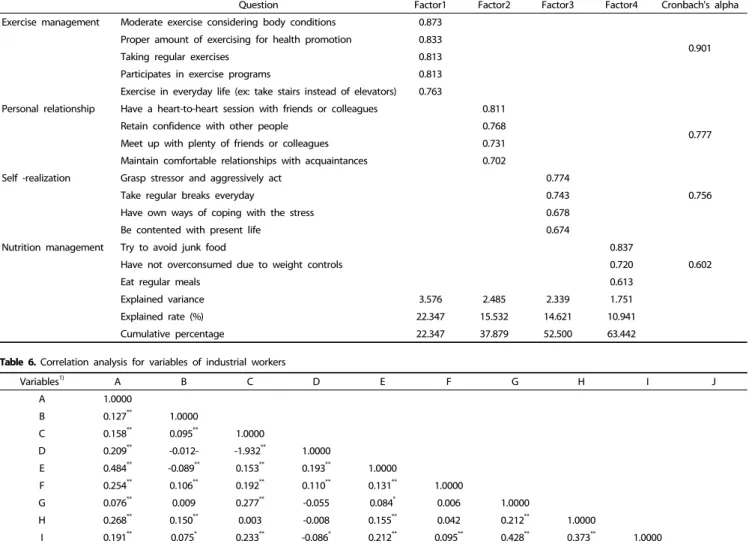
Exploratory factor analysis of questionnaire item of industrial worker’s health promotion behavior
Table 5 displays the results of the health promotion behavior on 16 items as indicated by the exploratory factor analysis. Four factors in total were identified as a result of the first factor analysis, but a low Cronbach’s alpha coefficient was found from the factor including items. Therefore, the second factor analysis was conducted after the items were excluded. As a result, four
factors were identified and revealed 63.442% of the explained rate, and the respective Cronbach's alpha reliability coefficients for the factors 1, 2, 3 and 4 were reported as 0.901, 0.777, 0,756 and 0.602.
Correlation analysis for the variables
The results, as shown in Table 6, indicate that multicollinearity was not a problem among all variables since the highest correla- tion coefficient was -1.932. There were significant correlations between all the variables. The most correlated variables were expected for health-oriented and convenience-oriented (r = -1.932, P < 0.01), and trend-oriented and gourmet-oriented were next (r = 0.484, P < 0.01), which were followed by expectations on exercise management and self-realization (r = 0.428, P < 0.01) according to relationship and self-realization (r = 0.373, P <
0.01). The least correlated variables were health-oriented and personal relationship (r = 0.003).
Confirmatory factor analysis of the measurement model As shown in Table 7, by the confirmatory factor analysis of the measurement model, Construct Reliability (CR) and Average Variance Extracted (AVE) are 0.7 or more and 0.5 or more respectively, which sufficiently supports the reliability of latent variables and constructs validity. The model was also confirmed as appropriate since the optimal results revealed the values of χ2= 1,891.755, GFI = 0.892, AGFI = 0.872, IFI = 0.902, NFI = 0.860, CFI = 0.901, RMR = 0.047, and RMSEA = 0.050, which satisfied the recommended standards, and also proved the model to be appropriate.
Model fit test of the measurement model
Table 8 reports the results of hypothetical model fit indices as χ2= 1,713.843, GFI = 0.904, AGFI = 0.885, IFI = 0.915, NFI =
Question Factor1 Factor2 Factor3 Factor4 Cronbach's alpha Exercise management Moderate exercise considering body conditions 0.873
0.901 Proper amount of exercising for health promotion 0.833
Taking regular exercises 0.813
Participates in exercise programs 0.813
Exercise in everyday life (ex: take stairs instead of elevators) 0.763
Personal relationship Have a heart-to-heart session with friends or colleagues 0.811
0.777
Retain confidence with other people 0.768
Meet up with plenty of friends or colleagues 0.731
Maintain comfortable relationships with acquaintances 0.702
Self -realization Grasp stressor and aggressively act 0.774
0.756
Take regular breaks everyday 0.743
Have own ways of coping with the stress 0.678
Be contented with present life 0.674
Nutrition management Try to avoid junk food 0.837
0.602
Have not overconsumed due to weight controls 0.720
Eat regular meals 0.613
Explained variance 3.576 2.485 2.339 1.751
Explained rate (%) 22.347 15.532 14.621 10.941
Cumulative percentage 22.347 37.879 52.500 63.442
Table 5. Explorative factor analysis of health promotion behaviors of industrial workers
Variables1) A B C D E F G H I J
A 1.0000
B 0.127** 1.0000
C 0.158** 0.095** 1.0000
D 0.209** -0.012- -1.932** 1.0000
E 0.484** -0.089** 0.153** 0.193** 1.0000
F 0.254** 0.106** 0.192** 0.110** 0.131** 1.0000
G 0.076** 0.009 0.277** -0.055 0.084* 0.006 1.0000
H 0.268** 0.150** 0.003 -0.008 0.155** 0.042 0.212** 1.0000
I 0.191** 0.075* 0.233** -0.086* 0.212** 0.095** 0.428** 0.373** 1.0000
J 0.95** 0.120** 0.347** -0.263** 0.066 0.069* 0.343** 0.212** 0.328** 1.0000
1)A: Trend oriented. B: Economy oriented. C: Health oriented. D: Convenience oriented. E: Gourmet oriented. F: Late night snacking choice attributes. G: Exercise management.
H: Personal relationship. I: Self-realization. J: Nutrition management
*P< 0.05, **P< 0.01, ***P< 0.001.
Table 6. Correlation analysis for variables of industrial workers
Model χ21) (P-value) χ2/df2) GFI3) AGFI4) IFI5) NFI6) CFI7) RMR8) RMSEA9)
Optimum model P > (.05) < 2 .90-1 .90-1 .90-1 .90-1 .90-1 < 0.05 < 0.5
Hypothetical model 1,891.755 (.000) 3.037 0.892 0.872 0.902 0.860 0.901 0.047 0.050
1)χ2: Chi-square. 2)χ2/df: Chi-square divided by degree of freedom.
3)GFI: Goodness of fit index. 4)AGFI: Adjusted goodness of fit index.
5)IFI: Incremental fit index. 6)NFI: Normed fit index.
7)CFI: Comparative fit index. 8)RMR: Root mean residual.
9)RMSEA: Root means squared error of approximation.
Table 7. Goodness of fit in confirmatory factor analysis of industrial workers
Model χ21) (P-value) χ2/df2) GFI 3) AGIF4) IFI 5) NFI6) CFI7) RMR8) RMSEA9)
Goodness of fit criteria P > (.05) < 2 .90-1 .90-1 .90-1 .90-1 .90-1 < 0.05 < 0.5
Hypothetical model 1,713.843 (.000) 2.769 0.904 0.885 0.915 0.873 0.915 0.039 0.045
Result unfit acceptable fit acceptable fit acceptable fit fit fit
1)χ2: Chi-square. 2)χ2/df: Chi-square divided by degree of freedom.
3)GFI: Goodness of fit index. 4)AGFI: Adjusted goodness of fit index.
5)IFI: Incremental fit index. 6)NFI: Normed fit index.
7)CFI: Comparative fit index. 8)RMR: Root mean residual.
9)RMSEA: Root means squared error of approximation.
Table 8. Hypothetical model fit index of industrial workers
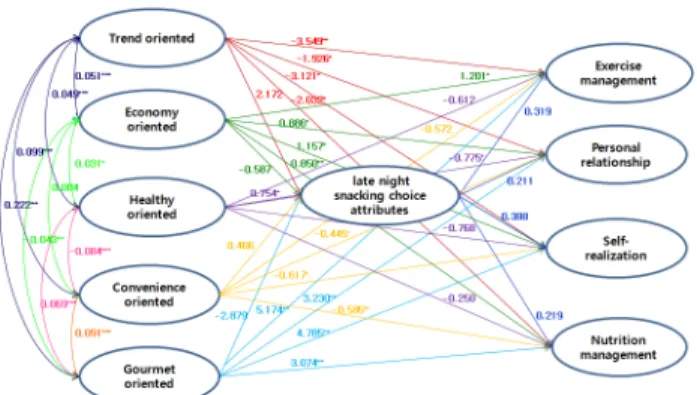
Fig. 1. Final results of the model analysis using AMOS.
0.873, CFI = 0.915, RMR = 0.039, and RMSEA = 0.045. Although the χ2 value was revealed to be inappropriate, the current research model in Fig. 1 was confirmed to be appropriate since the other indices like GFI, IFI, CFI, RMR and RMSEA were proved to be appropriate, and CMIN/DF, AGFI and NFI satisfied the recommended standards.
As a result of testing Hypothesis 1, while health-oriented was adopted, it turned out to have significant positive (+) effects on the late night snacking choice attributes; the taste-oriented, convenience-oriented, economy-oriented, and trend-riented were all rejected because they had no significant effects. As a result of testing Hypothesis 2, it turned out that although the late night snacking choice attributes had positive (+) effects on the health promotion behaviors, it was not significant, and thereby Hypothesis 2 was rejected. As a result of testing Hypothesis 3, the trend-oriented had significant negative (-) effects on all the health promotion behaviors.
DISCUSSION
This research analyzes the industrial workers’ dietary styles for the intakes of late night snacks and the choice attributes being brought to the consumers. It further attempts to draw a relationship between late night snacking choice attributes and the effects it has on health promotion behaviors by using the method of construct model development. The audience for the surveys was industrial workers, and they were sampled during the period between January and February 2013.
Factor analysis was applied to: 17 questions related to dietary styles, 5 questions were related to late night snacking choice attributes and 16 questions related to health promotion behavior.
Questions in industrial workers’ dietary style category was summed up under 5 factors, late night snacking choice attribute into 1 factor, and health promotion behavior was summed up as 4 factors. As a result on the exploratory factor analysis, the Cronbach’s alpha was 0.6 or more for all factors, which established the reliability. The results of the correlations revealed that multicollinearity was not a problem among all variables since the highest correlation coefficient was 0.484, and that the significant positive correlations between variables have emerged. After factors were identified by the exploratory factor analysis, the confirmatory factor analysis of the measurement model was performed with AMOS to establish the validity. As
a result, the χ2 value was revealed to be inappropriate, but the other indices except for these two values were proven to be appropriate enough to satisfy the recommended level.
As a result of testing Hypothesis 1, while health-oriented was adopted, it turned out to have significant positive (+) effects on the late night snacking choice attributes. According to a study of Seo [28], the number of midnight snack intakes for workers significantly influenced bedtime and wakeup conditions, and Kim [29] reported that the obesity managing type ingests little midnight snacks as comparing to the potential obesity and habitual obesity types. Thus, it is considered that workers who try stay healthy select midnight snacks after considering its quality, nutrition, amount, price, etc.
As a result of testing Hypothesis 2, it turned out that although the late night snacking choice attributes had positive (+) effects on the health promotion behaviors, it was not significant, and thereby Hypothesis 2 was rejected.
As a result of testing Hypothesis 3, the trend-oriented had significant negative (-) effects on all the health promotion behaviors. According to a study by Moon [23], the trend- oriented had a relatively higher ostentation than others. Thus, workers who seek such trends are recognized to be more interested in health promotion programs in vogue due to ostentation than in health promotion behaviors. The economy- oriented had significant positive (+) effects on all the health promotion behaviors, which is similar to a research by Han &
Ha [30] that deduced female consumers with a higher economic level tend to have a higher degree of behaviors on weight controls. While the health-oriented had a significant effect on personal relationships (-0.775), it had insignificant negative (-) effects on self-realization, exercise management, and nutrition management. Hence, results of this study indicate that workers who sought dietary lives and considered health, had a low degree of health promotion behaviors; this coincided with that of Lee & Lee [31] where industrial workers consumed alcohol more frequently and had higher fatigues, they also showed a higher degree of health promotion behaviors. It turned out that while the convenience-oriented had significant negative (-) effects on personal relationship (-0.445), self-realization (-0.617), and nutrition management (-0.585), it had insignificant negative (-) effect on the exercise management. A research of Kim [32]
& Kim [33] targeting nurse practitioners indicated that higher fatigues led to lower degrees of health promotion behaviors.
Thus, it is concluded that convenience-oriented workers who preferred cooked foods and convenient fast foods are more sensitive to physical and mental fatigues, and thereby, show negative (-) tendencies towards health promotion behaviors.
The gourmet-oriented turned out to have significant effects on exercise management (5.17), personal relationship (3.230), self- realization (4.785), and nutrition management (3.704), which indicates that it had significant positive (+) effects on all the health promotion behaviors. According to a study by Kim [33], the quality of life on the gourmet-oriented turned out to be high. Thus, high quality life meant high satisfaction level for life and highly subjective of well-being [34-36], it is known that workers who prefer delicious foods have lots of positive emotional experiences, and thereby, are active when promoting the health behaviors.
This study classified dietary life types of industrial workers and grasped their effects on the late night snacking choice attributes and the health promotion behaviors. Health promotion programs that fit for each dietary life type need to be developed based on this study, and health of industrial workers should be improved through appropriate health management programs;
and eventually, national health policies need to be economically established and competitiveness of industries and the nation should be raised by lowering the morbidity rate of chronic diseases.
REFERENCES
1. Moreno-Black G, Homchampa P. At the factory, at the table: dietary beliefs and practices of Thai industrial workers. Ecol Food Nutr 2007;46:313-37.
2. Ministry of Health and Welfare (KR). Ministry of Health and Welfare Statistical Yearbook 2012. Seoul: Ministry of Health and Welfare;
2012.
3. Potenza MV, Mechanick JI. The metabolic syndrome: definition, global impact, and pathophysiology. Nutr Clin Pract 2009;24:560-77.
4. Rumawas ME, Meigs JB, Dwyer JT, McKeown NM, Jacques PF.
Mediterranean-style dietary pattern, reduced risk of metabolic syndrome traits, and incidence in the Framingham Offspring Cohort. Am J Clin Nutr 2009;90:1608-14.
5. Park HS, Oh SW, Cho SI, Choi WH, Kim YS. The metabolic syndrome and associated lifestyle factors among South Korean adults. Int J Epidemiol 2004;33:328-36.
6. Shin A, Lim SY, Sung J, Shin HR, Kim J. Dietary intake, eating habits, and metabolic syndrome in Korean men. J Am Diet Assoc 2009;109:633-40.
7. Fung TT, Chiuve SE, McCullough ML, Rexrode KM, Logroscino G, Hu FB. Adherence to a DASH-style diet and risk of coronary heart disease and stroke in women. Arch Intern Med 2008;168:713-20.
8. Baxter AJ, Coyne T, McClintock C. Dietary patterns and metabolic syndrome--a review of epidemiologic evidence. Asia Pac J Clin Nutr 2006;15:134-42.
9. Wirfält E, Hedblad B, Gullberg B, Mattisson I, Andrén C, Rosander U, Janzon L, Berglund G. Food patterns and components of the metabolic syndrome in men and women: a cross-sectional study within the Malmö Diet and Cancer cohort. Am J Epidemiol 2001;154:
1150-9.
10. Panagiotakos DB, Pitsavos C, Skoumas Y, Stefanadis C. The associa- tion between food patterns and the metabolic syndrome using principal components analysis: The ATTICA Study. J Am Diet Assoc 2007;107:979-87.
11. Liu L, Nettleton JA, Bertoni AG, Bluemke DA, Lima JA, Szklo M.
Dietary pattern, the metabolic syndrome, and left ventricular mass and systolic function: the Multi-Ethnic Study of Atherosclerosis. Am J Clin Nutr 2009;90:362-8.
12. Sato M, Nakamura K, Ogata H, Miyashita A, Nagasaka S, Omi N, Yamaguchi S, Hibi M, Umeda T, Nakaji S, Tokuyama K. Acute effect of late evening meal on diurnal variation of blood glucose and energy metabolism. Obes Res Clin Pract 2011;5:e169-266.
13. Katayose Y, Tasaki M, Ogata H, Nakata Y, Tokuyama K, Satoh M.
Metabolic rate and fuel utilization during sleep assessed by whole-body indirect calorimetry. Metabolism 2009;58:920-6.
14. Van Cauter E, Désir D, Decoster C, Féry F, Balasse EO. Nocturnal
decrease in glucose tolerance during constant glucose infusion. J Clin Endocrinol Metab 1989;69:604-11.
15. World Health Organization (CH). The Ottawa Charter for Health Promotion. Geneva: World Health Organization; 1986.
16. World Health Organization (CH). The Jakarta Declaration on Leading Health Promotion into the 21st Century. Geneva: World Health Organization; 1997.
17. Goldberg TH, Chavin SI. Preventive medicine and screening in older adults. J Am Geriatr Soc 1997;45:344-54.
18. Leveille SG, Guralnik JM, Ferrucci L, Langlois JA. Aging successfully until death in old age: opportunities for increasing active life expectancy. Am J Epidemiol 1999;149:654-64.
19. Sims J, Kerse NM, Naccarella L, Long H. Health promotion and older people: the role of the general practitioner in Australia in promoting healthy ageing. Aust N Z J Public Health 2000;24:356-9.
20. Ministry of Health and Welfare (KR). Ministry of Health and Welfare Statistical Yearbook 1995. Seoul: Ministry of Health and Welfare;
1995.
21. Kim MJ, Jung HS, Yoon HH. A study on the relationships between food-related lifestyle of undergraduates and the restaurant selection attribute. Korean J Food Cult 2007;22:210-7.
22. Kim M, Kim H. A study on the consumption behaviors regarding red pepper paste according to the food-related lifestyles of housewives. J East Asian Soc Diet Life 2009;19:1-8.
23. Moon YS. A study on the green tea consumption behaviors depending on the food-related lifestyle [master's thesis]. Seoul:
Sungkyunkwan University; 2012.
24. Kim MH, Chung YK. A study on the relations of health promoting daily life style and self-efficiency about boy's obesity. Chung-Ang J Nurs 2000;4:93-119.
25. Kim MS, Kang HS, Cho KJ. Factors influencing health-promotion behavior in adolescents. Korean J Child Health Nurs 2004;10:
496-503.
26. Kim N, Kwon M. Health promoting behaviors and influencing factors in middle school students: focus on optimism and pessimism. J Korean Acad Child Health Nurs 2008;14:388-95.
27. Lee SH, Chon MY. Health promotion behavior of the labor workers at the cement manufacturing company. J Korean Soc Health Educ Promot 2004;21:35-51.
28. Seo JH. A study on the dietary habits and nutritional knowledge of construction workers in relation to late night snacking habits [master's thesis]. Seoul: Sookmyung Women's University; 2009.
29. Kim MH. A study on image of functional food and meal patterns of health behavior. J East Asian Soc Diet Life 2001;11:151-9.
30. Han IK, Ha AW. A study on weight control behavior by female consumers eating life styles. Korean J Food Nutr 2009;22:177-84.
31. Lee KH, Lee KS. Effects of fatigue on health promotion behavior and mental health of automotive manufacturing workers. Korean J Occup Health Nurs 2011;20:143-52.
32. Kim SO. A study on the fatigue and health promoting behavior in nurses [master's thesis]. Daejeon: Chungnam National University;
2003.
33. Kim B. Structural relations of convenience food satisfaction and quality of life acoording to dietary style: focusing on singles in metropolitan area of Korea, Japan and China [doctor's thesis]. Seoul:
Sookmyung Women's University; 2013.
34. Campbell A, Converse PE, Rodgers WL. The Quality of American Life: Perceptions, Evaluations, and Satisfactions. New York (NY):
Rusell Sage Foundation; 1976.
35. Dalkey NC, Rourke DL. The Dephi procedure and rating quality of life factors. In: The Environmental Protection Agency; Office of Research and Monitoring Environmental Studies Division, editors.
The Quality of Life Concept: A Potential New Tool for Decision-
Makers. Washington D.C.: The Environmental Protection Agency;
1973. p.II-209-21.
36. Neugarten BL, Havighurst RJ, Tobin SS. The measurement of life satisfaction. J Gerontol 1961;16:134-43.