Part II. What drives Korean adults to seek
orthodontic treatment: Factors contributing to orthodontic treatment decisions
Objective: This study aimed to identify the perceptions of orthodontic treatment among Korean adults and determine the factors that drive them to seek orthodontic treatment. Methods: A total of 2,321 adults aged 19–64 years were surveyed using an internet research system from a specialized research company. The participants were divided into the following groups based on their experience of and willingness to undergo orthodontic treatment:
experience, acceptance, and non-acceptance groups. The characteristics of the participants were compared using analysis of variance with post-hoc analysis.
Multinomial logistic regression analysis was performed in all three models with the non-acceptance group as a reference. Results: In terms of demographic characteristics, age, gender, marital status, and education had significant influences on orthodontic treatment decisions in adults in the experience and acceptance groups (p < 0.001). When all the factors were analyzed, age, marital status, past dental treatment experience, regular oral examinations, demand for orthodontic treatment, optimal treatment period, health insurance coverage, information on orthodontic treatments, perceptions regarding orthodontic treatment, and psychosocial impact of dental esthetics significantly influenced orthodontic treatment decisions in adults in the experience and acceptance groups (p < 0.001). Conclusions: These findings suggest that various factors influence orthodontic treatment decisions in adults. Individuals who seek orthodontic treatment were found to undergo more regular dental treatment and oral examination than those who did not. They also had a better perception of orthodontic treatment and more negative values for the psychosocial impact of dental esthetics.
[Korean J Orthod 2021;51(1):3-14]
Key words: Adult treatment, Perception, Psychosocial impact, Treatment decision
Min-Hee Oh
a,bAe-Hyun Park
aMinSoo Kim
cEun-A Kim
dJin-Hyoung Cho
a,ba
Department of Orthodontics, School of Dentistry, Chonnam National University, Gwangju, Korea
b
Dental 4D Research Institute, Dental Science Research Institute, Chonnam National University, Gwangju, Korea
c
Department of Statistics, College of Natural Sciences, Chonnam National University, Gwangju, Korea
d
Department of Nursing, Honam University, Gwangju, Korea
Received April 16, 2020; Revised September 13, 2020; Accepted October 1, 2020.
Corresponding author: Jin-Hyoung Cho.
Professor and Chairman, Department of Orthodontics, School of Dentistry, Dental 4D Research Institute, Dental Science Research Institute, Chonnam National University, 77, Yongbong-ro, Buk-gu, Gwangju 61186, Korea.
Tel +82-62-530-5818 e-mail [email protected]
Min-Hee Oh and Ae-Hyun Park contributed equally to this work (as co-first authors).
How to cite this article: Oh MH, Park AH, Kim MS, Kim EA, Cho JH. Part II. What drives Korean adults to seek orthodontic treatment: Factors contributing to orthodontic treatment decisions. Korean J Orthod 2021;51:3-14.
© 2021 The Korean Association of Orthodontists.
This is an Open Access article distributed under the terms of the Creative Commons Attribution Non-Commercial License (http://creativecommons.org/licenses/by-nc/4.0) which permits unrestricted non-commercial use, distribution, and reproduction in any medium, provided the original work is properly cited.
pISSN 2234-7518 • eISSN 2005-372X
https://doi.org/10.4041/kjod.2021.51.1.3
INTRODUCTION
Adolescents have been the primary target of orth- odontic treatment in the past. However, in recent times, the number of adults seeking orthodontic treatment to improve esthetics, appearance, and function has in- creased significantly because of economic development and the increasing availability of information regarding orthodontic treatment.
1,2Unlike adolescents, adult orth- odontic patients have different physical characteristics and a greater capacity to make decisions for themselves;
they also have very specific psychological perspectives for treatment motivation and needs. Therefore, these differences need to be considered for adult orthodontic patients. In a study by Lee,
3adults had a stronger ten- dency to decide for themselves whether they will have a treatment than adolescents, and their will and judgment often influenced their treatment decisions. In another study by Wedrychowska-Szulc and Syry ńska,
4orthodon- tic treatment-related decisions among adolescents were strongly influenced by their dentist or parents; however, this tendency decreased with age in adulthood.
Socioeconomic and psychological aspects, such as im- provement in appearance and interpersonal relationships, have a greater impact than functional abnormalities on the choice or decision to seek orthodontic treatment. In a study by Hassan and Amin Hel-S,
5malocclusion re- quiring orthodontic treatment in young adults had neg- ative effects such as oral pain, dissatisfaction with self, nervousness, and dissatisfaction with life. Further, in a study by Pabari et al.,
6self-satisfaction and facial body image scores were higher after orthodontic treatment and orthodontic treatment had a positive effect on self- esteem.
In adults, it is essential to identify the state of and differences in perception since treatment decisions are usually based on an individual’s perception regarding orthodontic treatment rather than the expert’s view.
However, limited studies have been conducted on this
subject. Therefore, the present study aimed to under- stand the perceptions regarding orthodontic treatment among adults and investigate the factors that drive adult orthodontic treatment in Korea. We hypothesized that there is no difference between adults who seek orthodontic treatment and those who do not.
MATERIALS AND METHODS
This study was approved by the Institutional Review Board of Chonnam National University Dental Hospital (1041223-202003-HR-01).
Study participants
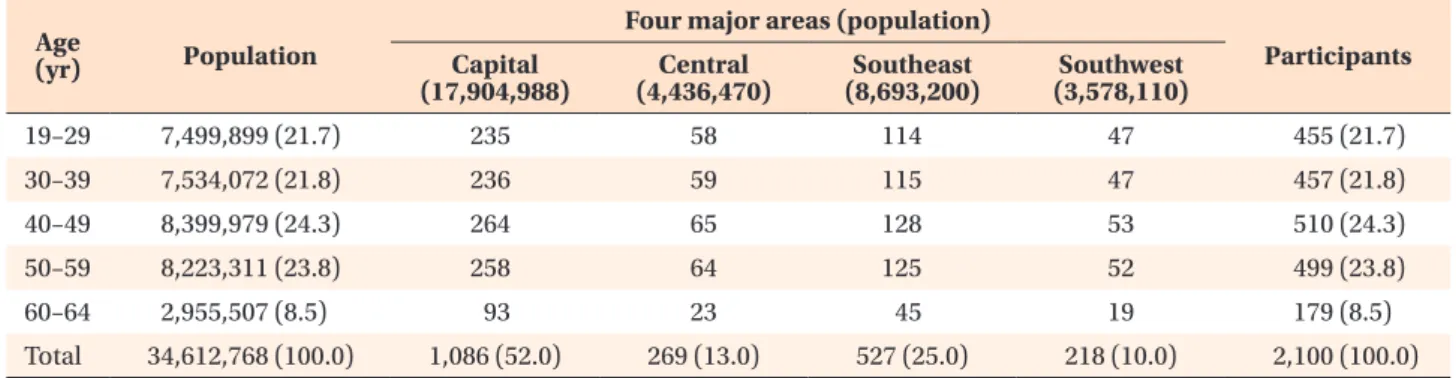
Participant selection was performed in accordance with the distribution of age groups in the population.
Thus, among a total of 34,612,768 adults aged 19–64 years (estimated population in 2016)
7in Korea, the esti- mated sample size required was approximately 2,100. A total of 2,321 participants were enrolled considering a dropout rate of approximately 10%. Quota sampling was conducted in four major areas and grouped according to the age (Table 1). The data were collected using an online survey internet research system from a specialized research organization that is reputed for conducting national surveys or enquete (Macromill Embrain, Seoul, Korea).
Study instrument
A questionnaire developed by Oh et al.
8was used, which assesses the general characteristics, oral hygiene- related characteristics, demand for orthodontic treat- ment, psychosocial impact of dental esthetics, perception regarding orthodontic treatment, and other orthodontic treatment-related parameters. The psychosocial impact of dental esthetics was evaluated using the Psychosocial Impact of Dental Esthetics Questionnaire (PIDAQ) devel- oped by Klages et al.
9and revised by Kang and Kang.
10The dental self-confidence items in the PIDAQ were
Table 1. Sampling of four major areas by age based on 2,016 estimated population (yr) Age Population
Four major areas (population)
Participants Capital
(17,904,988) Central
(4,436,470) Southeast
(8,693,200) Southwest (3,578,110)
19–29 7,499,899 (21.7) 235 58 114 47 455 (21.7)
30–39 7,534,072 (21.8) 236 59 115 47 457 (21.8)
40–49 8,399,979 (24.3) 264 65 128 53 510 (24.3)
50–59 8,223,311 (23.8) 258 64 125 52 499 (23.8)
60–64 2,955,507 (8.5) 93 23 45 19 179 (8.5)
Total 34,612,768 (100.0) 1,086 (52.0) 269 (13.0) 527 (25.0) 218 (10.0) 2,100 (100.0)
Values are presented as number (%) or number only.
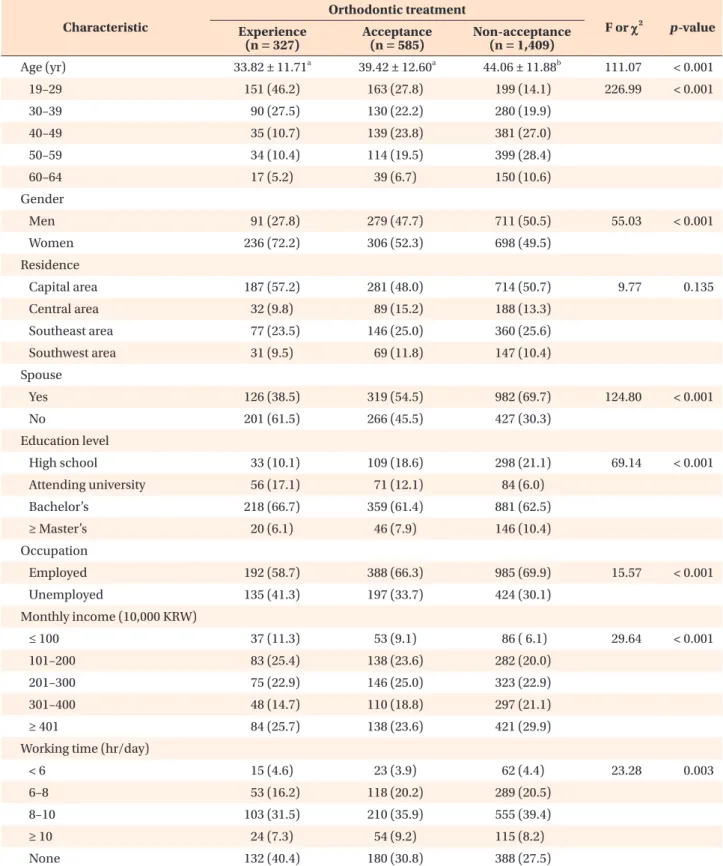
Table 2. Comparison of general characteristics among the three groups (n = 2,321) Characteristic
Orthodontic treatment
F or χχ
2p-value Experience
(n = 327) Acceptance
(n = 585) Non-acceptance (n = 1,409)
Age (yr) 33.82 ± 11.71
a39.42 ± 12.60
a44.06 ± 11.88
b111.07 < 0.001
19–29 151 (46.2) 163 (27.8) 199 (14.1) 226.99 < 0.001
30–39 90 (27.5) 130 (22.2) 280 (19.9)
40–49 35 (10.7) 139 (23.8) 381 (27.0)
50–59 34 (10.4) 114 (19.5) 399 (28.4)
60–64 17 (5.2) 39 (6.7) 150 (10.6)
Gender
Men 91 (27.8) 279 (47.7) 711 (50.5) 55.03 < 0.001
Women 236 (72.2) 306 (52.3) 698 (49.5)
Residence
Capital area 187 (57.2) 281 (48.0) 714 (50.7) 9.77 0.135
Central area 32 (9.8) 89 (15.2) 188 (13.3)
Southeast area 77 (23.5) 146 (25.0) 360 (25.6)
Southwest area 31 (9.5) 69 (11.8) 147 (10.4)
Spouse
Yes 126 (38.5) 319 (54.5) 982 (69.7) 124.80 < 0.001
No 201 (61.5) 266 (45.5) 427 (30.3)
Education level
High school 33 (10.1) 109 (18.6) 298 (21.1) 69.14 < 0.001
Attending university 56 (17.1) 71 (12.1) 84 (6.0)
Bachelor’s 218 (66.7) 359 (61.4) 881 (62.5)
≥ Master’s 20 (6.1) 46 (7.9) 146 (10.4)
Occupation
Employed 192 (58.7) 388 (66.3) 985 (69.9) 15.57 < 0.001
Unemployed 135 (41.3) 197 (33.7) 424 (30.1)
Monthly income (10,000 KRW)
≤ 100 37 (11.3) 53 (9.1) 86 ( 6.1) 29.64 < 0.001
101–200 83 (25.4) 138 (23.6) 282 (20.0)
201–300 75 (22.9) 146 (25.0) 323 (22.9)
301–400 48 (14.7) 110 (18.8) 297 (21.1)
≥ 401 84 (25.7) 138 (23.6) 421 (29.9)
Working time (hr/day)
< 6 15 (4.6) 23 (3.9) 62 (4.4) 23.28 0.003
6–8 53 (16.2) 118 (20.2) 289 (20.5)
8–10 103 (31.5) 210 (35.9) 555 (39.4)
≥ 10 24 (7.3) 54 (9.2) 115 (8.2)
None 132 (40.4) 180 (30.8) 388 (27.5)
Values are presented as mean ± standard deviation or number (%).
Analysis of variance and Post-hoc analyses (Scheffe test for continuous variables and Chi-square test for categorical cariables) were performed.
KRW, Korean won.
a,b
Different letters indicate statistically significant differences (same row).
analyzed by converting item into positive questions.
Data analysis
The actual values and percentages were calculated for categorical variables, and descriptive statistics (mean and standard deviation) were used for continuous variables.
The participants were divided into the following groups based on their experience of and willingness to undergo orthodontic treatment: experience, acceptance, and non-acceptance groups. The characteristics of the par- ticipants were compared using analysis of variance for general characteristics, oral hygiene-related character- istics, demand for orthodontic treatment, psychosocial impact of dental esthetics, and perceptions regarding orthodontic treatment. Post-hoc analysis was performed using Scheffe and chi-square (χ
2) tests.
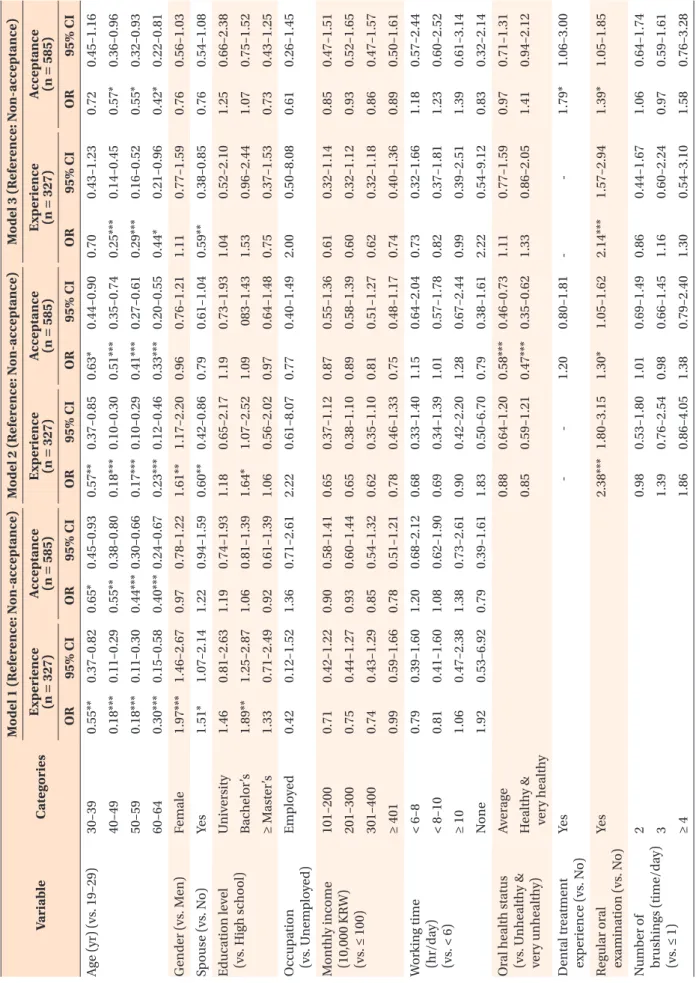
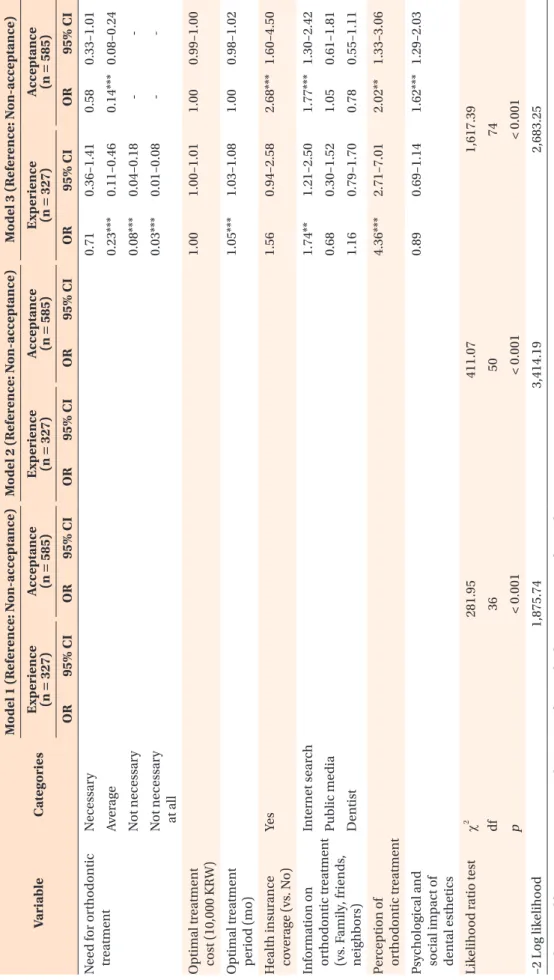
To identify the factors that influenced the orthodontic treatment decisions in adults, multinomial logistic re- gression analysis using forward selection was performed.
In the regression analysis, only variables with a p-value of < 0.05 were used in the univariate analysis and the fit of the model was verified using the Hosmer–Lemeshow test. A multinomial logistic regression analysis was per- formed with the non-acceptance group as a reference for three models—the effects of general characteristics in the experience and acceptance groups (Model 1), the ef- fects of general and oral hygiene-related characteristics in the experience and acceptance groups (Model 2), and
the effects of general and oral hygiene-related charac- teristics, demand for orthodontic treatment, psychosocial impact of dental esthetics, and perceptions regarding orthodontic treatment in the experience and acceptance groups (Model 3). The results are presented as odds ratios (ORs) and 95% confidence intervals. Statistical analyses were performed using IBM SPSS ver. 21.0 (IBM Corp., Armonk, NY, USA).
RESULTS
The data on demographic characteristics, oral hygiene- related characteristics, demand for orthodontic treat- ment, perceptions regarding orthodontic treatment, and psychosocial impact of dental esthetics are shown in Supplementary Tables 1–4. The questionnaire results were divided into three groups according to the inten- tion to begin orthodontic treatment, and the differ- ences in the aforementioned factors are shown in Tables 2–5. Supplementary data is available at https://doi.
org/10.4041/kjod.2021.51.1.3
Comparison of participant characteristics according to the intention to seek orthodontic treatment
General characteristics
The distribution analysis of general characteristics showed significant intergroup differences for all items,
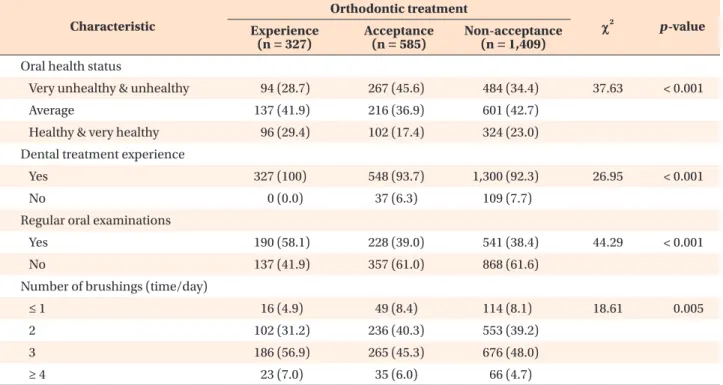
Table 3. Comparison of oral hygiene-related characteristics among the three groups (n = 2,321) Characteristic
Orthodontic treatment
χχ
2p-value Experience
(n = 327) Acceptance
(n = 585) Non-acceptance (n = 1,409) Oral health status
Very unhealthy & unhealthy 94 (28.7) 267 (45.6) 484 (34.4) 37.63 < 0.001
Average 137 (41.9) 216 (36.9) 601 (42.7)
Healthy & very healthy 96 (29.4) 102 (17.4) 324 (23.0) Dental treatment experience
Yes 327 (100) 548 (93.7) 1,300 (92.3) 26.95 < 0.001
No 0 (0.0) 37 (6.3) 109 (7.7)
Regular oral examinations
Yes 190 (58.1) 228 (39.0) 541 (38.4) 44.29 < 0.001
No 137 (41.9) 357 (61.0) 868 (61.6)
Number of brushings (time/day)
≤ 1 16 (4.9) 49 (8.4) 114 (8.1) 18.61 0.005
2 102 (31.2) 236 (40.3) 553 (39.2)
3 186 (56.9) 265 (45.3) 676 (48.0)
≥ 4 23 (7.0) 35 (6.0) 66 (4.7)
Values are presented as number (%).
Analysis of variance and Post-hoc analyses (Chi-square test) were performed.
except the areas of residence. The proportion of younger adults, unmarried adults, and women was higher among participants who wished to undergo orthodontic treat- ment than in those who did not. In addition, partici- pants with higher incomes and married status had a low interest in seeking orthodontic treatment (Table 2).
Oral hygiene-related characteristics
The distribution analysis of oral hygiene-related char- acteristics showed significant intergroup differences for all items. Participants who perceived that their oral health was poor wished to seek orthodontic treatment, while participants who had experienced orthodontic
treatment had good oral health and were interested in orthodontic treatment (Table 3).
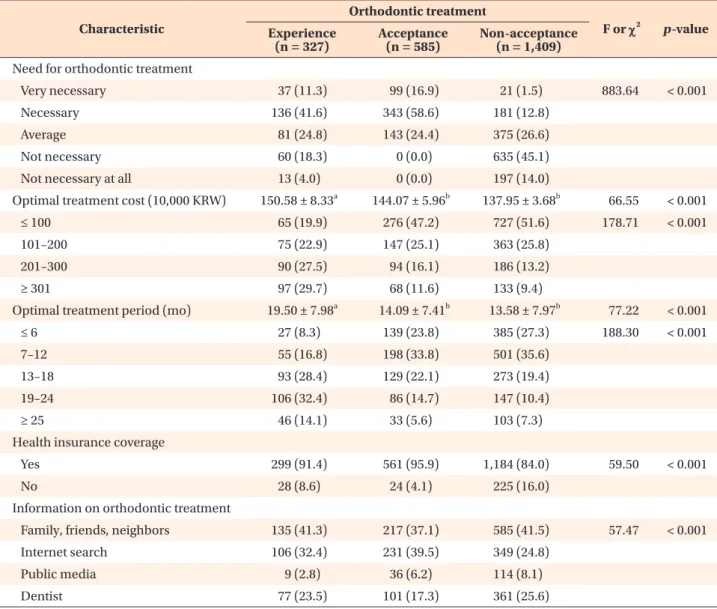
Demand for orthodontic treatment
The distribution analysis of the demand for orthodon- tic treatment showed significant intergroup differences for all items. Participants who had an experience of orthodontic treatment had an understanding of the cost and duration of orthodontic treatment (Table 4).
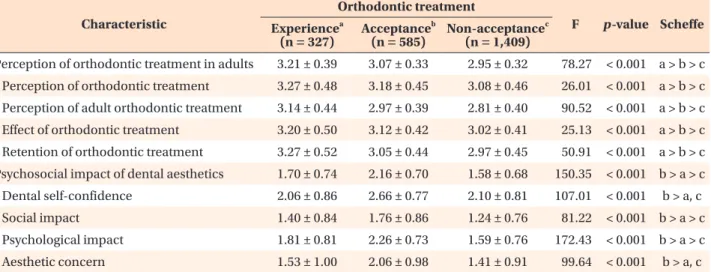
Perceptions regarding orthodontic treatment and psy- chosocial impact of dental esthetics
The distribution analysis of perceptions regarding
Table 4. Comparison of demand for orthodontic treatment among the three groups (n = 2,321) Characteristic
Orthodontic treatment
F or χχ
2p-value Experience
(n = 327) Acceptance
(n = 585) Non-acceptance (n = 1,409) Need for orthodontic treatment
Very necessary 37 (11.3) 99 (16.9) 21 (1.5) 883.64 < 0.001
Necessary 136 (41.6) 343 (58.6) 181 (12.8)
Average 81 (24.8) 143 (24.4) 375 (26.6)
Not necessary 60 (18.3) 0 (0.0) 635 (45.1)
Not necessary at all 13 (4.0) 0 (0.0) 197 (14.0)
Optimal treatment cost (10,000 KRW) 150.58 ± 8.33
a144.07 ± 5.96
b137.95 ± 3.68
b66.55 < 0.001
≤ 100 65 (19.9) 276 (47.2) 727 (51.6) 178.71 < 0.001
101–200 75 (22.9) 147 (25.1) 363 (25.8)
201–300 90 (27.5) 94 (16.1) 186 (13.2)
≥ 301 97 (29.7) 68 (11.6) 133 (9.4)
Optimal treatment period (mo) 19.50 ± 7.98
a14.09 ± 7.41
b13.58 ± 7.97
b77.22 < 0.001
≤ 6 27 (8.3) 139 (23.8) 385 (27.3) 188.30 < 0.001
7–12 55 (16.8) 198 (33.8) 501 (35.6)
13–18 93 (28.4) 129 (22.1) 273 (19.4)
19–24 106 (32.4) 86 (14.7) 147 (10.4)
≥ 25 46 (14.1) 33 (5.6) 103 (7.3)
Health insurance coverage
Yes 299 (91.4) 561 (95.9) 1,184 (84.0) 59.50 < 0.001
No 28 (8.6) 24 (4.1) 225 (16.0)
Information on orthodontic treatment
Family, friends, neighbors 135 (41.3) 217 (37.1) 585 (41.5) 57.47 < 0.001
Internet search 106 (32.4) 231 (39.5) 349 (24.8)
Public media 9 (2.8) 36 (6.2) 114 (8.1)
Dentist 77 (23.5) 101 (17.3) 361 (25.6)
Values are presented as number (%) or mean ± standard deviation.
Analysis of variance and Post-hoc analyses (Scheffe test for continuous variables and Chi-square test for categorical cariables) were performed.
KRW, Korean won.
a,b