The comparison in daily intake of nutrients, dietary habits and body composition of female college students by body mass index
Myung-Soo Ko §
Department of Bio Science, Silla University Korea Food & Drug Administration 194 Togilro, Eunpyeong, Seoul 122-704, Korea
Received April 17, 2007; Revised June 1, 2007; Accepted June 11, 2007
Abstract
The purpose of this study was to investigate differences in the body composition, dietary habits, daily intake of nutrients and clinical blood indices in female college students by body mass index of normal weight, overweight and obese. The subjects of this research were 141 respondents of a survey carried out on students, and subjects were given 60 minutes to answer questionnaires, by recording their own answers. The average heights and weights of subjects by BMI were 162.17 cm, 52.73 kg in normal weight group, 162.35 cm, 62.22 kg in overweight group and 161.72 cm, 69.82 kg in obesity group, respectively. As for the survey daily of meals, starving breakfast and kind of snacks of subjects were significantly different among the groups by BMI. In animal protein food intakes, meat intake was the highest ‘every day’ food consumed by subjects, and there was a significant difference in distribution of BMI among subjects. Fruits, and greenish and yellow vegetables intakes were the highest ‘every day’
foods indicated by the normal weight group. Consumption of carbonated beverages and juices showed a significant difference among groups by BMI. The average of total-cholesterol was the overweight group was the higher value. There was a significant difference in diastolic blood pressure and systolic blood pressure among the groups by BMI. Average daily calories intake levels were insufficient and the intake ratio of carbohydrates, protein, and fat was the normal weight group 68:17:15, the overweight group 64:18:18 and the obese group 73:14:13. Results of the daily vitamin intake analyses displayed riboflavin, niacin, vitamin C, and folic acid levels lower than the RI levels. Fe intake was the normal weight group 81%, overweight group 76%, obese group 59% of the RI level. Therefore, it is necessary for college students to establish regular meals, good quality snacks and consuming more vitamin and mineral nutritions for optimal health conditions.
Key Words: Body mass index, dietary habits, daily intake of nutrients, female college
Introduction 9)
The rapid changes of today’s society brought along a change in our lifestyles and as the standard of living has increased, our tables have become abundant with richer food. However this energy converts into fat and then accumulates as body fat (Bray, 1979).
According to the World Health Organization (1994), “obesity is one of today’s most blatantly visible - yet most neglected - public health problems. Paradoxically coexisting with undernu- trition, an escalating global epidemic of overweight and obesity - “globesity” - is taking over many parts of the world. If immediate action is not taken, millions will suffer from an array of serious health disorders.” In 1995, there were an estimated 200 million obese adults worldwide and another 18 million under-five children classified as overweight (Chang, 1996). As of 2000, the number of obese adults has increased to over 300 million. For both, obesity poses a major risk for serious diet- related non-communicable diseases, including diabetes mellitus, cardiovascular disease, hypertension and stroke, and certain
forms of cancer. Its health consequences range from increased risk of premature death to serious chronic conditions that reduce the overall quality of life. Generally, although men may have higher rates of overweight, women have higher rates of obesity (Lee et al., 1999; Slette & Story, 1997).
Most male students considered that their weights are proper;
on the other hand, most female students considered that their weights are overweight (Lee et al., 2001). Most especially, female university students have much concern about their appearances; they tried many weight reductions without correct information (Kim et al., 1999; Ryu & Yoon, 1999). Conse- quently, problems of dietary habits and nutritional unbalance happened (Park et al., 1997). Obesity can occur at any age, but most cases of obesity start to show in the early years of school during puberty (Kang et al., 1998). Signs of obesity in these stages continue to adulthood and have been proven to result in a high danger of geriatric disease.
Therefore, it would be safe to say that in the early years of college, which marks the beginning of adulthood, it is important to control obesity and to strive to keep physically fit (Na et al.,
§
Corresponding Author: Myung-Soo Ko, Tel. 82-2-380-1317, Fax. 82-2-359-0025, Email. [email protected]
2003). Nutrition education with correct nutritional information may be necessary for college students to establish desirable dietary habits and balanced body images. Therefore, the purpose of the study was to investigate attitude about dietary habits, diversity of food intakes and nutrient intakes by BMI of Korean female college students. This is expected that the results can be used as the basic data to develop and implement the nutrition programs for maintain proper body weight.
Subjects and Methods
Subjects
The subjects of this research were 141 respondents of a survey carried out on students attending a university in Busan, South Korea to investigate the eating habits, dietary intake, and serum conditions of overweight and obese female students. The survey was performed between March 5 and May 30 of 2005.
Contents and methods
Anthropometric data were gathered, eating habits and dietary intake levels were examined, and blood samples were taken. The subjects were categorized into groups - normal weight (18.5≤
BMI<23), overweight (23≤BMI<24.9), and obese (BMI≥25.0) - using the Korean Society for the Study of Obesity’s Body Mass Index (BMI) standards for Asian adults (Korean Society for the Study of Obesity, 2000) and analyzed for differences by obesity levels.
To collect basic information, subjects were given 60 minutes to answer questionnaires based on several established information (Chang & Kim, 2003; Kim et al., 2003; Park & Kim, 2005), by having them record their own answers.
1) General characteristics, dietary habits and lifestyles Subjects were asked to provide information on gender, age, height and weight, average monthly allowance, university depar- tment, residence, sleeping hours, smoking and drinking fre- quency. After measuring the subjects’ heights using an exten- simeter, the subjects’ body compositions - weight, mineral levels, muscle mass and fat levels - were analyzed using Inbody 3.0 (Bio-electrical Impedance Fatness Analyzer, Biospace Co., Ltd).
With this information, BMI was calculated using a weight (kg)/
height (m
2) equation. In order to minimize errors, one trained person measured the waist girth of all the subjects.
2) Eating habits, attitudes, and frequency
Subjects were asked to answer 16 questions on their eating habits and attitudes - meal regularity, amounts, frequency of skipping meals, snacking frequency - and 14 questions on food intake frequency - how much meat, fish, beans, bean products, milk and dairy products, fruits, and vegetables they consumed.
The results were then compared for any differences by obesity levels. Subjects were asked to choose among ‘none’, ‘1-2 times per week’, ‘3-4 times per week’, ‘5-6 times per week’, and ‘every day’.
3) Daily food intake levels
In order to understand the subjects’ nutritional intake levels, subjects were interviewed individually using the 24-hour (one-day) recollection method. Researchers who had received prior training carried out interviews, providing approximates to help subjects recall how much they consumed, in order to examine the types and amount of foods they ate as accurately as possible. Daily energy and nutritional intakes were calculated by inputting the collected nutritional intake data into the professional-use Can-pro (The Korean Nutrition Society, 2002) developed by the Korean Nutrition Society, and compared with EER (Estimated Energy Requirement), RI (Recommended Intake) and AI (Adequate Intake) values provided by KDRIs (Dietary Reference Intakes for Koreans).
4) Measurement of hematological index
After taking fasting blood samples, each serum separated by centrifugal separator was stored under -80℃. Total cholesterol, blood glucose, HDL-C and TG were analyzed automatically.
HDL-C levels were measured using the Young-Dong Diagnostics kit (Young-Dong Diagnostics, Korea).
Statistical analysis
The statistical analysis was conducted using SAS (Statistical Analysis System, ver 8.02, PC package) program. Frequency counts (%), mean and standard deviation were calculated for all variables. For their general descriptions we used the Chi-square to calculate their answer frequency and percentage, and we also analyzed the significant relevancies between them. We have analyzed their weight, height, BMI, and body components with statistics of average standard error. The ANOVA test with a standard p = 0.05 was used for the verification of significant relevance nutrient intake evaluation among the subjects in each group.
Results
General characteristics, anthropometric data and body com-
position of obesity are shown in Table 1. The average age of
the subjects was 21.8 years. The average height and weight of
subjects by BMI were 162.17 cm, 52.73 kg in the normal weight
group, 162.35 cm, 62.22 kg in the overweight group and 161.72
cm, 69.82 kg in the obesity group, respectively. The average
waist by BMI was 68 cm in the normal weight group, 74 cm
in the overweight group and 74 cm in the obesity group. In the
average body composition of obesity, protein was not a
Table 1. Comparisons of anthropometric measurements and body composition (A) and General characteristics (B) of the subjects (A)
Variables NW
1)OW OB F value
3)Height (cm) 162.17 ± 4.94
2)b162.35 ± 2.61
a161.72 ± 5.55
c0.03
Weight (kg) 52.73 ± 5.05
c62.22 ± 2.41
b69.82 ± 4.81
a33.30****
Waist 68.15 ± 3.48
c73.66 ± 0.00
b74.07 ± 5.44
a4.61*
BMI (kg/m
2) 20.05 ± 1.64
c23.61 ± 0.74
b26.69 ± 1.07
a49.68****
Body protein mass (kg) 9.21 ± 0.83
c10.04 ± 0.59
a10.01 ± 1.26
b0.15
Body mineral mass (kg) 2.39 ± 1.31
c2.45 ± 2.68
b2.65 ± 2.34
a5.68*
percent body fat (%) 23.77 ± 6.87
c25.95 ± 2.59
b27.62 ± 2.95
a11.29**
Age (yr) 21.57 ± 1.94
c21.83 ± 1.47
b22.00 ± 1.87
a0.14
(B)
Variables Group NW
1)OW OB Total χ
2test
5)Monthly pocket money (won) 22.79 ± 6.23
2)b26.00 ± 8.22
a14.25 ± 4.35
c- 4.13**
college
Natural Science 15 (17)
4)6 (33) 3 (20) 24 (20)
11.82*
Humanities 33 (37) 3 (17) 3 (20) 39 (32)
Management 6 (7) 0 (0) 0 (0) 6 (5)
Art 30 (33) 9 (50) 3 (20) 42 (35)
Education 6 (7) 0 (0) 3 (20) 9 (7)
Engineering 0 (0) 0 (0) 3 (20) 3 (2)
Residence type
Private residence 78 (90) 18 (100) 6 (40) 102 (86)
14.47**
Boarding oneself 6 (7) 0 (0) 9 (60) 15 (12)
Boarding 3 (3) 0 (0) 0 (0) 3 (2)
*p<0.05, **p<0.01, ****p<0.0001
1)
NW : normal weight OW : overweight OB : obesity
2)
Mean ± SD
3)
Means in a row different superscripts are significantly different at the p<0.05 level by Duncan’s multiple range test
4)
Number (%)
5)
Significance as determinated by student’s chi-square test statistic at p<0.05
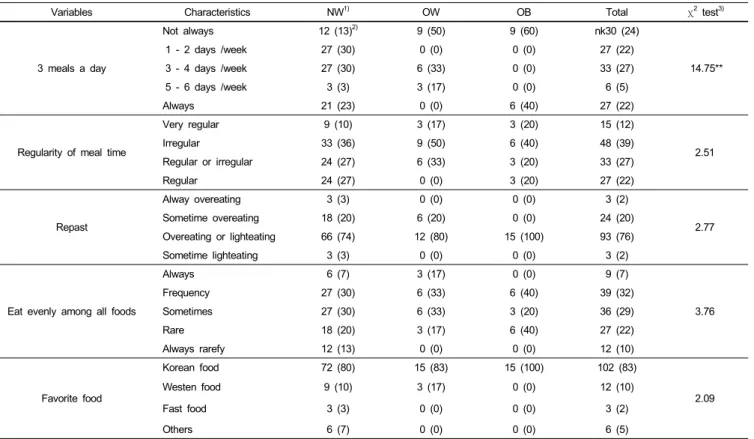
Table 2. Charateristics of each habits of eating in the subjects
Variables Characteristics NW
1)OW OB Total χ
2test
3)3 meals a day
Not always 12 (13)
2)9 (50) 9 (60) nk30 (24)
14.75**
1 - 2 days /week 27 (30) 0 (0) 0 (0) 27 (22)
3 - 4 days /week 27 (30) 6 (33) 0 (0) 33 (27)
5 - 6 days /week 3 (3) 3 (17) 0 (0) 6 (5)
Always 21 (23) 0 (0) 6 (40) 27 (22)
Regularity of meal time
Very regular 9 (10) 3 (17) 3 (20) 15 (12)
2.51
Irregular 33 (36) 9 (50) 6 (40) 48 (39)
Regular or irregular 24 (27) 6 (33) 3 (20) 33 (27)
Regular 24 (27) 0 (0) 3 (20) 27 (22)
Repast
Alway overeating 3 (3) 0 (0) 0 (0) 3 (2)
2.77
Sometime overeating 18 (20) 6 (20) 0 (0) 24 (20)
Overeating or lighteating 66 (74) 12 (80) 15 (100) 93 (76)
Sometime lighteating 3 (3) 0 (0) 0 (0) 3 (2)
Eat evenly among all foods
Always 6 (7) 3 (17) 0 (0) 9 (7)
3.76
Frequency 27 (30) 6 (33) 6 (40) 39 (32)
Sometimes 27 (30) 6 (33) 3 (20) 36 (29)
Rare 18 (20) 3 (17) 6 (40) 27 (22)
Always rarefy 12 (13) 0 (0) 0 (0) 12 (10)
Favorite food
Korean food 72 (80) 15 (83) 15 (100) 102 (83)
2.09
Westen food 9 (10) 3 (17) 0 (0) 12 (10)
Fast food 3 (3) 0 (0) 0 (0) 3 (2)
Others 6 (7) 0 (0) 0 (0) 6 (5)
Table 2. Continued
Variables Characteristics NW
1)OW OB Total χ
2test
3)Duration of meal
5 - 10minute 12 (13) 9 (50) 0 (0) 21 (17)
6.82
10 - 20minute 48 (53) 6 (33) 12 (80) 66 (54)
20 - 30minute 27 (30) 3 (17) 3 (20) 33 (27)
≥30minute 3 (3) 0 (0) 0 (0) 3 (2)
No. of breakfast per week
Not always 9 (10) 6 (33) 6 (40) 21 (17)
7.23
1 - 2 days /week 12 (13) 0 (0) 0 (0) 12 (10)
3 - 4 days /week 18 (20) 6 (33) 3 (22) 27 (22)
5 - 6 days /week 24 (27) 3 (17) 0 (22) 27 (22)
Everyday 27 (30) 3 (17) 6 (29) 36 (29)
Breakfast food eaten
Rice 60 (67) 12 (67) 9 (60) 81 (66)
2.43
Bread 9 (10) 0 (0) 0 (0) 9 (7)
Eating an cooked food 3 (3) 0 (0) 0 (0) 3 (2)
Others 18 (20) 6 (33) 6 (40) 30 (24)
Frequency of snacks
1 time/day 27 (30) 9 (50) 3 (20) 39 (32)
4.97
2 times/ day 30 (33) 6 (33) 6 (40) 42 (34)
3 times/ day 12 (13) 3 (17) 0 (0) 15 (12)
4 times/ day 6 (7) 0 (0) 0 (0) 6 (5)
Others/ day 15 (17) 0 (0) 6 (40) 21 (17)
Snack items
Snack 27 (34) 3 (25) 3 (20) 33 (31)
12.77
Milk 9 (12) 0 (0) 0 (0) 9 (9)
Beverage 18 (23) 6 (50) 3 (20) 27 (26)
Fruits 18 (12) 0 (0) 3 (20) 12 (11)
Others 15 (19) 3 (25) 6 (40) 24 (23)
Frequency of eating after nine
Never 0 (0) 0 (0) 0 (0) 0 (0)
3.49
1 - 2 days /week 12 (13) 3 (20) 0 (0) 15 (13)
3 - 4 days /week 9 (10) 3 (20) 3 (20) 15 (13)
5 - 6 days /week 48 (53) 9 (60) 6 (40) 63 (53)
Always 21 (23) 0 (0) 6 (40) 27 (23)
Frequency food for eating out
1 - 2 days /week 6 (7) 0 (0) 0 (00 6 (5)
11.03*
3 - 4 days /week 15 (17) 6 (33) 0 (0) 21 (17)
5 - 6 days /week 66 (73) 12 (67) 9 (60) 87 (71)
Everyday 3 (3) 0 (0) 6 (40) 9 (7)
Apply salt
Not well salted 3 (3) 0 (0) 0 (0) 3 (2)
2.95
Not Salty enough 27 (30) 6 (33) 9 (60) 42 (34)
Usually 51 (57) 12 (67) 6 (40) 69 (56)
A little of salty 9 (10) 0 (0) 0 (0) 9 (7)
Eating due to stress solution
Never 3 (3) 0 (0) 0 (0) 3 (2)
4.8
No 6 (7) 3 (17) 0 (0) 9 (7)
Sometime 42 (47) 12 (67) 9 (60) 63 (51)
Frequency 21 (23) 3 (17) 6 (40) 30 (24)
Always 18 (20) 0 (0) 0 (0) 18 (15)
Frequency some foods
Instant food 6 (8) 6 (33) 0 (0) 12 (11)
17.79**
Meat 0 (0) 6 (33) 0 (0) 6 (5)
Fruits 9 (16) 0 (0) 0 (0) 9 (8)
Just any 36 (46) 6 (33) 9 (60) 51 (46)
Others 27 (35) 0 (0) 6 (40) 33 (30)
*p<0.05, **p<0.01
1) NW : normal weight OW : overweight OB : obesity 2) Number (%)
3) Significance as determinated by student’s chi-square test statistic at p<0.05
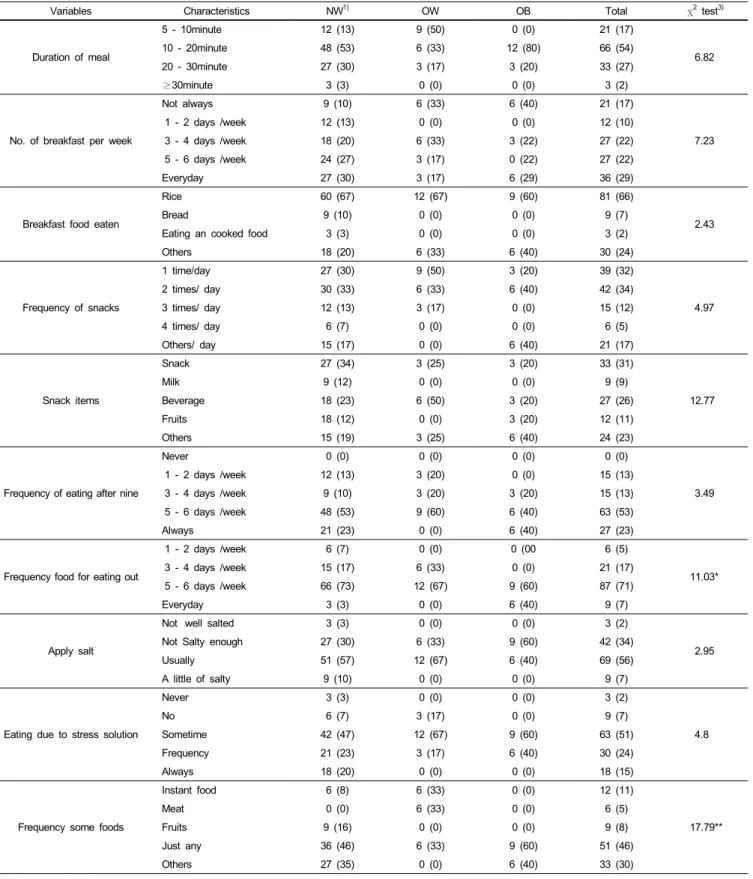
Table 3. Charateristics of each habits of drinking, smoking, exercise in the subjects
Variables Characteristics NW
1)OW OB Total χ
2test
3)Alcohol per week
Never 12 (14)
2)3 (17) 0 (0) 15 (12)
2.66
1∼2 times 15 (17) 3 (17) 0 (0) 18 (15)
3∼4 times 9 (10) 3 (17) 3 (20) 15 (12)
Everyday 33 (38) 6 (34) 9 (60) 48 (40)
Always 18 (21) 3 (17) 3 (20) 24 (20)
Smoking
Yes 9 (10) 0 (0) 0 (0) 9 (7)
2.58
No 72 (80) 18 (100) 15 (100) 105 (85)
Used smoke 9 (10) 0 (0) 0 (0) 9 (7)
Excercise
No 36 (40) 9 (50) 0 (0) 45 (36)
8.95*
1∼2 times/month 9 (10) 0 (0) 0 (0) 9 (7)
1 times/week 15 (17) 0 (0) 6 (40) 21 (17)
≥2 times/week 18 (20) 9 (50) 6 (40) 33 (27)
Everyday 12 (13) 0 (0) 3 (10) 15 (12)
Time to sleep
11 clock 6 (7) 0 (0) 0 (0) 6 (5)
4.11
11-12 clock 24 (27) 3 (17) 3 (20) 30 (25)
12-1 clock 30 (34) 3 (17) 3 (20) 36 (30)
1-2 clock 6 (7) 3 (17) 3 (20) 12 (10)
2 clock 21 (24) 9 (50) 6 (40) 36 (30)
*p<0.05
1)
NW : normal weight OW : overweight OB : obesity
2)
Number (%)
3)
Significance as determinated by student’s chi-square test statistic at p<0.05
significant difference among groups by BMI. But the average percent body fat was a significant difference in distribution of BMI among subjects and the more obese was the higher value.
In general characteristics, college, monthly pocket money and residence type were a significant difference in distribution of BMI among subjects. The higher rates of BMI were shown in the natural sciences and arts, and education degree students, where much pocket money and self-boarding prevailed.
Table 2 shows the results of a survey of daily meal habits, skipping breakfast and snacking by subjects. Daily meals were a significant difference among groups by BMI. The obese group showed sharp polarization between ‘not always’ and ‘always.’
In a survey on regularity of mealtimes, the normal group displayed considerable regularity compared to overweight or obese groups, while there was no purposive relationship between each group. Regarding meal portions, all groups answered
‘overeating or light eating.’ In food preferences, ‘Korean’ was in favor among all groups, while in eating rate, ‘10-20 minutes’
was in favor among all groups. Regarding frequency of skipping breakfast, all groups were shown to skip breakfast relatively frequently. When they did have breakfast, rice was the most favored among all groups. In daily snacking frequency, 66% of the subjects responded ‘1-2 times/per’ in a day while snacks (31%) and beverages (26%) were the prevalent answers regarding snack types. There were no significant differences in frequency daily snacking among groups. Meanwhile, the normal weight group was shown to eat fruits and drink milk as well. When asked how frequently they ate dinner after 9 p.m., the obese group
was found to have frequent late dinners, while there was no purposive relationship between the groups. When asked how frequently they ate food to relieve stress or frustration,
‘sometimes,’ was the answer chosen by 51% of the subjects, followed by ‘frequently’ at 26%. Regarding overall food pre- ference, there was no purposive relationship among the groups.
The obese group was generally shown to eat indiscriminately, without much attachment to particular foods, while the overweight group was shown to favor instant foods and meat.
The evening meal after nine was shown among all subjects and did not make a significant difference among groups by BMI.
The shorter duration of meals showed a higher rate of BMI and did not show a significant difference in distribution of BMI among the subjects. As for breakfast food eaten, skipping breakfast of obese groups was the highest value, and did not show a significant difference among groups by BMI.
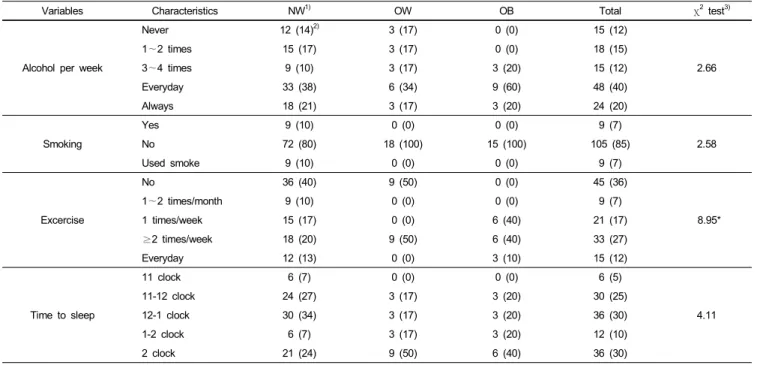
Alcohol intake, smoking and exercise of BMI among subjects are shown in Table 3. As for alcohol intake it was the highest 'every day' by subjects, but there was no significant difference in distribution of BMI among subjects. As for smoking, all subjects showed the highest 'not' responses. As for exercise, the more obesity there was the lower the value of exercise, and there was a significant difference in distribution of BMI among subjects (p<0.05). The sleeping hour of health-related items of all subjects was wanted at 12∼01 hours, and there was a significant difference among groups by BMI. (p<0.05).
Food intake according to BMI is shown in Table 4. In animal
protein food intakes, meat intake was the highest ‘every day’
Table 4. Charateristics of each habits of foods in the subject
Variables Characteristics NW
1)OW OB Total χ
2test
3)Meat
Never 0 (0)
2)0 (0) 0 (0) 0 (0)
16.03**
1 - 2 days /week 0 (0) 6 (33) 0 (0) 6 (5)
3 - 4 days /week 15 (17) 6 (33) 0 (0) 21 (17)
Everyday 69 (77) 6 (33) 15 (100) 90 (33)
≥ 2 /day 6 (7) 0 (0) 0 (0) 6 (5)
Kind of meat
Beef 0 (0) 0 (0) 0 (0) 0 (0)
0.17
Pork 39 (50) 12 (60) 6 (50) 54 (51)
A pock hock 0 (0) 0 (0) 0 (0) 0 (0)
Chicken 39 (50) 6 (40) 6 (50) 51 (49)
Fish
Never 9 (10) 6 (33) 0 (0) 15 (12)
5.37
1 - 2 days /week 63 (70) 9 (50) 15(100) 87 (70)
3 - 4 days /week 12 (14) 3 (17) 0 (0) 15 (12)
Everyday 3 (3) 0 (0) 0 (0) 3 (2)
≥ 2 /day 3 (3) 0 (0) 0 (0) 3 (2)
Kind of fish
Wite fish 18 (20) 6 (33) 3 (20) 27 (22)
3.62
Blue fish 18 (20) 3 (17) 3 (20) 24 (19)
Crustacea 6 (7) 3 (17) 0 (0) 9 (7)
All 36 (40) 3 (17) 9 (60) 48 (39)
Others 12 (13) 3 (17) 0 (0) 15 (12)
Eggs
Never 6 (7) 0 (0) 0 (0) 6 (5)
8.17*
1 - 2 days /week 66 (73) 9 (50) 6 (40) 81 (66)
3 - 4 days /week 18 (20) 6 (33) 6 (40) 30 (24)
Everyday 0 (0) 3 (17) 3 (20) 6 (5)
Milk
Never 3 (3) 0 (0) 0 (0) 3 (2)
4.48
1 - 2 days /week 36 (40) 12 (67) 6 (40) 54 (44)
3 - 4 days /week 24 (27) 13 (17) 3 (20) 30 (24)
Everyday 18 (20) 0 (0) 6 (40) 24 (19)
≥ 2 /day 9 (10) 3 (17) 0 (0) 12 (9)
Milk products
Never 9 (10) 0 (0) 3 (20) 12 (10)
11.31
1 - 2 days /week 54 (60) 15 (83) 6 (40) 75 (61)
3 - 4 days /week 18 (20) 3 (17) 0 (0) 21 (17)
Everyday 9 (10) 0 (0) 3 (20) 12 (10)
≥ 2 /day 0 (0) 0 (0) 3 (20) 3 (2)
Fat
Never 3 (3) 0 (0) 3 (20) 6 (5)
10.23*
1 - 2 days /week 57 (63) 12 (67) 0 (0) 69 (56)
3 - 4 days /week 9 (10) 3 (17) 6 (40) 18 (15)
Everyday 15 (17) 3 (17) 3 (20) 21 (17)
≥ 2 /day 6 (7) 0 (0) 3 (20) 9 (7)
Kind of fat
Oil 69 (82) 12 (82) 15 (100) 94 (84)
4.08
Batter 9 (11) 0 (0) 0 (0) 9 (8)
Mayoonnaise 3 (3) 3 (20) 0 (0) 6 (5)
Dessing 3 (3) 0 (0) 0 (0) 3 (3)
Bean
Never 24 (27) 3 (17) 3 (20) 30 (24)
4.48
1 - 2 days /week 42 (47) 9 (50) 6 (40) 57 (46)
3 - 4 days /week 9 (10) 3 (17) 0 (0) 12 (9)
Everyday 9 (10) 3 (17) 6 (40) 18 (15)
≥ 2 /day 6 (7) 0 (0) 0 (0) 6 (5)
Table 4. Continued
Variables Characteristics NW
1)OW OB Total χ
2test
3)Vegetables
Never 3 (3) 0 (0) 0 (0) 3 (2)
7.91
1 - 2 days /week 18 (20) 6 (33) 0 (0) 24 (19)
3 - 4 days /week 6 (7) 0 (0) 6 (40) 12 (9)
Everyday 33 (37) 6 (33) 3 (20) 42 (34)
≥ 2 /day 30 (33) 6 (33) 6 (40) 42 (34)
Greenish yellow
Never 6 (7) 0 (0) 0 (0) 6 (5)
4.79
1 - 2 days /week 30 (34) 9 (50) 0 (0) 39 (32)
3 - 4 days /week 15 (17) 3 (17) 6 (40) 24 (20)
Everyday 24 (27) 3 (17) 6 (40) 33 (27)
≥ 2 /day 12 (14) 3 (17) 3 (20) 18 (15)
Fruits
Never 3 (3) 0 (0) 3 (20) 6 (5)
7.09
1 - 2 days /week 33 (37) 6 (33) 6 (40) 45 (36)
3 - 4 days /week 15 (17) 9 (50) 3 (20) 27 (22)
Everyday 30 (33) 3 (17) 3 (20) 36 (29)
≥ 2 /day 9 (10) 0 (0) 0 (0) 9 (7)
Drinking water
Never 3 (7) 6 (33) 0 (0) 9 (7)
18.07**
1 - 2 days /week 33 (37) 6 (33) 3 (20) 42 (34)
3 - 4 days /week 42 (47) 6 (33) 3 (20) 51 (41)
Everyday 12 (13) 0 (0) 6 (40) 18 (15)
≥ 2 /day 0 (0) 0 (0) 3 (20) 3 (2)
*p<0.05, **p<0.01
1)
NW : normal weight OW : overweight OB : obesity
2)
Number (%)
3)
Significance as determinated by student’s chi-square test statistic at p<0.05
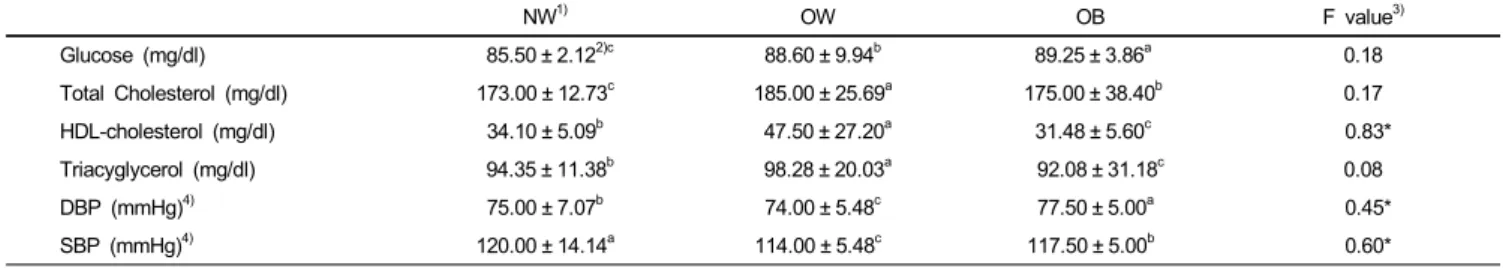
Table 5. Hematological index of nutrients in the subjects
NW
1)OW OB F value
3)Glucose (mg/dl) 85.50 ± 2.12
2)c88.60 ± 9.94
b89.25 ± 3.86
a0.18
Total Cholesterol (mg/dl) 173.00 ± 12.73
c185.00 ± 25.69
a175.00 ± 38.40
b0.17
HDL-cholesterol (mg/dl) 34.10 ± 5.09
b47.50 ± 27.20
a31.48 ± 5.60
c0.83*
Triacyglycerol (mg/dl) 94.35 ± 11.38
b98.28 ± 20.03
a92.08 ± 31.18
c0.08
DBP (mmHg)
4)75.00 ± 7.07
b74.00 ± 5.48
c77.50 ± 5.00
a0.45*
SBP (mmHg)
4)120.00 ± 14.14
a114.00 ± 5.48
c117.50 ± 5.00
b0.60*
*p<0.05
1)
NW : normal weight OW : overweight OB : obesity
2)
Mean ± SD
3)
Means in a row different superscripts are significantly different at the p<0.05 level by Duncan′s multiple range test
4)
SBP : systolic blood pressure, DBP : diastolic blood pressure
food consumed by subjects, and there was a significant difference in distribution of BMI among subjects. Pork and chicken particularly were highly favored. Fish intake was higher ‘1-2 days/week’ food favored by subjects. Egg consumption was also higher ‘1-2 times/week’ food favored by subjects, and there was a significant difference in distribution of BMI among subjects.
Generally, animal protein food consumption was indicated as ‘1-2 times/week’ by subjects. Milk and dairy products were the higher
‘1-2 times/week’ food favored by subjects, Fat intake was the higher ‘1-2 times/week food favored by subjects. There was a significant difference among groups by BMI, and the obesity group was the highest. The vegetable oil of these, particularly, was high preference. Bean intake was the lower value in terms
of protein foods. Fruits, and greenish and yellow vegetables intake were the highest ‘every day’ foods indicated by normal weight group. Consumption of carbonated beverages and juices showed a significant difference among groups by BMI. Obesity was particularly higher among the 'every day' category.
Table 5 shows the results of a survey of the hematological index of subjects. The average glucose and total cholesterol were higher than normal value by subjects, and there were no significant differences among groups by BMI. The average of HDL-cholesterol was 34.10 ± 5.09 mg/dl in the normal weight group, 47.50 ± 27.20 mg/dl in the overweight group and 31.48
± 5.60 mg/dl in the obesity group. The more obese group
particularly was the higher value, and there were significant
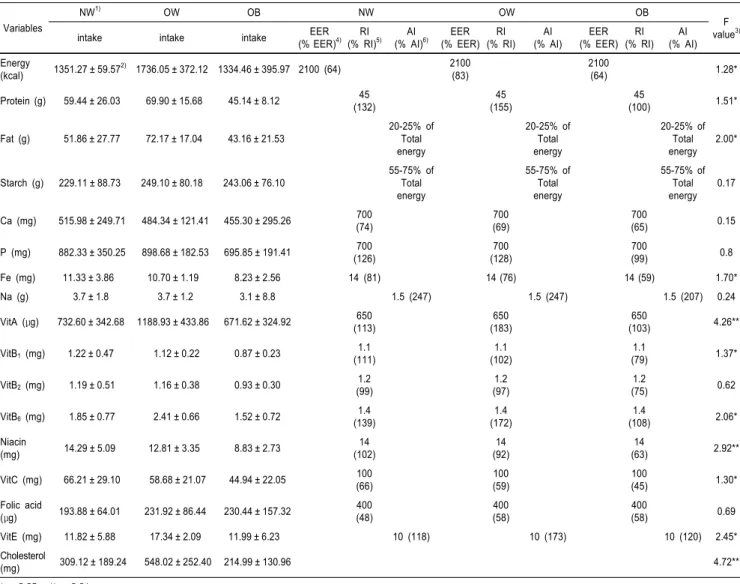
Table 6. Dietary intackes of nutrients in the subjects Variables
NW
1)OW OB NW OW OB
F value
3)intake intake intake EER
(% EER)
4)RI (% RI)
5)AI (% AI)
6)EER (% EER)
RI (% RI)
AI (% AI)
EER (% EER)
RI (% RI)
AI (% AI) Energy
(kcal) 1351.27 ± 59.57
2)1736.05 ± 372.12 1334.46 ± 395.97 2100 (64) 2100 (83)
2100
(64) 1.28*
Protein (g) 59.44 ± 26.03 69.90 ± 15.68 45.14 ± 8.12 45
(132) 45
(155) 45
(100) 1.51*
Fat (g) 51.86 ± 27.77 72.17 ± 17.04 43.16 ± 21.53
20-25% of Total energy
20-25% of Total energy
20-25% of Total energy 2.00*
Starch (g) 229.11 ± 88.73 249.10 ± 80.18 243.06 ± 76.10
55-75% of Total energy
55-75% of Total energy
55-75% of Total energy
0.17
Ca (mg) 515.98 ± 249.71 484.34 ± 121.41 455.30 ± 295.26 700
(74) 700
(69) 700
(65) 0.15
P (mg) 882.33 ± 350.25 898.68 ± 182.53 695.85 ± 191.41 700 (126)
700 (128)
700
(99) 0.8
Fe (mg) 11.33 ± 3.86 10.70 ± 1.19 8.23 ± 2.56 14 (81) 14 (76) 14 (59) 1.70*
Na (g) 3.7 ± 1.8 3.7 ± 1.2 3.1 ± 8.8 1.5 (247) 1.5 (247) 1.5 (207) 0.24
VitA (μg) 732.60 ± 342.68 1188.93 ± 433.86 671.62 ± 324.92 650
(113) 650
(183) 650
(103) 4.26**
VitB
1(mg) 1.22 ± 0.47 1.12 ± 0.22 0.87 ± 0.23 1.1 (111)
1.1 (102)
1.1
(79) 1.37*
VitB
2(mg) 1.19 ± 0.51 1.16 ± 0.38 0.93 ± 0.30 1.2 (99)
1.2 (97)
1.2
(75) 0.62
VitB
6(mg) 1.85 ± 0.77 2.41 ± 0.66 1.52 ± 0.72 1.4 (139)
1.4 (172)
1.4
(108) 2.06*
Niacin
(mg) 14.29 ± 5.09 12.81 ± 3.35 8.83 ± 2.73 14
(102)
14 (92)
14
(63) 2.92**
VitC (mg) 66.21 ± 29.10 58.68 ± 21.07 44.94 ± 22.05 100
(66) 100
(59) 100
(45) 1.30*
Folic acid
(μg) 193.88 ± 64.01 231.92 ± 86.44 230.44 ± 157.32 400 (48)
400 (58)
400
(58) 0.69
VitE (mg) 11.82 ± 5.88 17.34 ± 2.09 11.99 ± 6.23 10 (118) 10 (173) 10 (120) 2.45*
Cholesterol
(mg) 309.12 ± 189.24 548.02 ± 252.40 214.99 ± 130.96 4.72**
*p<0.05, **p<0.01
1)
NW : normal weight OW : overweight OB : obesity
2)
Mean ± SD
3)
Means in a row different superscripts are significantly different at the p<0.05 level by Duncan’s multiple range test
4)
Estimated Energy Requirement. Values are expressed as EER amount (% EER of intake)
5)
Recommended Intake based on Dietary reference intakes for Koreans (2005). Values are expressed as RI amount (% RI of Intake)
6)