Financial Analyses for Value Maximization of KOSDAQ Listed
Firms in Chungcheong Province in the Korean Capital Market
Hanjoon Kim
Division of Business Administration, Hoseo University
충청권 소재 코스닥 상장 기업들의 가치 극대화를 위한
재무적 요인 분석
호서대학교 경영대학 경영학부김한준
Abstract Given the dynamics of the changing economic or financial conditions in Chungcheong province in the domestic capital market, foreign and domestic investments are expected to continually increase their investments in volume and size in this particular province. Considering the unprecedented business climate, it may be essential to examine the primary financial aspects, such as corporate profitability, growth rate, and capital structure, which may work as effective catalysts to enhance corporate value.
Concerning the outcomes, five proposed variables, such as market-value based leverage ratio, growth rate, Tobin's Q, business risk, and R&D intensity, highlighted the significant effects to determine the current level of profitability. Moreover, two variables, such as profitability and firm size, shared commonalities to discriminate between firms in the Chungcheong province (96 firms) and their counterparts (746 firms) in the other domestic provinces in terms of the growth rate and financial leverage. In contrast, three variables, including the interaction effect and firm size, had pronounced effects on profitability. The results of the study are expected to help enhance the corporate value in Chungcheong province by controlling the level of each significant factor.
요 약 국내 자본시장에서 충청권 지역의 최근의 경제 혹은 재무적인 여건 변화들을 기준으로, 동 지역에 대한 해외 및 국내 투자 규모는 향후에도 지속적으로 증가 할 것으로 예상된다. 이와 같은 전례 없는 변화된 환경을 고려하여, 본 연구에서는 동 지역권 소재 기업들의 가치 제고를 위한 3가지의 주요한 재무적 지표들, 즉, 기업의 수익성, 성장률 및 자본구조에 대한 종합적인 상호 비교 분석을 위하여, 각 재무적 지표들을 구성하고 있는 각각의 요인들이 실증적으로 검정되었다. 실증연구를 수행하기 위한 연구 설정 방법과 관련하여, 검정 결과와 관련하여, 시장 가치 기준의 부채비율, 성장률, 토빈 Q 비율, 사업위험도 그리고 연구개발비 비중 등의 총 5 가지 변수들이 충청권 지역에 속한 기업들의 수익 성을 결정하는 유의한 재무적 요인들로서 판명되었다. 또한, 기업 성장률과 자본구조의 재무적 지표들을 분석한 결과, 수익성과 기업 규모의 2가지 변수들이 국내 자본시장 내에서 해당지역과 타 비교지역들 소재의 기업들을 통계적으로 구분하는 유의성있는 요인으로 판명되었다. 본 연구의 결과를 기준으로, 상기 서술된 재무적 지표들에 영향을 줄 수 있는 해당 요인들의 수준을 실무적으로 조정할 경우, 충청권 소재 기업들의 가치 향상에 궁극적으로 기여할 것으로 기대된다.
Keywords : Chungcheong Province, Financial Aspects, Korean Capital Market, KOSDAQ Listed Firms, Panel Data Mod
This research was supported by the Academic Research Fund of Hoseo University in 2019. (#20190815)
*Corresponding Author : Hanjoon Kim(Hoseo Univ.) email: [email protected]
Received September 8, 2020 Revised September 29, 2020 Accepted October 5, 2020 Published October 31, 2020
1. Introduction
In this study, comprehensive analyses on the financial status quo aspects are empirically conducted for firms listed on KOSDAQ (Korea Securities Dealers Automated Quotation) exchange in the Korean capital market during the post global financial turmoil era. As one of the distinguished factors which may differentiated from the preceding research on the analogous subject, this research focuses on firms with headquarters in Chungcheong province. Provincial areas of the sample firms comprehends North Chungcheong and South Chungcheong provinces, Daejeon Metropolitan City and Sejong Metropolitan Autonomous City in the domestic capital market. As described in [1], given the dynamics of the current socio-economic and demographic phenomena of the province, more academic and practical attention needs to be paid to financial aspects of the region in relation to business environments such as education and information technology.
Moreover, Sejong Metropolitan Autonomous City as a capital city of the Korean government that is geographically located in Chungcheong province, tends to play a major role to have a unprecedented demographic factor inducing larger population, that may results in a higher level of financial infrastructure. The primary objective of the study is to identify financial components to determine each primary financial aspect (i.e., profitability, growth rate and capital structure) toward value-maximization of firms with headquarters in the province. It was officially reported that firms with headquarters in South Chungcheong province, that belong to non-financial profit organizations, overall under-performed in the financing aspects of profitability on a year over year (YOY) basis, whereas the other two financial conditions such as growth rate and capitall structure (i.e., debt ratio) were over-performed between the two
comparing period, respectively. [2] To specify, annual growth rate in sale increased by 7.6%
points and debt ratio, on average, decreased by 6.9%p, while profitability measured by the ratio of operating profit to sales deteriorated to the level of 6.6% from the previous level of 7.1%.
Likewise, corporations in manufacturing industries, located in North Chungcheong province, on average, under-performed in terms of profitability that decreased from 4.7% to 4.4%
(YOY), while both of the growth rate and the financial leverage were overall improved. [3] In comparison with those of all KOSDAQ-listed sample firms located in the entire Korean capital market, the former group (i.e. firms in South Chungcheong province) maintained overall relatively a high debt ratio during the year 2017 and the latter group also recorded its inferior growth rate and debt ratio.
Followings are major motivations to conduct this empirical research, that is associated with achieving the aforementioned financial objective of the study. First, as an extension of the previous research inclusive of [1], by utilizing the updated data, results obtained from the present study are expected to contribute to comprehensive examinations on the major financial aspects. To specify, the time reference adopted in the study covers from 2010 to 2018 (for 9 years) after the global financial turmoil.
This is to avoid or mitigate any spill-over effects associated with the economic crisis, as also presented in [1]. Given that a majority of firms in Chungcheong province seem to be engaged in IT related businesses, only KOSDAQ-listed firms (rather than employing their counterparts of KOSPI listed ones,) are used to be tested in this study. Moreover, there are less research conducted on the current issue of this paper in spite of the on-going dynamics related to the particular region. Second, several major and relevant hypotheses are postulated and tested to examine financial aspects of the sample firms in
the regional area, whose results are compared to those obtained from preceding studies in the international and domestic perspectives. To derive the outcome of each hypothesis test in a robust and consistent manner, various methodologies are applied for estimation, as explicated in the following section. To exemplify, static panel data model, Tobit regression model and stepwise regression model are employed for an absolute basis, while binary dependent variable models such as logit, probit and complementary log-log (CLOG) model are also separately applied on a relative basis. Finally, it may be worthwhile to investigate financial components of the aforementioned financial aspects of aforementioned KOSDAQ-listed sample firms, which may, in turn, related to the increase of firm value from shareholders’
viewpoints. That is, by identifying the components comprising each financial aspect, it is plausible to identify and control the relationship between each financial aspect and firm value, which may be overall beneficial for value-maximization of the domestic firms at the national or provincial level.
2. Literature Review
Previous literature associated with the current study, which has been frequently cited in modern finance are reviewed in this section.
In the study of [4], it was theorized that the optimal policy to maximize firm value with no corporate taxes, is not to issue debt at all, which is associated with the “underinvestment problem”
in relation to corporate shareholders. It was also presented that real options with positive investment opportunities, may have limitations due to its weaknesses as security for debt claims in the thin and imperfect secondary markets. [5]
presented that corporate profitability had a statistically significant and negative relationship
with the market-value based debt ratios, while the other proxy variables representing growth, non-debt tax shields, volatility and corporate asset structure were not generally significant factors to affect each differently defined measure of leverage. The study by [6] presented their research results on the financial profile of two performance indicators such as profitability and growth rate of firms in the eleven European nations during the sample period of 1992 to 2000. Whereas the effects related to the firm and the corporate group proxies were the largest to account for the variation of both the profit rate and growth rate, the magnitudes of all the variables seemed to be smaller in the latter (i.e., the growth rate) than in the former variable.
Meanwhile, the effect of capital structure on profitability utilizing the U.S. sample firms, [7]
investigated financial aspect of profitability to obtain results applicable to cross-border capital markets. There were positive relationships between short-term debt ratio and ROE, and total debt ratio and ROE for the manufacturing and the service sample industries. In the study by [8], Corporate debt ratio, size and asset utilization ratio had statistically significant and positive in relation to the growth rate measured by the annual change of total assets. Meanwhile, growth rate of subsidiaries that belonged to the Korean business conglomerate, “chaebol” was financially analyzed by applying static and dynamic panel data models in the study of [9]. To specify, both market-and book-value-based leverage ratios, a lagged dependent variable, a firm's size and foreign ownership were demonstrated to be statistically important factors to affect the dependent variable of annual change in total assets. Moreover, return on assets and type of securities exchange showed statistical significance after controling industry and time dummy variables, when applying conditional quantile regression (CQR) model.
Regarding corporate capital structure, [10] tested
several financial factors as proposed determinants of corporate capital structure. The results revealed that, industry classifications had statistically significant effects to determine corporate debt ratio, while firm size and operating leverage had prominent importance on capital structure with curvilinear and linear relationships, respectively. Interestingly, the study by [11] tested any statistical relationship between capital structure, and industry classification and business risk that were defined by several measures. They also found that only a few industries among total sample industries showed differences in terms of capital structure. It was performed by [12] which financially compared between firms with headquarters in the U.S. and Japan. The results showed that there was a statistically significant difference between firms in the two capital markets in capital structure after controlling for financial variables such as profitability, business risk, growth, and firm size.
Another comparative study on corporate leverage was performed by [13] between multinational and domestic firms in the U.S. capital market. The results indicated that multinational firms that belonged to the IT related industries, on average, had a lower debt ratio than their domestic counterparts. Moreover, among the sample nations, the level of international diversification may statistically significantly and inversely affect corporate leverage ratio only for the U.S. sample firms. In the study of [14], at the higher quantiles of leverage analyzed by the conditional quantile regression (CQR) model, it was find that there was insignificant or negatively significant relationship between firm size and its debt ratio.
However, corporate non-debt tax shields and asset tangibility showed their significant impacts to determine leverage ratio for the sample firms with headquarters in the Korean capital market.
Empirical test were conducted by [15] to identify financial variables which may influence the capital structures of the domestic firms
belonging to Korean chaebols during the period before the Asian financial crisis occurred. The results from the test revealed evidence that the debt level of the chaebol firms was, on average, higher than that of their non-chaebol domestic firms. In the study, the chaebol firms were identified to possess the following financial characteristics: large firm size and high growth rate (in sales), low profitability, and low business risk. By utilizing sample firms listed on the KOSDAQ stock market, [16] presented that all or most financial variables in the models showed significant impacts on the corporate leverage as measured by book- or market-value basis. The sample firms listed on the “Prime” or “Venture”
section in the stock market, were discriminated in the variables of profit margin and asset turnover from a statistical viewpoint. Finally, in the study of [17], three hypotheses were formulated and tested to identify financial determinants of profitability indices measured by book- and the market-value bases. financial variables, such as business risk and intangible assets, are found to be positively significant to determine difference in level between the book-valued and the market-valued profitability indices for the chaebol firms classified into the high-tech sector, while corporate debt ratio showed its negative and significant effect on the difference for their counterparts in the low-tech sector.
3. Empirical Research Settings
3.1 Data Sampling Criteria and ProposedVariables
Criteria for the sample observation of firms with headquarters in Chungcheong province in the Republic of Korea, are described in the following table, <Table 1>. As an extension of the previous literature such as [16] and [18],
sampling criteria adopted in the present study are analogous to those used in the previous studies for the purposes of comparability and consistency.
Table 1. Criteria for sample firms in Chungcheong province listed in the KOSDAQ Exchange 1. Data for all explanatory variables are available for at least
nine years from the year 2010 to 2018 (for 9 years).
2. Sample firms are listed in the KOSDAQ (Korea Securities Dealers Automated Quotation) as of the end of the fiscal year of 2018.
3. All financial data are collected on the basis of the consolidated financial statements, if available.
4. Data are included in the population of the database of KisValue sourced by the NICE.
5. Headquarters of each firm is located in Chungcheong province inclusive of North Chungcheong and South Chungcheong provinces, Daejeon Metropolitan City and Sejong Metropolitan Autonomous City in the domestic capital market.
6. Firms in the financial and regulated industries are excluded in the final sample data.
To recap, the reference time period of the empirical study covers the post-period of the global financial turmoil to reduce a spillover effect related to the crisis, as described. Given total number of KOSDAQ-listed sample firms (842 firms) across total 25 industries in the study, the number of firms with headquarters in Chungcheong province are 96, while firms whose headquarters are located in the other provincial areas in the domestic capital market are 746.
Firms in the latter sample group are employed as a control group against the former group in one of the hypotheses, as described later.
As for the proposed variables as proposed determinants of each financial aspect of this study, they are describe in <Table 2>, that are used as explanatory variables for each relevant hypothesis. Moreover, the dependent variables for each financial aspect are defined as follows:
(1) Profitability (PROF) = EBIT (i.e., earnings before interest & taxes) / total assets (2) Growth rate (GROWTH) = annual growth
rate in sales during the examined period (3) Market-value based debt ratio = total
liabilities / (total liabilities + book value of
preferred equity + market value of common equity)
Table 2. List of explanatory variables
Definition Symbol Measurement
Profitability (as a Dependent Variable)
of the Previous Fiscal Year
Lag1_PROF EBTIt-1/Total Assetst-1
Growth Rate (as a Dependent Variable)
of the Previous Fiscal Year
Lag1_GROWTH (Salest-1 – Salest-2)/
Salest-2
Market-valued Financial Leverage
(as a Dependent Variable) of the Previous Fiscal Year
Lag1_MEVER
Total Liabilitiest-1/(Total Liabilitiest-1 + Book Value of Preferred Equityt-1 + Market Value of Common
Equityt-1) Interaction between
High-tech Firm and
Lag1_PROF INTERPROF
Dummy Variable for High-tech Firm
Multiplied by (Lag1_PROF) Interaction between
High-tech Firm and
Lag1_GROWTH INTERGROWTH
Dummy Variable for High-tech Firm
Multiplied by (Lag1_GROWTH) Interaction between
High-tech Firm and
Lag1_MLEVER INTERMLEVER
Dummy Variable for High-tech Firm
Multiplied by (Lag1_MLEVER)
Firm Size SIZE Natural Logarithm
of Sales Amount
Firm Value FVALUE
(Total Liabilities + Market Value of Common Equity +
Book Value of Preferred Equity)/Total
Assets Change in Cash
holdings CASHHOLD
(Cash and Cash Equivalentst – Cash
and Cash Equivalentst-1)/Tota
l Assetst
Foreign Ownership FOS Proportion of
Foreign Ownership in Common Equity
Business Risk VOLAT
3.3 x (EBIT / Total Assets) + 1.0 x
(Sales / Total Assets) + 1.4 x (Net
Income / Total Assets) + 0.6 x (Market Value of
Equity / Book Value of Equity) Change in Tangible
Assets TASSET
(Tangible Assetst–Tangible
Assetst-1)/Total Assetst-1) Research &
Development (R&D)
Intensity RANDD R&D Expenses /
Sales
3.2 Postulation of Each Hypothesis
Followings are the hypotheses postulated to identify determinants of each of the three financial aspects.
<First null hypothesis on each financial aspect of KOSDAQ listed firms in Chungcheong province>
H1: Concerning the three corporate financial aspects such as profitability, growth rate and capital structure in the Korean capital market, there may not exist any statistically significant elements to influence each financial aspect for firms with headquarters in Chungcheong province and listed on the KOSDAQ stock exchange during the investigated period of 2010 to 2018.
On the methodologies to estimate each model which tests the first hypothesis, relatively robust empirical methodologies are separately applied to reinforce validity of results. They include static panel data model, robust regression model and Tobit (censored) regression model and stepwise regression model. Moreover, the robust regression model was employed to reduce effects related to possible outliers in the sample dataset and the entry and deletion criteria for a statistical significance were set at the 5% level for proposed variables to apply a stepwise regression model. In particular, Tobit (censored) model is outlined as follows.[19]
It assumes that observations are asymmetrically distributed in terms of values (i.e., positive vs.
negative). Yt = a + bXt + Ut if Yt > 0, or Yt = 0 if Yt < 0.
In relation to the estimation procedures for the model, an index function, It = a + bXt + Ut is set to zero if It < 0; otherwise, the value of a dependent variable is set to It. The joint probability density function is given by the following expression:
P1=P (1/σ) f[(Yt - a - bXt)/σ], if Yt > 0.
P2= P F[(-a -bXt)/σ], if Yt < 0.
Based on the likelihood function for the sample observations as L = P1 x P2, each coefficient in the model (i.e., a and b) can be estimated by athe maximum likelihood estimation, such that L is maximized with respect to the parameters.
Moreover, when applying static panel data model in the first and last hypotheses, that are applied to the cross-section and time-series observations of the present study, a priori specification tests such as Wald test, Hausman test and Breusch-Pagan (BP) test are also applied as precedents prior to running the panel data model. After obtaining results from the tests, most “appropriate model” is finally selected among the fixed effect (FE), the random effect (RE) and pooled OLS models, as presented in [20].
<Second null hypothesis to compare components of each financial aspect between KOSDAQ listed firms in Chungcheong province and their counterparts in the other provinces>
H2: Since the global financial turmoil in 2008, there exist no significant financial factors to affect profitability (or growth or capital structure), that may discriminate between KOSDAQ listed firms with headquarters in Chungcheong province and counterparts in the other provinces inclusive of Seoul Metropolitan area and Kyounggy province.
By comparing firms belonging to two subsets of the sample data, it is plausible that superiority or inferiority of financial factors to influence each financial aspect can be empirically detected on a relative basis. After identifying deficient factors, the former subset (i.e., firms in the Chungcheng province) is expected to improve or ameliorate them toward value-maximization.
That is, proposed financial factors that may determine each financial aspect, are employed to identify statistical differences between firms with headquarters in Chungcheong province and their counterparts located in the other domestic
Proposed Variable
Fixed Effects Model
Robust
Reg. Model Stepwise Reg. Model
Tobit Reg. Model
Constant -0.806* -0.631* -1.049* -1.102*
Lag1_MLEVER 0.464* 0.803* 0.645* 0.642*
INTERMLEVER -0.196* -0.009 -0.048* -0.046*
SIZE 0.047* 0.030* 0.049* 0.052*
GROWTH 0.005 0.001 <N.A.> 0.005
PROF -0.439* -0.408* -0.650* -0.623*
FVALUE -0.038* -0.001 -0.023* -0.012
region. For estimation, as described in [21], binary dependent variable models such as logit model, probit model and complementary log-log (CLOG) regression models (with ascending and descending order), are separately applied to test financial components that may discriminate between the two subsets.
<Third Null Hypothesis on Corporate Value Maximization>
H3: There are no statistically significant time- lagged effects of each financial aspect to determine corporate value-maximization for firms with headquarters in Chungcheong province during the sample period.
In the last hypothesis, it will be of interest and intrigue to examine which financial aspect may statistically important to determine corporate value. As a proxy variable representing corporate value, the ratio of the market-value over the book-value based assets (FVALUE) as Tobin’s Q is used as a dependent variable in each model.
Throughout this empirical procedure, it is expected to identify time-lagged effects of each financial aspect in relation to corporate value for the sample group of KOSDAQ listed firms in Chungcheong province in the global economic crisis period.
4. Financial Analysis and Implications
4.1 Results of First HypothesisIn regards to the consequences obtained from the first hypothesis test, three econometric methodologies of the static panel data, robust regression and stepwise regression models were used for estimation, while additional estimation applying Tobit regression model was also implemented to examine significant financial factors of the capital structure, as previously described. Results of the tests for each financial aspect (i.e., corporate profitability (PROF) and capital structure (MLEVER)) are reported in the
following tables of <Table 3> and <Table 4> for KOSDAQ listed firms with headquarters in Chungcheong province. (Due to the limitations of the space, the table presenting the output of the financial aspect of growth rate (GROWTH) is not reported in the study. However, they are illustrated in the context of this section and also available upon request from the author.)
Table 3. Results of the financial determinants of corporate profitability (PROF) for KOSDAQ listed firms in the domestic capital market during the sample period
Proposed
Variable Fixed Effects Model
Robust Regression
Model
Stepwise Regression
Model
Constant -0.367* -0.048 -0.173*
Lag1_PROF 0.109 0.263* 0.258*
INTERPROF 0.039 0.200* 0.194*
SIZE 0.014* 0.003 0.008*
MLEVER -0.066* -0.073* -0.087*
GROWTH 0.008* 0.029* 0.016*
FVALUE -0.029* -0.036* -0.025*
CASHHOLD 0.037* 0.017 <N.A.>
FOS 0.005 0.041* 0.059*
VOLAT 0.035* 0.037* 0.030*
TASSET 0.037* 0.013 <N.A.>
RANDD -0.456* -0.130* -0.223*
Note: * denotes the statistical significance of the estimated coefficient at the 5% level. <N.A.> denotes the statistical insignificance of the coefficient of a variable, given the 5% level for the entry and deletion levels of the stepwise regression model.
Table 4. Results of the financial determinants of capital structure (MLEVER) for KOSDAQ listed sample firms in the domestic capital market during the sample period
CASHHOLD -0.036 0.029 <N.A.> -0.046 FOS -0.297* -0.023 <N.A.> -0.032 VOLAT -0.018* -0.016* <N.A.> -0.009
TASSET 0.118* 0.212* 0.150* 0.142*
RANDD -0.104 -0.070 <N.A.> -0.055 Note: Denotations indicated in <Table 3> are also applicable to this table.
First, based on the results reported in <Table 3>, it was empirically detected that, among the total eleven proposed variables, find variables of market-value based leverage ratio (MLEVER), growth rate (GROWTH), Tobin’s Q (FVALUE), business risk (VOLAT) and R&D intensity (RANDD) were shown to be statistically significant, having the same signs of the estimated coefficients) to influence the dependent variable of PROF across all of the models. On the selection of the “best” model in terms of the static panel data model, fixed effects model was chosen among the fixed effects, random effects and pooled OLS models for the dependent variable of PROF, as is presented in
<Table 3>. The results of the a priori specification test are the Wald test (F = 3.29 (p-value < 0.0001)), Breusch-Pagan test (m=32.24 (p-value < 0.0001)) and Hausman test (m = 67.77 (p < 0.0001)), respectively. Since all of the tests are not accepted at the 5% level, the fixed effects model was finally chosen as the “best” model.
Besides, F-value and adjusted R-square estimated by applying to the stepwise regression model are 128.49 (p-value < 0.0001) and 59.94%, respectively. Second, only two proxy variables of PROF and TASSET were found to have pronounced effects to determine the dependent variable of corporate growth rate (GROWTH) across all of the models, while pooled OLS model was chosen to be the most “appropriate” one, based on the statistics of the a priori specification tests. Finally, the proposed variables such as Lag1_MLEVER, SIZE, PROF and TASSET were found to statistically significant to account for the level of financial leverage (MLEVER)
across all the models including Tobit regression model, that is reported in <Table 4>. Even if the constant term showed its significance across all the models, F-value and adjusted R-square obtained from the stepwise regression analysis are relatively high with the values of 362.07 (p-value < 0.0001) and 73.85%, respectively. The results indicate that additional proxy variables may not need to be employed to account for the level of corporate capital structure for the sample dataset.
4.2 Results of Second Hypothesis
Concerning the outcome of the second hypothesis in <Table 5>, the proposed variables to discriminate corporate profitability for KOSDAQ listed firms in Chungcheong province were statistically compared to counterparts whose headquarters are located in the other provincial area. To specify, 3 variables of Slag_PROF, INTERPROF, SIZE (among total 12 variables) were found to discriminate the former subset of KOSDAQ listed firms in Chungcheong province from those in the other regional area.
To analyze the estimated coefficient of Slag_PROF with a negative sign, non-linear relationship between Lag1_PROF and the categories of the two comparison subsets seems to exit, given that the probability to model is set to “1” for the former group of the sample firms in the models. INTERPROF also showed its importance as a discriminating financial factor between the two subsets of total sample dataset, indicating that the probability to be included in the former will be higher, if profitability in the previous fiscal year (Lag1_PROF) in the high-tech sectors becomes larger. As reported in <Table 6>
for the dependent variable of growth rate (GROWTH), SIZE (as firm value) and PROF (as profitability) revealed their pronounced effects with opposite signs as financial determinants to differentiate between the two subsets from a statistical perspective. (Even if the outcomes on
Proposed
Variable Logit
Model Probit
Model CLOG CLOG
(Ascend)
Constant 1.488 0.686 1.184 -0.730
Slag_GROWTH -0.003 -0.002 -0.003 0.001
Lag1_GROWTH -0.060 -0.028 -0.058 0.019
INTERGROWH 0.113 0.056 0.106 -0.041
SIZE -0.140* -0.075* -0.130* 0.060*
MLEVER 0.046 0.030 0.038 -0.029
PROF 1.111* 0.589* 1.041* -0.464*
FVALUE 0.047 0.026 0.043 -0.022
CASHHOLD -0.593 -0.319 -0.548 0.256
FOS -0.136 -0.061 -0.136 0.040
VOLAT -0.056 -0.031 -0.053 0.025
TASSET 0.039 0.026 0.032 -0.027
RANDD -0.701 -0.386 -0.649 0.316
Overall
Goodness of Fit 25.901* 26.498* 25.669* 27.153*
Note: Denotations indicated in <Table 5> are also applicable to this table.
Proposed Variable
Fixed Effects Model
Robust Regression
Model
Stepwise Regression
Model Proposed
Variable Logit Model Probit
Model CLOG CLOG
(Ascend)
Constant 0.174 0.829 1.416 -0.849
Slag_PROF -7.5385* -3.957* -7.082* 3.076*
Lag1_PROF -1.7958 -1.000 -1.655 0.835*
INTERPROF 3.688* 1.954* 3.458* -1.547*
SIZE -0.149* -0.080* -0.139* 0.064*
MLEVER -0011 -0.004 -0.011 0.001
GROWTH 0.024 0.015 0.021 -0.014
FVALUE 0.020 0.011 0.019 -0.009
CASHHOLD -0.504 -0.268 -0.466 0.211
FOS 0.043 0.046 0.027 -0.056
VOLAT -0.021 -0.011 -0.020 0.009
TASSET 0.306 0.163 0.284 -0.129
RANDD -0.777 -0.422 -0.721 0.344
Overall
Goodness of Fit 40.111* 41.132* 39.754* 42.288*
Notes: 1. Coefficients were estimated by the method of maximum likelihood estimation (MLE) by applying a Wald Chi-Square test. Overall goodness of fit of the model was estimated by the likelihood ratio (LR) method. 2. * denotes statistical significance at the 5% level.
the financial aspect of capital structure (MLEVER) are not presented in the section, they are consistent with the aforementioned findings for GROWTH.) To specify, as SIZE (or PROF) increases, the probability to be categorized into the former subset of the sample firms will be lower (or higher) in the post global economic turmoil era.
Table 5. Results to identify financial differences of corporate Profitability (PROF) for KOSDAQ listed firms with headquarters in Chungcheong province and counterparts in the other area in the Korean capital market during the period of 2010 to 2018
Table 6. Results to identify financial differences of growth rate (GROWTH) for KOSDAQ listed firms with headquarters in Chungcheong province and counterparts in the other area in the Korean capital market during the sample period
4.3 Results of Third Hypothesis
Regarding the consequences of the last hypothesis tests to detect existence of time-lagged effects of corporate profitability in the current or prior fiscal years to affect corporate value (FVALUE), they are presented in
<Table 7> for KOSDA listed firms in Chungcheong province. Along with PROF as current corporate profitability, four time-lagged variables from Lag1_PROF to Lag4_PROF were employed in each binary dependent variable model to identify the relationship. In almost all models, only one variable (i.e., PROF) was shown to be statistically significant to inversely affect current corporate value for the sample subset during the sample period. On the other hand, there seems to be, on average, a 2-year duration between for corporate growth rate (i.e., Lag2_GROWTH) and FVALUE in <Table 8>, while there is no significant association between capital structure and FVALUE for the sample firms in the majority of the models, even if the results are reported in the section. Meanwhile, the variables of SIZE, VOLAT and RANDD that were employed as control variables, were found to be statistically pronounced and consistent factors to determine the dependent variable of FVALUE across all the models for each financial aspect.
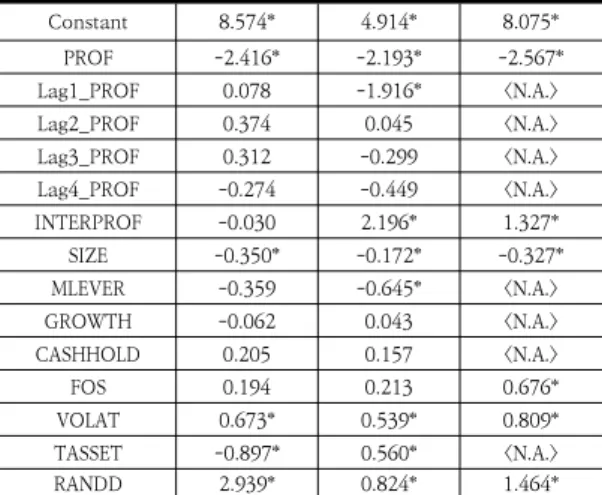
Table 7. Results of time lagged effects between corporate value and Profitability during the period 2014 to 2018 (5 fiscal Years)
Constant 8.574* 4.914* 8.075*
PROF -2.416* -2.193* -2.567*
Lag1_PROF 0.078 -1.916* <N.A.>
Lag2_PROF 0.374 0.045 <N.A.>
Lag3_PROF 0.312 -0.299 <N.A.>
Lag4_PROF -0.274 -0.449 <N.A.>
INTERPROF -0.030 2.196* 1.327*
SIZE -0.350* -0.172* -0.327*
MLEVER -0.359 -0.645* <N.A.>
GROWTH -0.062 0.043 <N.A.>
CASHHOLD 0.205 0.157 <N.A.>
FOS 0.194 0.213 0.676*
VOLAT 0.673* 0.539* 0.809*
TASSET -0.897* 0.560* <N.A.>
RANDD 2.939* 0.824* 1.464*
Note: * denotes the statistical significance of the estimated coefficient at the 5% level. <N.A.> denotes the statistical insignificance of the coefficient of a variable, given the 5%
level for the entry and deletion levels of the stepwise regression model.
Proposed Variable Random effects Model
Robust Regression
Model
Stepwise Regression
Model
Constant 7.440* 5.540* 8.071*
GROWTH -0.005 0.042 <N.A.>
Lag1_GROWTH -0.436* 0.027 <N.A.>
Lag2_GROWTH 0.071 0.063* 0.084*
Lag3_GROWTH 0.036 0.019 <N.A.>
Lag4_GROWTH 0.014 -0.007 <N.A.>
INTERGROWTH 0.482* 0.007 <N.A.>
SIZE -0.293* -0.200* -0.327*
PROF -2.565* -2.40* -1.949*
MLEVER -0.316 -0.598* <N.A.>
CASHHOLD 0.136 0.173 <N.A.>
FOS 0.965* 0.177 0.720*
VOLAT 0.749* 0.564* 0.814*
TASSET -0.668* 0.398 <N.A.>
RANDD 2.169* 0.697* 1.350*
Note: Denotations indicated in <Table 7> are also applicable to this table.
Table 8. Results of time lagged effects between corporate value and growth rate during the sample period (5 years)
4.4 Financial Implications
In terms of the financial implications on the results obtained from the first hypothesis test on the three financial aspects such as corporate profitability, growth and capital structures for KOSDAQ listed firms in Chungcheong province, it is empirically confirmed that five proposed variables of market-value based leverage ratio
(MLEVER), growth rate (GROWTH), Tobin’s Q (FVALUE), business risk (VOLAT) and R&D intensity (RANDD) showed significant effects to determine current profitability level during the sample period as reported in <Table 3>. Except the effect of MLEVER on profitability, the results are not generally compatible with the findings obtained in [22] that had employed the data to cover the period of the year 2005 to the year 2010. [7] presented that the effects of the capital structures of the U.S. sample firms on profitability may change from a positive one to a negative one, based on the well-known “trade-off theory of optimal structure” in finance. Given the outcome of the negative relationship between profitability and financial leverage found in this study, it seems that firms in Chungcheong province, on average, appear to still maintain an excess debt ratio beyond the optimal level of capital structure after the global economic crisis, as the same (negative) relationship was previously found in [22]. Even if the proxy variables to represent corporate growth (GROWTH) and the ratio of market- to book-value based assets (MLEVER) showed insignificant effects on profitability in the study by [22], these financial factors are found to be statistically important factors to affect the dependent variable (PROF). In accordance with the outcome obtained from the study, it is plausible that future investment opportunities held by the KOSDAQ-listed firms are realized into enhancing corporate profit after the global economic crisis. Moreover, the estimated coefficient of FVALUE with a negative sign in
<Table 3> may suggest that the sample firms overall continue to invest in profitable future investment opportunities, including R&D expenditures during the sample period, that may result in the negative relationship between FVALUE and PROF. For instance, according to the K-IRFS (the Korean version of International Financial Reporting Standards), if the R&D
investments are recorded as expenses, it may result in the decrease of the dependent variable, while they are recorded as intangible assets, that may also decrease of the variable. This phenomenon is also confirmed by the negative relationship between the variable of RANDD and the dependent variable, that is found across the models in <Table 3>. Finally, it is empirically identified that increase of business risk (VOLAT) of the sample firms is negatively related to profitability, that is supported by modern finance.
Regarding the results of the financial components of GROWTH in the first hypothesis, two variables of PROF and TASSET showed pronounced effects to determine the dependent variable of corporate growth from a statistical perspective. The positive and significant relationship between corporate profitability and growth rate found in this study is compatible with the finding of [1]. Therefore, in terms of Myers’ Pecking theory, it seems that KOSDAQ-listed firms in Chungcheong province continue to take advantage of lower costs of capital in association with their internally generated funds in the era after the global financial crisis, which enables them to support future investment opportunities. Meanwhile, [8]
presented that a firm’s asset utilization ratio had a positive influence on growth rate in sales. From a financial viewpoint, the finding of the positive relationship between TASSET and GROWTH in this study may imply that firms in the province fully and effectively utilize their tangible assets to provide products and services for their customers, as described in [1]. Meanwhile, on the financial factors to determine the capital structures for the sample firms, that is reported in <Table 4>, four proposed variables such as Lag1_MLEVER, SIZE, PROF and TASSET were demonstrated to be significant to influence the level of financial leverage across all the adopted models. In contrast to the finding in [23] that had
covered the sample period of 2010 to 2014, the proxy variable to represent firm size (SIZE) had an important effect to determine corporate leverage in this study. It is consistent with the conventional theory of finance such that large firm in size may have a high debt ratio due to a decrease of bankruptcy risk and the myth of “too big to fail” phenomenon. Moreover, the positive relationship between the level of financial leverage in the previous fiscal year (i.e., Lag1_MLEVER) and current corporate leverage in
<Table 4>, may imply that firms in Chungcheong province try to maintain their optimal capital structures through setting “target” capital structure that are consistent over the period.
That is, given the changes in stage of economic conditions, they seem to adjust their current debt ratios that are analogous to the levels of the prior fiscal year in order to achieve the optimal capital structures.
With respect to the financial interpretation on the results of the second hypothesis tests, there are only 3 variables of Slag_PROF, INTERPROF, SIZE (among total 12 explanatory variables in relation to corporate profitability) that may finally discriminate KOSDAQ listed firms in Chungcheong province from their counterparts in the other regional area, as reported in <Table 5>. To specify, there seems to be a non-linear relationship between Lag1_PROF and the categories of the two comparison sample groups, as indicated by the estimated coefficient of Slag_PROF with a negative sign. It implies that, as Lag1_PROF increases, the probability to be classified into the former subset (i.e., firms in Chungcheong province) becomes larger, but gradually decreases beyond a certain level of the value of Lag1_PROF. The result may suggest that KOSDAQ-listed firms in the former subset may, on average, have higher profitability up to a certain level. However, profit maximization may not be achieved thereafter, when compared with the level of the firms in the latter group. In terms
of the financial interpretation on the results of INTERPROF whose estimated coefficients are statistically significant across all models, it indicates that the probability to be included in the former group will be larger, if corporate profitability in the previous fiscal year in high-tech sectors increases. Therefore, firms in Chungcheong province, that operate their businesses in high-tech industries inclusive of IT sectors seem to be more efficient to increase operating profits through sales increase or cost savings, in comparison with their counterparts in high-tech sectors in the other regional area.
Meanwhile, it is interesting to identify that the variables such as market-value based leverage, growth rate and business risk, which had revealed their importance to significantly discriminate between the two subsets in [22], did not show their discriminating power during the post global financial crisis, as reported in <Table 5>. Therefore, as spill-over effects in relation to the global economic turmoil gradually dissipated, firms in the former subset seemed to share commonalities in level with their counterparts in the latter group, in terms of the aforementioned financial elements. As presented in <Table 6> for growth rate and as for the outcome for the capital structure, two proposed variables (i.e., PROF and SIZE) showed their commonalities as significant factors to discriminate between firms in the Chungcheong province and counterparts in the other domestic capital market, in terms of both financial aspects such as growth rate and financial leverage. Accordingly, it is evident that profitability of the firms in the former subset is higher than that of the firms in the latter subset, even if firm size of the former group is, on average, smaller than their counterparts.
In regard to the outcomes of the last hypothesis test, there are few studies so far to detect a relationship between each financial aspect (PROF, GROWTH or MLEVER) including its time lagged effects and corporate value (FVALUE)
that is measured by Tobin’s Q, as described earlier. Concerning the result of a relationship between corporate profitability and firm value, it is surprising that, across all models, only one of the profitability indices (i.e., profitability in the current year (PROF)) seems to be a significant factor to determine corporate value without any time lagged effects, as reported in <Table7>.
Moreover, there is a “negative” relationship between PROF and FVALUE, that is not generally expected by the theory of finance. Based on the consequences, corporate value of KOSDAQ listed firms in Chuncheong province seems to be overwhelmingly determined by the net present value of growth opportunities (PVGO) (rather than corporate earnings with no growth) in the domestic capital market. The rationale is plausible since major lines of business of the firms in the region are related to growth sectors including IT industries with high growth potential, as presented in [23]. Second, it was found that there is, on average, a 2-year (time-lagged) duration for corporate growth rate (i.e., Lag2_GROWTH) to be positively reflected on corporate value (FVALUE), as presented in <Table 8>. However, there was no relationship between the time-lagged explanatory variables of market-value based leverage and corporate value in almost cases, whose table is not reported in the section, as previously described. In other words, the levels of financial leverage in the current and previous fiscal years may not have pronounced effects to determine the current firm value during the sample period. Finally, it may be noteworthy that, among the other control variables that were employed in each model to identify a relationship between each financial aspect and firm value, SIZE, VOLAT and RANDD consistently showed important impacts to determine the dependent variable, as shown in
<Table 7> and <Table 8>. Even if firm size increases, firms in Chungcheong province may not, on average, be efficiently operated to take
advantage of economies of scale or scope, whereas business risk and R&D expenditures are likely to function as a virtuous cycle to maximize corporate value.
5. Concluding Remarks
The study examines financial issues which may be essential factors to achieve corporate objective as value-maximization. That is, as an extension of the previous literature inclusive of [1] and [22], three financial aspects are examined on the basis of the previous reports done by [2]
and [3]. Financial components that may determine each of the three aspects are empirically examined in terms of each relevant hypothesis postulated. In the first hypothesis, financial catalysts to influence each aspect of firms with headquarters in Chungcheong province are tested on an absolute basis. On the other hand, in the second hypothesis, comparisons are made on a relative basis for two comparison subsets that consist of the firms with headquarters in Chungcheong province and counterparts in the other domestic capital market that includes the Seoul Metropolitan area and Kyounggi province.
Foreign and domestic investments are likely to increase in volume and size in Chungcheong province afterwards, as the regional area seems to be changed by a new business climate as presented in [1]. Given that more active or positive capital transactions made by foreign institutional investors are anticipated to be induced in the particular area, results obtained from this research are expected to be effectively compared with those derived from the previous studies conducted in international or domestic context. The study may suffer from redundant and legitimate empirical weaknesses that may, in part, arise from adopting different empirical research settings, when compared to those
obtained from the previous literature. However, results are expected to contribute to improving corporate value of firms in the province by adjusting or changing the levels of financial factors found in the study. Moreover, mutual benefits for both firms in Chungcheong province and their counterparts in the other regions are expected to be available from the results derived from this study. That is, by identifying commonalities and disparities of results between two subsets of the sample firms located in different provinces, each firm located in these provinces may pay more attention to improving any deficiencies of the financial components detected in the study, which eventually contributes to enhancing its corporate value.
Furthermore, future reserch is also warranted in the subject of the aforementioned three financial aspects, in order to identify financial difference or similarity between domestic large enterprises, and small and medium enterprises or across borders inclusive of advanced and emerging capital markets.
References
[1] H. Kim, “Financial Profile of the Growth Engine for Corporations Headquartered in Chungcheong Province in the Republic of Korea”, Journal. of International Trade & Commerce, Journal of International Trade & Commerce, Vol.12, No.1, pp.21-33, 2016.
DOI: http://dx.doi.org/10.16980/jitc.12.1.201602.21 [2] Bank of Korea, “Financial Statement Analysis for Firms in
Daejon and Chungnam Province for the Year, 2017 [Internet]. Republic of Korea, Available From:
https://www.bok.or.kr (accessed May 4, 2020) [3] Bank of Korea, “Financial Statement Analysis for
Firms in Chungbuk Province for the Year, 2017 [Internet]. Republic of Korea, Available From:
https://www.bok.or.kr (accessed April 13, 2020) [4] S. Myers, “Determinants of Corporate Borrowing”,
Journal of Financial Economics, Vol.5, No.2, pp.147-175, 1977.
DOI: https://doi.org/10.1016/0304-405X(77)90015-0 [5] S. Titman and R. Wessels, “The Determinants of
Capital Structure Choice”, Journal of Finance, Vol.43, No.1, pp. 1-9, 1988.
[6] J. Goddard, M. Tavakoli, J. Wilson, "Sources of Variation in Firm Profitability and Growth", Journal of Business Research, Vol.62, No.4 pp. 495-508, 2009.
DOI: https://doi.org/10.1016/j.jbusres.2007.10.007 [7] A. Gill, N. Biger, N. Mathur, "The Effect of Capital
Structure on Profitability: Evidence from the United States", International Journal of Management, Vol.28, No.4, Part1, pp. 3-16, 2011.
[8] J. Kim and C. Ham, “An Empirical Study on the Characteristic of Financial Structure in Chungbuk Regional Firms,” Hoegye-Yeongu, Vol.10, No.2, pp.
355-377, 2005.
[9] H. Kim, “Searching for Growth Engine: for the Firms Belonging to the Chaebol in the Korean Capital Market”, Journal of the Korea Academia-Industrial Cooperation Society, Vol.15, No.12, pp. 7134-7147, 2014.
DOI: https://doi.org/10.5762/KAIS.2014.15.12.7134 [10] M. Ferri and W. Jones, “Determinants of Financial
Structure: A New Methodological Approach”, Journal of Finance, Vol.34, No.3, pp. 631-644, 1979.
[11] T. Shin,, K. Zumwalt, N. Naidu, “Industry Class as a Determinant of Optimal Financial Structure”, Midsouth Journal of Economics, Vol.4, No.2, pp. 49-59, 1980.
[12] C. Kester, “Capital and Ownership Structure: A Comparison of United States and Japanese Manufacturing Corporations”, Financial management, Vol.15, No.1, pp.5-16, 1986.
[13] K. Lee and C. Kwok, “Multinational Corporations vs.
Domestic Corporations: International Environmental Factors and Determinants of Capital Structure”, Journal of International Business Studies, Vol.19, No.2, 195-217, 1988.
[14] B. Fattouh, P. Scaramozzino, L. Harris, “Capital Structure in South Korea: A Quantile Regression Approach”, Journal of Development Economics, Vol.76, No.1, pp. 231-250, 2005.
DOI: https://doi.org/10.1016/j.jdeveco.2003.12.014 [15] H. Kim and P. Berger, “The Management
Characteristics of Korean Chaebols vs. Non-Chaebols:
Differences in Leverage and Its Ramifications: Myth or Reality?” Advances in Management, Vol.2, No.11, pp. 26-35, 2009.
[16] H. Kim, “Further Investigations on the Financial Attributes of the Firms Listed in the KOSDAQ Stock Market”, International Journal of Contents, Vol.9, No.2, pp. 27-37, 2013.
DOI: https://doi.org/10.5392/IJoC.2013.9.2.027 [17] H. Kim, “Further Study on the Financial Changes in
Corporate Profitability for Korean Chaebol Firms”, Journal of International Trade & Commerce, Vol.15, No.3, pp. 109-124, 2019.
DOI: http://dx.doi.org/10.16980/jitc.15.3.201906.109
[18] H. Kim, “Further Analyses on Corporate Research &
Development Intensity for Firms Listed on the KOSDAQ Stock Market”, Journal of International Trade & Commerce, Vol.15, No.4, pp. 19-39, 2019 DOI: http://dx.doi.org/10.16980/jitc.16.2.202004.19 [19] R. Ramanathan, Introductory Economerics with
Applications (2nd ed.). p.520-523, Orlando, Fl.:
Harcourt Brace & Company, 1992.
[20] H. Park, Practical Guides to Panel Data Analysis [Internet]. Available From:
http://www.iuj.ac.jp/faculty/kucc625/writing/panel_g uidelines.pdf (accessed Jan. 21, 2017)
[21] P. Allison, Logistic Regression Using SAS; Theory and Applications (2nd ed.). p.91-96, Cary, NC: SAS Institute, 2012.
[22] H. Kim, “A Review on the Financial Profile of Profitability for the KOSDAQ Listed Firms Headquartered in ‘Chungcheong’ province in the Republic of Korea”, Joournal of the Korea Academia-Industrial Cooperation Society, Vol.14, No.11, pp. 5476-5487, 2013.
DOI: https://doi.org/10.5762/KAIS.2013.14.11.5476 [23] H. Kim, “Financial Determinants of Leverage among
KOSDAQ-listed Firms with Headquarters in Chungcheong Province, South Korea”, Journal of International Trade & Commerce, Vol.12, No.4, pp.
53-69, 2016.
DOI: http://dx.doi.org/10.16980/jitc.12.4.201608.53
Hanjoon Kim [regular member]
• Feb., 1985 : Yonsei Univ., Seoul.
• Sept., 1987 : The George Washington Univ., MBA, U.S.A.
• Jan., 1999 : Boston University DBA (Major: Finance), U.S.A.
• Mar. 2010 ∼ Present : Hoseo Univ. Dept. of Business Administration. Professor
<Research Interests>
Corporate Finance, M&A